

Abstract
We present a molecular system where polymerization is controlled externally by tuning the elastic energy of the monomers. The elastic energy, provided by a DNA molecular spring, destabilizes the monomer state through a process analogous to domain swapping. This energy can be large (of ∼10 kT) and thus drive polymerization at relatively low monomer concentrations. The monomer-dimer equilibrium provides a measurement of the elastic energy of the monomer, which in this construction appears limited by kink formation in the DNA molecular spring, in accord with previous theoretical and experimental investigations of the elasticity of sharply bent DNA.
Introduction
Self-assembly of smaller molecular units into larger ordered molecular structures is ubiquitous in molecular biology (1), from the folding of a polypeptide chain into the native structure of the protein, to the assembly of the replication machinery on the DNA, to the polymerization of tubulin monomers to form the microtubule. In the case of the polymerization of identical units, a globular protein, for example, one can ask what destabilizes the monomers; this is generally hydrophobic interaction with the water (including hydrogen bonding), or the electric field due to surface charges. Polymerization then excludes the water from the surface of contact between monomers, or removes the electric field from space by pairing positive and negative charges, respectively. A further possibility is that monomers are destabilized by an elastic energy if that energy is released upon polymerization. There are indeed polymerization processes in the cell driven by this mechanism. Rousseau et al. has demonstrated experimentally that dimerization by domain swapping in the case of the cell cycle regulatory protein p13suc1 is driven by the elastic energy associated with the presence of two proline residues in the hinge loop of the monomer state (2). Protein aggregation related to amyloid diseases may also be related to such mechanisms, for example, Yang et al. propose a domain-swapped trimer, stabilized partially by relaxation of elastic energy, as a candidate structure for the “minimal prion infectious unit” (3).
In general, domain swapping, first described by Bennett et al. in the case of the dimerization of diphtheria toxin (4), provides a mechanism for elastic energy-driven polymerization, since all atomic contacts can, in principle, be identical in the monomer and the dimer, with the energy difference between the two states coming mostly from elastic stresses in the monomer.
Other elastic energy-driven mechanisms are also possible, such as has been proposed theoretically for the case of the dynamic instability of the microtubule (5). Indeed, it is possible that elastic energy-driven polymerization is not uncommon both in the healthy cell and in disease.
Here we introduce an artificial molecular system where we have external control of the elastic energy of the monomers, and use this elastic energy to drive the formation of dimers and higher order polymers. Exhibiting this process allows us to measure the elastic energy of the monomers.
Our system is a protein-DNA chimera slightly different from the ones we introduced previously (6) for the purpose of controlling protein conformation through the DNA molecular spring. The difference is that in the present construction we attach two different DNA oligomers to specific (Cys-mutated) sites on the surface of the protein, so that when we add a complementary DNA strand to build up tension in the molecular spring (as explained below), the double-stranded (ds) part of the spring has a nick (Fig. 1). The nick, as it turns out, does not completely relax the elastic energy of the spring, but it does introduce the possibility of alternative conformations (dimers, trimers, etc.; see Fig. 1) where the elastic energy is essentially zero. Thus, as the elastic energy of the monomer is increased by hybridizing longer complementary DNA strands to the molecular spring, we observe the appearance of dimers, trimers, and higher order polymers in the system at equilibrium.
Figure 1.

Cartoon of the elastic-energy-destabilized two-arms chimera. (a) Two different 30-base-long ssDNA oligomers are covalently and specifically attached to mutated Cys residues on the surface of the protein (Guanylate kinase or GK, light yellow) through heterobifunctional crosslinkers (green). One DNA oligomer (or DNA arm) is attached by the 5′ end and the other by the 3′ end. Hybridization with a complementary 60-mer DNA (red) forms a 60-bp DNA molecular spring (with a nick in the middle). The geometric end-to-end distance of the DNA, from the protein structure (assumed rigid) and including the crosslinkers, is 10 nm. The contour length of the dsDNA 60-mer is 20 nm. Thus, the molecular spring introduces a substantial elastic energy in the system. The cartoon was constructed using several structure components from the Protein Data Bank spatially arranged together with the Molecular Graphics Visualization Tool RasTop 2.0 (http://www.inrp.fr/Acces/biotic/rastop/help/default.htm); protein, DNA, and crosslinker are approximately to scale. The GK structure is 1ZNW and the DNA is from the nucleosome structure 1KX5. (b) Cartoon of the dimerization process; same color code as in panel a. Due to the nick in the molecular spring, monomers can release elastic energy by forming dimers through the hybridization of the complementary DNA with the DNA arms from two different chimeras. Because the number of paired DNA bases is the same in both states, the equilibrium of dimerization only depends on the balance of the elastic free energy and the entropic free energy in the system. This process is analogous to domain swapping.
There are previous examples of using the elastic energy of bent dsDNA to control molecular processes. In the work by Saghatelian et al. (7), a DNA detector was engineered by conjugating an enzyme molecule with a single-stranded (ss) DNA oligomer which, at its other end, is attached to an inhibitor of the enzyme. In this state, the inhibitor inactivates the enzyme by blocking the catalytic site. In the presence of the complementary DNA, the enzyme is activated due to the removal of the inhibitor from the active site. In this situation, the large elastic energy of the dsDNA in the inhibitor-bound state overwhelmingly biases the equilibrium toward the low-elastic-energy, inhibitor-unbound state (7).
Our own work with three different proteins (8–10) showed how the elastic energy of the DNA molecular spring can be used, in principle, to bias the conformation of any protein, and thus, control the protein's activity.
Similarly, the large hybridization free energy of dsDNA has been utilized by Miduturu and Silverman (11) and Zelin and Silverman (12) to control the folding of a ribozyme. In their work, two short pieces of complementary ssDNA (10–15-mers, corresponding to ∼20 kT of hybridization free energy) are specifically attached to distant sites of a folded RNA molecule. In the hybridized state, the dsDNA constraint forces unfolding of the RNA molecule by destabilizing the intramolecular hydrogen bonds of the RNA (11,12). The equilibrium between the folded and unfolded states of the ribozyme thus depends on the difference between the hybridization free energy of the dsDNA duplex and the free energy change of disrupting the secondary structure of the RNA.
In our system, we use the DNA molecular spring as the source of the elastic energy that drives the polymerization process. The process is analogous to domain swapping, but here the swapping is between DNA strands. The relatively high elastic energy of the DNA molecular spring allows us to drive the polymerization process at relatively low (μM) monomer concentrations. Because the equilibrium constant of dimerization depends exponentially on the free energy difference between the monomer and dimer state, it ultimately represents a sensitive measurement of the elastic energy of the monomer. This is, of course, the elastic energy of the entire system: DNA spring plus protein. In future experiments, the protein can be replaced by a stiff molecule or a polymer of known elastic properties, such as ssDNA. In this way, the elastic energy of the DNA spring alone could be measured. Then we can go back and extract the elastic energy of the protein under stress. Thus, there are several motivations to examine quantitatively the process of Fig. 1 b.
Materials and Methods
Mutagenesis and protein purification
Guanylate kinase (GK) from Mycobacterium tuberculosis (gene Rv1389c) was modified by site-directed mutagenesis (Stratagene, La Jolla, CA) to remove the native cysteins from the wild-type and add two Cysteins at sequence sites 75 and 171 for later DNA conjugation. The mutant gene was cloned and expressed according to the method in Choi and Zocchi (9).
Protein-DNA complex synthesis
Two 30-mer DNA arms with different sequences,
Strand A: 5′-GAGTGTGGAGCCTAGACCGTGAGTTGCTGG-3′,
Strand B: 5′-CAGTGGTGCGACCGACGTGGAGCCTCCCTC-3′,
were purchased amino-modified at the 5′ and 3′ ends, respectively (Operon, Huntsville, AL). The sequence is randomly generated with the requirement of 60% GC content to ensure high pairing specificity and binding affinity between the DNA arms and the complementary strands. The sequence is also selected to minimize the amount of self-complementarity for eliminating unwanted secondary structure.
One-hundred nmoles of each DNA arm were incubated with 5 μmoles of the hetero-bifunctional crosslinker NHS-PEO2-Maleimide (Pierce, Rockford, IL), in the conjugation buffer (100 mM sodium phosphate, 150 mM NaCl, and 1 mM EDTA at pH 7.5 (Sigma, St. Louis, MO)) for 1 h at room temperature. The amino group of the DNA arm reacts with the NHS-ester end of the crosslinker. The DNA-crosslinker construct was then passed through a Uno Q1 ion-exchange column (Bio-Rad, Hercules, CA) in HPLC to remove excess uncoupled crosslinkers and the desired DNA-crosslinker conjugate was eluted by a salt gradient. Corresponding fractions were collected and concentrated by an Amicron spin column (Millipore, Billerica, MA) to ∼50 μM. The buffer used in this HPLC purification and the following purification was the same as the conjugation buffer, but at pH 7.0. One-hundred nmoles of protein were reduced in 5 mM TCEP (Pierce) for 30 min at room temperature to regenerate free sulfhydryl groups and then passed through a Bio-Sil size-exclusion column (Bio-Rad) in HPLC to remove TCEP from the reduced protein. The protein fractions were collected and concentrated to ∼50 μM.
To sequentially couple the two different DNA arms with the protein, the crosslinker-DNA conjugate (strand A) was first incubated with the reduced protein for 2 h. The mixture was then passed through the Q1 ion-exchange column with a slow salt gradient to separate the one-arm Protein-DNA chimera from uncoupled proteins and two-arms chimeras (Fig. 2 a). Usually the yield of one-arm chimera was ∼20% (20 nmol for this synthesis scale). The purified one-arm chimera was then incubated with the second DNA-crosslinker conjugate (strand B) to form the desired two-arms chimera. The final synthesized two-arms chimera was purified by Ni-NTA chromatography (Qiagen, Valencia, CA) through the His-tag on the protein and verified by the corresponding molecular mass on a denaturing SDS-PAGE (10% Tris-HCl Ready gel, Bio-Rad) with Coomassie blue staining of the protein (Fig. 2 b). The product concentration was quantified by Bradford's assay (Bio-Rad) and the final yield of two-arms chimera was ∼5% of the initial amount of protein used.
Figure 2.

(a) Ion exchange HPLC profile representing the purification of one-arm chimera. The essential step for the synthesis of a hetero-two-arms chimera is to isolate the one-arm chimera from the unwanted constructs after the first coupling step. Ion-exchange chromatography is used, which separates molecules primarily by charge. At pH ∼7, the GK molecule is slightly positively charged (pI ∼7.5) and eluted in the initial part of the time series (not shown). Therefore, in an increasing gradient of counterions (Cl−), the one-arm chimera elutes earlier than the uncoupled arm DNA, which is more negatively charged. The two-arms chimera elutes last because of its high DNA content. The signal is the ultraviolet absorbance at 260 nm (the absorbance maximum of DNA) and the slanting line is the salt gradient. The eight shaded areas under the curve are the collected fractions further analyzed in the corresponding lanes of the protein gel in panel b, to help assign the HPLC peaks. (b) Denaturing protein gel (10% SDS-PAGE) of the eight chromatography fractions indicated in panel a. The gel is stained for protein with Coomassie blue. The one-arm chimera has a molecular mass of ∼35 kDa, which corresponds to the strong band in lane 3. The large peak in panel a spanning lanes 5–7 shows very low protein content and is confirmed to be uncoupled arm DNA by a native TBE gel with DNA staining (data not shown). The weak band in lane 8 with 45 kDa molecular mass is the homo-two-arms chimera. In the synthesis, the ratio of protein/arm DNA was 1.5:2. (c) Diagnostics of hetero-two-arms chimera synthesis by SDS-PAGE (visualized by Coomassie staining). Lane A shows the sample after conjugation of the first DNA arm but before HPLC purification of the one-arm chimera (i.e., before the chromatography step of a). Lane B shows the sample after conjugation of the second DNA arm. The two strong bands in lane A are GK (∼25 kDa) and one-arm chimera (∼35 kDa). Some homo-two-arms chimera (∼45 kDa) can also be seen. The single strong band in lane B is the successful two arm chimera (∼45 kDa) and the thin band at ∼35 kDa is the residual one-arm chimera. No visible uncoupled GK is left in lane B. The yield of correctly constructed chimera, judging from the band intensity, is >85%. A molecular mass marker is shown on the left.
Hybridization protocol and polymerization measurements
The purified two-arms chimera was mixed with complementary DNAs of varying length ℓ (18, 24, 30, 39, to 60 bp in 3-bp steps, from Operon). These complementary DNAs hybridize to the central portion of the molecular spring; e.g., for ℓ = 18, nine bases are complementary to the 3′ end of strand A and the other nine are complementary to the 5′ end of strand B. As a no-tension negative control of the fully hybridized molecular spring (ℓ = 60), an eight-nucleotide poly-(T) stretch was introduced in the middle of the sequence of the 60-mer complementary DNA; the resulting ss gap in the molecular spring would release the stress by providing a flexible hinge. The final concentrations of the two-arms chimera and complementary DNA were adjusted to 1 μM in hybridization buffer (100 mM phosphate, 100 mM NaCl, and 1 mM EDTA, pH 7.0); samples were incubated at room temperature overnight to achieve chemical equilibrium.
Because the standard annealing procedure for hybridization could not be used, the question arises whether overnight incubation does, in fact, produce the equilibrium state. Because of the nick in the molecular spring, what has to hybridize correctly are DNA sequences 30 bases long (in the most unfavorable ℓ = 60 case). For our sequences, the longest nonnative duplex (giving rise to a hairpin structure) is six basepairs long, which has a half-life of ∼102 s (13). Other equilibration processes are faster; for example, two molecules of complementary DNA could bind each to one of the two DNA arms. Displacement of one of the two complementary strands by the unpaired ss part of the other has an estimated time constant of 10−3 s (14). Thus, the timescales for getting out of these metastable states are short compared to our 12 h incubation time. As an experimental control, we measured the thermal melting profiles for our longest sequences, after hybridization by thermal annealing and after hybridization by 12 h incubation at room temperature, and found them indistinguishable. We conclude that the samples are in (or close to) equilibrium.
Native TBE PAGE with a 4–20% gradient gel (Bio-Rad) at 120 V for 80 min in TBE buffer (89 mM Tris borate, 2 mM EDTA, pH ∼8.3) was used to separate monomers, dimers, and higher-order polymers in the samples. The gel was stained with SYBR Gold DNA dye (Invitrogen, Carlsbad, CA) for at least 30 min and imaged over an ultraviolet transilluminator. The gel image was analyzed with the software ImageJ (15) to determine the band intensities. The same gel staining and documentation procedures were used in the following parts.
Delayed gel loading assay for monitoring monomer-dimer exchange during electrophoresis
To examine whether there is any evolution of the apparent equilibrium between monomers, dimers, and other polymers in the course of electrophoretic separation, a low-percentage homogeneous polyacrylamide gel (5% TBE PAGE, Bio-Rad) at 100 V in TBE buffer was used. The hybridized sample with ℓ = 60 was consecutively loaded into the wells every 5 min for eight times. The total running time was 55 min.
Determination of the equilibrium constant of dimerization for ℓ = 60
The equilibrium constant between monomers and dimers at different chimera concentrations (0.4–3.2 μM) was evaluated. A 1.25-fold molar excess of 60-mer complementary DNA was used in this experiment to ensure all chimera molecules were hybridized. The concentration of monomers and dimers was derived from the band intensities using a calibration curve constituted of 60-mer ssDNA samples with known quantities (from 0.3 to 10 pmol).
Results
Our experimental system is the two-arms protein-DNA chimera shown in Fig. 1. The protein is the enzyme Guanylate kinase (GK) from Mycobacterium tuberculosis, modified by site-directed mutagenesis to remove the two internal Cysteins (Cys40 → Ser, Cys193 → Ser; these two Cys form a disulfide bridge in the oxidized form of the wild-type protein) and add two Cys at positions 75 and 171 (Thr75 → Cys, Arg171 → Cys). The enzymatic activity of this mutant is comparable to that of the wild-type, although this is not important for our present purposes. To the two Cysteins we covalently attach (by the hetero-bifunctional crosslinker NHS-PEO2-Maleimide) two different 30-bases-long DNA oligomers, which are modified with primary amino groups on short spacer arms at the 5′ and 3′ ends, respectively, to react with the crosslinker. The details of this sequential two-steps synthesis process, which results in the two-arms chimera of Fig. 1 a, are given in Materials and Methods. Fig. 2 displays the sequential conjugation of the two DNA arms to the protein. The denaturing protein gel (SDS-PAGE; Fig. 2 c) displays the increased molecular mass of the protein-DNA chimeras. The molecular mass of GK and single DNA arms are 25 kDa and 10 kDa, respectively. Therefore, the one-arm and two-arms chimeras should have mobilities roughly equivalent to 35 kDa and 45 kDa. After conjugation of the first DNA arm (Fig. 2 c, lane A), we see two bands corresponding to the uncoupled GK molecule (the band close to the 25 kDa standard) and the one-arm chimera (the band close to the 37 kDa standard). After conjugation of the second DNA arm (Fig. 2 c, lane B), we see a band with molecular mass between 37 and 50 kDa, corresponding to the two-arms chimera.
The yield of two-arms chimera in the final samples, after various purifications, is good (>85%, see Materials and Methods), but the yield in terms of final amount of chimera compared to initial amount of reactants (protein and amino-modified DNA) is rather poor, of ∼5–15%. Nonetheless, from one synthesis batch we obtain typically a few nanomoles of purified chimera, which is enough for the experiments. These consist in adding to aliquots of the two-arms chimera progressively longer complementary DNA strands, resulting in the ds chimeras shown schematically in Fig. 3. The aliquots are then run on a native gel to assess the contents of monomers, dimers, and higher order polymers. Namely, as the length of the complementary DNA is increased, the ds portion of the molecular spring will, on average, have to bend, while the ss portion has to stretch, introducing an elastic energy in the system. Although there is a nick in the ds DNA spring, the nick does not completely release the elastic energy, as seen from our measurements below. The reason is that base stacking around the nick is still intact and provides mechanical stability to the DNA molecule for small bending (16,17).
Figure 3.

Elastic energy-driven polymerization visualized by gel electrophoresis. The medium is a native 4–20% gradient polyacrylamide gel in TBE, stained for DNA with SYBR Gold. Aliquots of purified two-arms chimera were incubated overnight with equimolar complementary DNA with length varying from 18 to 60 bases and then loaded in the gel. On top of each lane, we indicate schematically the molecular spring conformation in the monomer. The monomer band shifts to lower mobilities for increasing ℓ reflecting the increased molecular mass of the construct. For ℓ = 42, a dimer band appears, as well as a faint slower band, which is probably trimers and also higher molecular mass objects stuck at the start of the lane. For ℓ = 60, the dimer band is relatively stronger, as are the higher molecular mass objects. Each lane in this gel contains the same molar amount of chimera. The multiple faint bands behind the dimers for ℓ = 60 possibly correspond to different configurations of the trimers and higher order polymers (e.g., circular versus linear) and impurities (originating, for example, from chimeras built from two identical DNA arms, which give rise to linear polymers). The lane 60+Gap is a control which shows that polymerization is driven by the elastic energy. Namely, the complementary DNA is a 68-mer, which is the 60-mer of the previous lane with an insertion of an 8-bases-long poly-(T) stretch in the middle. The resulting ss gap in the molecular spring relaxes the elastic energy. Correspondingly, the dimer and trimer bands disappear. The bands which do not disappear (compare lanes 60 and 60+Gap) correspond to linear polymers formed by impurities.
On the other hand, the system can choose to relax this elastic energy by forming dimers, trimers, etc., as sketched in Fig. 1, where in each case the dsDNA spring can be straight, i.e., relaxed. However, forming dimers and other polymers entails the entropic cost of pairing off two chimeras, so this process is favored only if the elastic energy of the monomers exceeds the entropic free energy cost of dimerization.
In Fig. 3, each lane contains ∼5 pmol of two-arms chimera hybridized with equimolar complementary DNA. The length of the hybridized part of the DNA, or hybridization length ℓ, increases from 18 bp to 60 bp, at which point the two 30-mer DNA arms are fully hybridized. Due to the comparatively low charge of the protein in the Protein-DNA chimera, the chimera and the hybrids migrate much slower than the same DNA components without the protein load. For the two-arms chimera hybridized with an 18-mer complementary DNA, the monomer has the same mobility as a 140–150-bp-long dsDNA in this gel (data not shown). With increasing ℓ, the band-shifting pattern shows that the fastest band in each lane is the monomer of different ℓ. For ℓ = 42, a dimer band (and a faint trimer band behind the dimer) appears, corresponding to the onset of bending of the ds part of the DNA spring. Finally, for ℓ = 60, a strong dimer band and higher order polymers appear, illustrating the high elastic energy of the sharply-bent dsDNA spring.
The last lane (60+Gap) is a control that shows that the driving force for polymerization is indeed the elastic energy. Namely, we have added a short (eight bases) poly-T stretch in the middle of the complementary 60-mer, which creates an ss gap in the ds spring, thus relaxing the elastic energy. Correspondingly, we observe that the dimer and trimer bands disappear. The remaining faint bands in the lane are due to other polymers formed by impurities in the sample (such as one-arm chimeras).
The structures of each monomer with varying ℓ are drawn roughly to scale above each lane. From the geometry of the protein-DNA chimera, we expect zero elastic energy for ℓ < 30 but a finite elastic energy for ℓ = 42, so the onset of dimerization in Fig. 4 qualitatively agrees with this picture. By measuring, from the gels, the relative populations of monomers and dimers, we can measure the elastic energy of the monomers, supposing the elastic energy of the dimers is essentially zero (since in the dimers, because of the geometry, the DNA spring can be relaxed). Considering the equilibrium between monomers and dimers (Fig. 1), the essential parts of the chemical potentials are, respectively,
| (1) |
Here, Fel is the elastic energy associated with the molecular spring being under tension, while kT ln(X) is the chemical potential associated with the concentration of chimeras: XM is the mole fraction of monomers, XD the mole fraction of dimers. The equilibrium condition is
| (2) |
so from Eqs. 1 and 2, we obtain
| (3) |
where XD/XM2 = Keq is the equilibrium constant of dimerization. Equation 1 says that the monomer state is destabilized by an elastic energy Fel > 0, and there is a reference chemical potential corresponding to the mole fraction of monomers XM < 1. In the dimer state, the elastic energy is zero (the spring is relaxed), but there is the entropic cost of pairing two monomers together, expressed by the chemical potential corresponding to the mole fraction of dimers, XD. The hybridization energy of the DNA does not appear because it is the same for the two states (all bases are paired).
Figure 4.
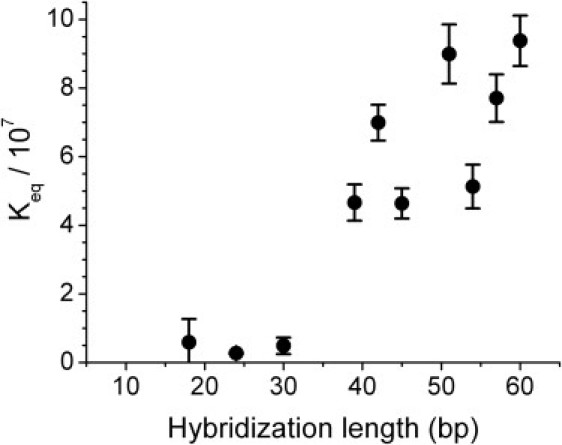
The dimerization equilibrium constants with varying hybridization length ℓ. The data are the average of three experiments; the error bars are ±1 SD. The equilibrium constant Keq is calculated from Eq. 4. The molar fractions of monomer and dimer are related to their molar concentrations by XM = CM/55.6, XD = CD/55.6, with 55.6 M being the concentration of water. The concentrations CM and CD are measured by integrating the band intensity across the lane and subtracting the background, using the software ImageJ (http://rsbweb.nih.gov/ij/). The band intensities are converted to concentrations by comparing with standards with known DNA content in different lanes of the same gel. For ℓ = 18, 24, and 30, the equilibrium constant is unmeasurably small, since ID ≈ 0 within the resolution of the measurement. Geometrically, we do not expect tension in the molecular spring for these hybridization lengths. The increase in the equilibrium constant from ℓ = 39 to ℓ = 60 is evidence of a positive elastic energy destabilizing the monomer state.
In Eq. 1, Fel is the part of the free energy difference between monomer and dimer states, which has to do with molecular conformation, i.e., excluding concentration effects; this quantity is measured in the experiments. To interpret Fel as the elastic energy of the molecular spring is a different matter. For example, if in the monomer state only a fraction of the bases are paired (because of the competition between basepairing energy and elastic energy), then Fel represents a free energy made up partially of elastic energy and partially of hybridization energy. Additionally, Fel is the elastic energy of the whole system: molecular spring plus protein. If the protein is stiffer than the DNA spring, this is essentially the energy of the spring. If the protein is very soft, then Fel ≈ 0. If the stiffness of the protein is comparable to the stiffness of the spring, then the elastic energy resides partly in the DNA spring and partly in the protein. In addition, there are, in principle, entropic contributions to the free energy difference between monomers and dimers originating from the different phase space available to the DNA spring in the two cases. Thus, the microscopic interpretation of Fel is delicate. On the other hand, the thermodynamic interpretation of Fel is unambiguous.
We note that the expression for the concentration dependence of the chemical potential, kT ln(X), which corresponds to the entropy of mixing of the ideal gas, is an excellent approximation here since X ≪ 1. Indeed, typical chimera concentrations in the experiment are C ≈1 μM, so that X ≈10−6/55 ≈2 × 10⁻⁸, the concentration of water being ∼55 M.
In the experiment, we measure the equilibrium constant Keq from the intensities I of the corresponding bands on the gel (Fig. 3). In the notation of Eq. 1,
| (4) |
where ID and IM are the intensities of the dimer and monomer bands, respectively, and γ is the conversion factor between intensities and molar fractions that we obtain from the standards with known DNA contents. The equilibrium constant Keq measured in the experiments for ℓ = 18 to 60 is displayed in Fig. 4.
Keq is unmeasurably small (XD ≈ 0 within our resolution) for ℓ < 30, then increases with ℓ, being of ∼108 for ℓ > 40, which corresponds to Fel ∼10 kT. The apparent scatter in the experimental points corresponds, in fact, to an interesting modulation of the elastic energy, which we discuss below.
Several controls were performed to establish whether the monomer and dimer bands in the gels do, in fact, represent the equilibrium distributions of these species in the experiments. The issue is mainly monomer-dimer interconversion in the gel. The mere fact that we observe bands means interconversion is not too fast, but to examine this point quantitatively we employed the delayed gel loading assay, where the ℓ = 60 sample was repetitively loaded into different lanes of the same gel with 5 min delay time between any two successive lanes. The point is to verify whether the apparent value of Keq = XD/XM2 changes as the bands migrate down the gel. The monomer and dimer bands were well resolved from the background after 20 min of electrophoresis (Fig. 5 a) and Keq was measured from the different lanes corresponding to running times from 20 to 55 min (Fig. 5 b). No systematic trend of change in the equilibrium constant was observed, showing that interconversion, even in this low percentage (5%) gel, is unimportant over the timescale of the gel assay. It was also noticed that the variation of the equilibrium constant among lanes (the scatter of the points in Fig. 5 b) is of ∼20%, which is comparable to other measurements of equilibrium constants. A 20% uncertainty in the measurement of Keq translates into a very precise determination of the elastic energy, which allows us to resolve the modulation we discuss below.
Figure 5.

This is a control to check that monomer-dimer interconversion in the gel does not affect the measurement of Keq. Namely, as the bands migrate down the gel, the measured Keq = XD/XM2 remains constant. (a) Chimeras with 1.25× molar excess 60-mer complementary DNA were loaded into consecutive lanes with a delay of 5 min between successive loadings. Separation of monomers and dimers from the background is achieved after 20 min of electrophoresis. The band intensities of monomers and dimers are nearly unchanged up to 55 min of running through the gel. For the longest running time, the excess 60-mer has run to the end of gel and is not seen in the image. (b) Keq measured for the different lanes in panel a. The equilibrium constants are randomly scattered ∼8 × 10⁷ with ∼20% variation. There is no systematic trend for Keq with increasing gel running time.
A second control to verify that we are measuring equilibrium concentrations of monomers and dimers was to test whether Keq is independent of the total chimera concentration (the initial amount of chimera used to prepare the samples). This was tested with a titration experiment where the total chimera concentration changed from 0.6 μM to 3.2 μM with 1.25-fold molar excess of 60-mer complementary DNA (Fig. 6). The range of concentrations is limited on the lower side by the minimum DNA quantity (in the dimer band, which is the dimmer one) which can be detected by the method used (staining with SYBR Gold fluorescent dye), and on the higher side by overloading of the gel. Within the concentration range tested, the equilibrium constant at different concentrations is the same within a 20% scatter, which is generally the error in estimating the constant from gel images (see arguments above). We conclude that the experiment does measure equilibrium distributions and therefore the true equilibrium constant of dimerization. Using the overall mean value of the equilibrium constant obtained from various chimera concentrations, the elastic energy calculated from Eq. 3 for ℓ = 60 is (Fig. 6):
We now come back to the apparent scatter of the experimental points in Fig. 4. Closer inspection reveals a periodic modulation (Fig. 7), with a period of ∼10 bp, which corresponds to one turn of the DNA helix. In Fig. 7 the data for the elastic energy (calculated from the Keq of Fig. 4 using Eq. 3) are fitted using a sigmoidal curve (for the overall increase of Fel with ℓ) plus a sinusoidal modulation,
| (5) |
where α, β, ɛ, λ, and ϕ are the fitting parameters. The best fit gives a period λ = 9.6 ± 0.2 bp for the sinusoidal modulation, and an amplitude ɛ = 0.19 ± 0.03 kT.
Figure 6.
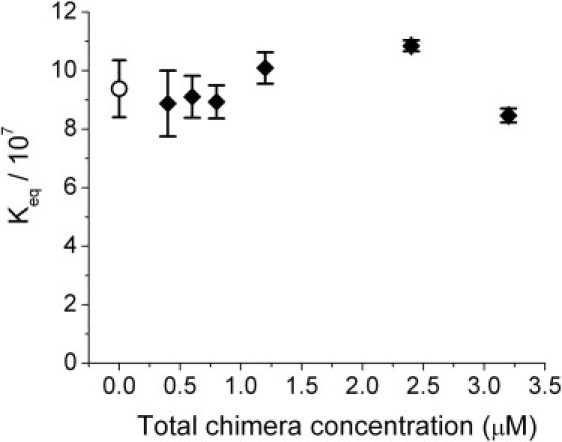
This is a control showing that the measured Keq is independent of total monomer concentration, as it should be if we are measuring equilibrium populations of monomers and dimers. The solid diamonds show Keq measured for the given total monomer concentration and the open circle is the overall mean value calculated from all the data. The error bars indicate ±1 SD estimated from four experiments.
Figure 7.
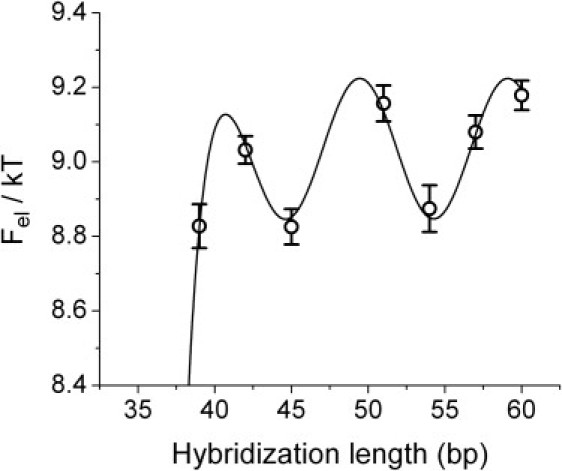
The same data of Fig. 4 plotted for the hybridization length ℓ > 39 in terms of the elastic energy . The line is a fit with a function that contains a sinusoidal modulation of period λ (see text). The value λ = 9.6 bp gives the best fit, which is shown. Thus, the elastic energy is modulated with a period equal to the period of the DNA helix. This graph displays three interesting quantities: the period λ = 9.6 bp; the amplitude of the modulation ɛ = 0.19 kT; and the phase of the modulation ϕ (the energy is maximum for a relative phase of the two ends of the complementary strand of 2π).
The five parameters of the fit notwithstanding, this is significant; for example, forcing λ = 12 or λ = 7 throws the fit completely off the data. The autocorrelation function of the data also shows a peak corresponding to the same periodicity (Fig. 8).
Figure 8.
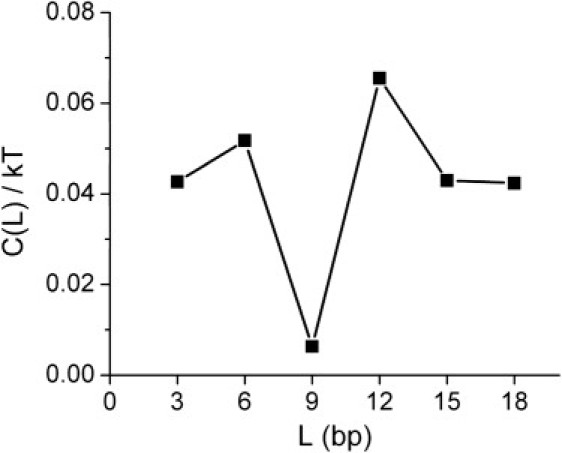
The correlation function , where E is the elastic energy of Fig. 7 and the average is over the different ℓ-values. The minimum for L ∼9 bp corresponds to the periodic modulation seen in Fig. 7.
The average periodicity of the B form of DNA is 10 bp, but this value varies somewhat with sequence. We conclude that we are observing modulations of the elastic energy of the bent DNA corresponding to the phase relationship of the two ends of the complementary strand. It is not surprising that this effect should exist, but Fig. 7 represents nonetheless a remarkable measurement, given the tiny amplitude (∼0.2 kT) of the modulation. This effect is related to (but different from) the much larger modulation in j-factors observed in cyclization experiments (18), which, unlike the present effect, is directly related to the torsional stiffness of the double helix. The energy modulation of Fig. 7 arises because of the dependence of the bending rigidity of dsDNA on the geometric structure of the helix.
Discussion
The main purpose of this article is to introduce an artificial molecular system where an externally controlled elastic energy drives a polymerization process. By externally controlled, we mean that the elastic energy can be modulated by adding to the monomer different ligands, in this case, DNA oligomers of different lengths. The elastic energy provided by the molecular spring can be large (of ∼10 kT), so polymerization can be driven at relatively low polymer concentrations (here, μM concentrations). For comparison, in the case of the domain swapping driven by the two-Prolines loop (2) the elastic energy is substantially smaller (∼1 kT), and correspondingly, polymerization occurs at mM concentrations.
Our goal is to develop this molecular spring-based system into a quantitative tool to measure certain mechanical properties of biological macromolecules, proteins in particular. To this end, more work is needed to disentangle the elastic response of the molecular spring from the elastic response of the protein.
To extract quantitative information, the first question is whether the intensities in the bands on the gels (Fig. 3) faithfully represent the equilibrium distribution of monomers, dimers, etc. in the experiment. After introducing the complementary DNA, the samples are left to equilibrate overnight before loading on the gel, and we have checked that this is sufficient to establish equilibrium (samples equilibrated for >72 h show the same monomer-polymer pattern on the gels). In the gel, diffusion is drastically slowed down and the rates of dimer formation and dissociation are correspondingly smaller. These time constants must be sufficiently slow as compared to the 1 h gel running time. If this was not the case, we would observe a smear instead of the sharp monomer and dimer bands.
We performed two controls to verify that the band intensities do represent the equilibrium populations: one is to check that the measured equilibrium constant Keq does not change as the bands migrate down the gel; the second is to check that the measured Keq is independent of the total concentration of monomers.
Assuming that the measurements of Fig. 4 represent the true equilibrium distributions, then one result stands out, namely that the measured elastic free energy Fel grows very slowly with ℓ for 40 < ℓ < 60: apart from the ∼0.2 kT modulation, Fel is essentially flat in this regime. If the dsDNA part of the molecular spring was behaving like a flexible rod, and if the end-to-end distance of the spring was fixed (i.e., if the protein was rigid), then the elastic energy would grow much faster with ℓ, once the ds part of the spring starts to bend (i.e., for ℓ > 40 in our geometry). For example, in the WLC model (19,20), in which the elastic energy per unit length ℓ has the form
| (6) |
where R is the radius of curvature and B ≈ 200 pN·nm2 is the elastic modulus of dsDNA derived from the persistence length Lp = 50 nm, one can estimate that in our geometry the difference in elastic energy between ℓ = 42 and ℓ = 60 is in excess of 10 kT. Therefore, there must be a soft spot in our construction, which limits Fel, and it is either related to the DNA spring or to the protein itself. The numbers are such that the former seems likely. Yan and Marko (21) proposed that the elastic energy of sharply bent dsDNA is limited by the process of opening a short bubble of single strands, which provides a flexible hinge and releases the tension. Their theory was originally aimed at explaining cyclization experiments (22) with ∼100-bp-long DNA, which found cyclization rates several orders-of-magnitude larger than expected from an elastic energy of the form in Eq. 6. They show (21) that a free energy cost of bubble opening μ ≈ 11 kT is consistent with the cyclization experiments. The quantity μ contains the free energy contribution of opening the basepairs (referred to a final state where the strands are dissociated) plus the entropy cost of the ss loop which is the bubble. The unparing energy evidently depends on the sequence, but is ∼2 kT for AT pairs and ∼3 kT for GC pairs, with further (positive or negative) contributions depending on the nearest-neighbor bases (because of the stacking interactions); the entropic cost is of ∼3 kT for a 3-bp bubble (which represents the minimum free energy configuration for the kinked DNA; for the statements above, see (21) and references therein). In our case, the bubble would mostly form at the nick, because the 3 kT entropic contribution is then absent, so the mechanism of Yan and Marko (21) gives for our case a limit to the elastic energy of 11 − 3 = 8 kT, close to what we observe.
In future experiments, we will independently examine the elastic energy of the nicked DNA, by replacing the protein with something stiff. In the other limit, we can think of softening the protein (or hardening the DNA) so that the protein becomes the elastic energy limiting structure. It would then be possible to measure the work necessary to locally unfold the protein (i.e., pull out a part of the polypeptide chain).
We stress once again that ours is a thermodynamic measurement of the free energy difference between monomers and dimers, which we denote by Fel. Most of Fel is elastic in nature, meaning that it originates from deforming parts of this polymeric construct (the DNA spring and/or the protein) with respect to the unconstrained equilibrium conformations of the protein and DNA. However, there are also other contributions; for example, the entropy of the relaxed DNA in the dimer is different from the entropy of the isolated DNA, due to the excluded volume. In fact, a precise partitioning of Fel into elastic and other contributions is probably ambiguous. Ultimately, both the monomer and the dimer states represent in fact many states, which can only be adequately described microscopically through an appropriate statistical mechanics model of the DNA-protein complex. Our basic observation, though, is that the free energy difference between monomers and dimers, Fel, is essentially governed by the degree of hybridization of the DNA spring, hence Fel reflects mostly the elastic energy introduced into the monomers by the molecular spring.
The dimerization mechanism provides a very sensitive tool to measure elastic energies, because of the exponential relation between the quantity measured (Keq) and Fel (Eq. 3). This is visible in the remarkable measurements of Fig. 7, where we pick up a 0.2 kT modulation of the elastic energy due to the 10-bp periodicity of the DNA helix. This represents yet another interesting mechanical feature of this molecule.
To conclude, we have presented a molecular system where an externally controlled elastic energy drives a polymerization process. The elastic energy of the monomers in this construction appears to be limited by the formation of a kink (denaturation bubble) in the DNA spring, consistent with the cyclization experiments (22) and the theory (21). This, however, depends on the relative stiffness of the protein and the molecular spring. With a softer protein, or a stiffer spring, one could explore the mechanical response of the protein instead. The polymerization process exhibited by this artificial molecular system is analogous to domain swapping (4), which is one mechanism of polymerization in the cell, and experiments with the molecular springs may in the future contribute to explore the energetics of such systems.
Acknowledgments
We thank the Arbin group at UCLA for the use of the Protein Expression Lab facilities, and Robijn Bruinsma for discussions.
This material is based on research sponsored by Defense Microelectronics Activity (DMEA) under agreement Nos. H94003-06-2-0607 and H94003-07-2-0702.
The United States Government is authorized to reproduce and distribute reprints for Government purposes, notwithstanding any copyright notion thereon.
References
- 1.Whitesides G.M., Grzybowski B. Self-assembly at all scales. Science. 2002;295:2418–2421. doi: 10.1126/science.1070821. [DOI] [PubMed] [Google Scholar]
- 2.Rousseau F., Schymkowitz J.W.H., Wilkinson H.R., Itzhaki L.S. Three-dimensional domain swapping in p13suc1 occurs in the unfolded state and is controlled by conserved proline residues. Proc. Natl. Acad. Sci. USA. 2001;98:5596–5601. doi: 10.1073/pnas.101542098. [DOI] [PMC free article] [PubMed] [Google Scholar]
- 3.Yang S., Levine H., Onuchic J.N., Cox D.L. Structure of infectious prions: stabilization by domain swapping. FASEB J. 2005;19:1778–1782. doi: 10.1096/fj.05-4067hyp. [DOI] [PubMed] [Google Scholar]
- 4.Bennett M.J., Choe S., Eisenberg D. Domain swapping: entangling alliances between proteins. Proc. Natl. Acad. Sci. USA. 1994;91:3127–3131. doi: 10.1073/pnas.91.8.3127. [DOI] [PMC free article] [PubMed] [Google Scholar]
- 5.Kozlov M.M., Bershadsky A.D. Processive capping by formin suggests a force-driven mechanism of actin polymerization. J. Cell Biol. 2004;167:1011–1017. doi: 10.1083/jcb.200410017. [DOI] [PMC free article] [PubMed] [Google Scholar]
- 6.Choi B., Zocchi G., Wu Y., Chan S., Perry L.J. Allosteric control through mechanical tension. Phys. Rev. Lett. 2005;95:078102. doi: 10.1103/PhysRevLett.95.078102. [DOI] [PubMed] [Google Scholar]
- 7.Saghatelian A., Guckian K.M., Thayer D.A., Ghadiri M.R. DNA detection and signal amplification via an engineered allosteric enzyme. J. Am. Chem. Soc. 2003;125:344–345. doi: 10.1021/ja027885u. [DOI] [PMC free article] [PubMed] [Google Scholar]
- 8.Choi B., Zocchi G., Canale S., Wu Y., Chan S. Artificial allosteric control of maltose binding protein. Phys. Rev. Lett. 2005;94:038103. doi: 10.1103/PhysRevLett.94.038103. [DOI] [PubMed] [Google Scholar]
- 9.Choi B., Zocchi G. Guanylate kinase, induced fit, and the allosteric spring probe. Biophys. J. 2007;92:1651–1658. doi: 10.1529/biophysj.106.092866. [DOI] [PMC free article] [PubMed] [Google Scholar]
- 10.Choi B., Zocchi G. Mimicking cAMP-dependent allosteric control of protein kinase A through mechanical tension. J. Am. Chem. Soc. 2006;128:8541–8548. doi: 10.1021/ja060903d. [DOI] [PubMed] [Google Scholar]
- 11.Miduturu C.V., Silverman S.K. DNA constraints allow rational control of macromolecular conformation. J. Am. Chem. Soc. 2005;127:10144–10145. doi: 10.1021/ja051950t. [DOI] [PubMed] [Google Scholar]
- 12.Zelin E., Silverman S.K. Allosteric control of ribozyme catalysis by using DNA constraints. Chem. Bio. Chem. 2007;8:1907–1911. doi: 10.1002/cbic.200700437. [DOI] [PubMed] [Google Scholar]
- 13.Reynaldo L.P., Vologodskii A.V., Neri B.P., Lyamichev V.I. The kinetics of oligonucleotide replacements. J. Mol. Biol. 2000;297:511–520. doi: 10.1006/jmbi.2000.3573. [DOI] [PubMed] [Google Scholar]
- 14.Williams A.P., Longfellow C.E., Freier S.M., Kierzek R., Turner D.H. Laser temperature-jump, spectroscopic, and thermodynamic study of salt effects on duplex formation by dGCATGC. Biochemistry. 1989;28:4283–4291. doi: 10.1021/bi00436a025. [DOI] [PubMed] [Google Scholar]
- 15.Abramoff M.D., Magelhaes P.J., Ram S.J. Image processing with ImageJ. Biophotonics Int. 2004;11:36–42. [Google Scholar]
- 16.Protozanova E., Yakovchuk P., Frank-Kamenetskii M.D. Stacked-unstacked equilibrium at the nick site of DNA. J. Mol. Biol. 2004;342:775–785. doi: 10.1016/j.jmb.2004.07.075. [DOI] [PubMed] [Google Scholar]
- 17.Lane M.J., Paner T., Kashin I., Faldasz B.D., Li B. The thermodynamic advantage of DNA oligonucleotide “stacking hybridization” reactions: energetics of a DNA nick. Nucleic Acids Res. 1997;25:611–616. doi: 10.1093/nar/25.3.611. [DOI] [PMC free article] [PubMed] [Google Scholar]
- 18.Zhang Y., Crothers D.M. Statistical mechanics of sequence-dependent circular DNA and its application for DNA cyclization. Biophys. J. 2003;84:136–153. doi: 10.1016/S0006-3495(03)74838-3. [DOI] [PMC free article] [PubMed] [Google Scholar]
- 19.Doi M., Edwards S. 1st Ed. Oxford University; New York: 1985. Theory of Polymer Dynamics. [Google Scholar]
- 20.Bustamante C., Marko J.F., Siggia E.D., Smith S. Entropic elasticity of λ-phage DNA. Science. 1994;265:1599–1600. doi: 10.1126/science.8079175. [DOI] [PubMed] [Google Scholar]
- 21.Yan J., Marko J.F. Localized single-stranded bubble mechanism for cyclization of short double helix DNA. Phys. Rev. Lett. 2004;93:108108. doi: 10.1103/PhysRevLett.93.108108. [DOI] [PubMed] [Google Scholar]
- 22.Cloutier T.E., Widom J. Spontaneous sharp bending of double-stranded DNA. Mol. Cell. 2004;14:355–362. doi: 10.1016/s1097-2765(04)00210-2. [DOI] [PubMed] [Google Scholar]