Abstract
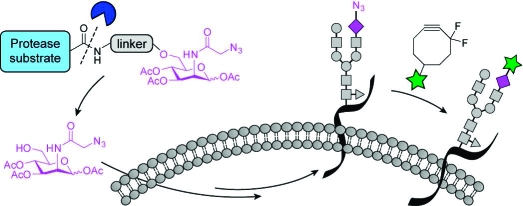
Glycans can be imaged by metabolic labeling with azidosugars followed by chemical reaction with imaging probes; however, tissue-specific labeling is difficult to achieve. Here we describe a strategy for the use of a caged metabolic precursor that is activated for cellular metabolism by enzymatic cleavage. An N-azidoacetylmannosamine derivative caged with a peptide substrate for the prostate-specific antigen (PSA) protease was converted to cell-surface azido sialic acids in a PSA-dependent manner. The approach has applications in tissue-selective imaging of glycans for clinical and basic research purposes.
A fundamental challenge in molecular imaging is the design of reagents that report on cell- or tissue-specific molecular processes. A popular approach to achieving such selectivity is the design of caged probes that are activated by enzymes produced by the target cells, a prototypical example being cancer-associated proteases.(1) Alternatively, probes can be conjugated to targeting elements that bind, noncovalently or covalently, to cell-surface markers.(2) We have been exploring this latter approach in the context of imaging cell-surface glycans. These biopolymers, collectively termed the glycome, change in structure and expression during development and cancer progression as well as many other physiological processes.(3) We previously reported that broad sectors of the glycome can be imaged in model organisms using a two-step procedure: (1) metabolic labeling of the glycans with azidosugar precursors and (2) chemical reaction of azide-labeled cell-surface glycans in vivo via Cu-free click chemistry with difluorinated cyclooctyne (DIFO) probes.(4)
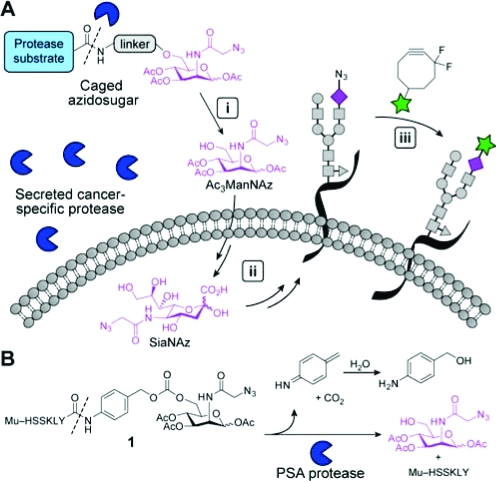
The tissue selectivity of this approach is limited by the breadth of glycans targeted by a single metabolic precursor. For example, treatment of mice with peracetylated N-azidoacetylmannosamine (Ac4ManNAz) leads to widespread labeling of glycans with N-azidoacetyl sialic acid (SiaNAz) in numerous tissues (e.g., liver, heart, kidney, and intestines) as well as serum glycoproteins.(5) The broad distribution of the azidosugar can undermine experiments that seek to probe glycomic changes in a single organ as a function of time or disease. One means to achieve tissue selectivity in glycan imaging is to restrict azidosugar metabolism to the cells of interest. Tissue-specific enzyme activities such as those mentioned above might be exploited to achieve this goal. Here, we describe a strategy for cell-selective glycan imaging using a caged metabolic precursor that is activated by a protease (Figure 1A).
Figure 1.
Strategy for tissue-specific release of Ac3ManNAz via enzymatic activation. (A) (i) A nonmetabolizable caged azidosugar serves as a substrate for a secreted, cancer-specific protease, releasing Ac3ManNAz. (ii) This azidosugar is then metabolized by the cell and incorporated into cell-surface glycans. (iii) The azide-labeled glycans are detected via Cu-free click chemistry using DIFO reagents. (B) Caged azidosugar used in this study (1). Cleavage of the indicated bond (dashed line) by the prostate-specific antigen (PSA) protease results in the release of a linker, the peptide, and Ac3ManNAz.
We synthesized a variant of Ac4ManNAz in which the 6-hydroxy group was conjugated through a self-immolating linker to a peptide substrate for the prostate-specific antigen (PSA) protease (1, Figure 1B). PSA is a serine protease that is secreted at low levels by normal prostatic glandular cells but is highly upregulated by prostate cancer cells.(6) The enzyme has been widely targeted with caged drugs and imaging reagents in cell culture and in animal models.(6) The hexapeptide Mu-HSSKLY (Mu = morpholino ureidyl) was chosen as a PSA substrate based on reports of its high selectivity for this enzyme over other ubiquitous serine proteases.6c,7 Upon cleavage of the peptide, the p-aminobenzyl alcohol (PABA) linker in 1 spontaneously fragments to release 1,3,4-tri-O-acetyl-N-azidoacetylmannosamine (Ac3ManNAz), carbon dioxide, and an iminoquinone methide intermediate that is subsequently quenched by water (Figure 1B).(8) This process is known to occur rapidly and should therefore limit the diffusion of the released metabolic substrate from its target cell (for discussion see Figure S1 legend). Compound 1 was synthesized as a mixture of sugar anomers analogously to the route developed by Jones et al. (Scheme S1).(6c) Given the importance of hydroxy group acylation for the cellular uptake of Ac4ManNAz,(9) we verified that Chinese hamster ovary (CHO) and prostate cancer (PC-3) cells incubated with Ac3ManNAz could produce SiaNAz residues in their cell-surface glycans (Figure S1).
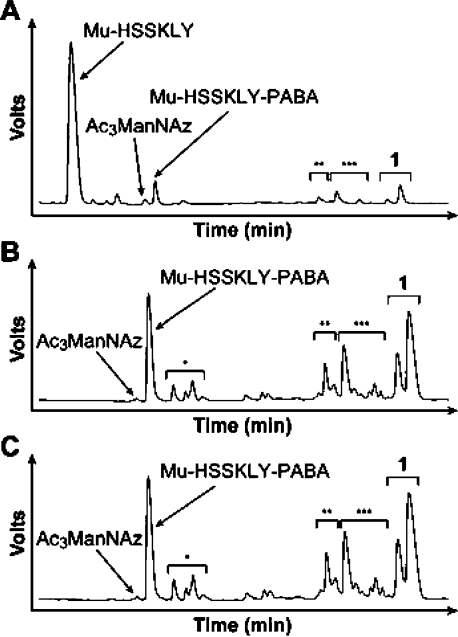
To confirm that 1 can serve as a substrate for PSA, the compound was incubated in vitro with active enzyme or, as negative controls, buffer only or heat-killed (HK) PSA. These enzymatic reactions were analyzed by reversed-phase HPLC and mass spectrometry. Incubation of 1 with PSA resulted in the release of Mu-HSSKLY as the major peptide product, along with Ac3ManNAz (Figure 2A). Minor products were also observed. These included Mu-HSSKLY-PABA, presumably produced by nonenzymatic carbonate hydrolysis, as well as monodeacetylated 1 and products formed by migration of acetyl groups within 1. Control reactions lacking PSA (Figure 2B) or with HK PSA (Figure 2C) produced only nonenzymatic hydrolysis and acetyl migration products.
Figure 2.
Compound 1 is a substrate for PSA in vitro. Shown are HPLC traces of in vitro 6 h enzymatic reactions of 1 (500 μM) in 50 mM Tris, 0.1 M NaCl, pH 7.8, with (A) active PSA (50 μg/mL), (B) buffer only, or (C) HK PSA (50 μg/mL). The identities of the various species based on mass spectrometry are indicated on the traces. *Monoacetylated Mu-HSSKLY-PABA, **Monodeacetylated 1, and ***Isomers of 1.
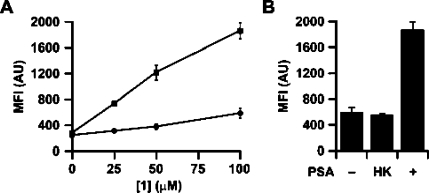
We next tested the performance of 1 as a caged substrate for metabolic glycan labeling. CHO cells were incubated with 1 at various concentrations (0−100 μM) in the presence of PSA, no enzyme, or HK PSA for 12 h at 37 °C. The cells were then washed and labeled with a DIFO−biotin conjugate,(4b) incubated with fluorescein isothiocyanate-labeled avidin (FITC-avidin), and analyzed by flow cytometry. We observed labeling that was both PSA- and substrate concentration-dependent, suggesting that the signal is due to enzymatic activation of 1 (Figure 3A). In a separate experiment, we demonstrated that the labeling intensity correlates with PSA concentration (Figure S2). Additionally, we verified that treatment of PC-3 cells with 1 resulted in PSA-dependent metabolic labeling (Figure S3). In the absence of PSA or with HK PSA, both CHO and PC-3 cells exhibited modest background labeling that likely reflects low levels of Ac3ManNAz produced by nonenzymatic carbonate hydrolysis (Figures 3B and S3). Importantly, we verified that 1 did not cause any cytotoxicity by incubating CHO cells labeled as above with phycoerythrin-conjugated annexin V, a marker of apoptosis (Figure S4).
Figure 3.
Cell-selective metabolic labeling of glycans using 1 and PSA. Flow cytometry analysis of CHO cells treated with (A) various concentrations of 1 (0−100 μM) and PSA (50 μg/mL, squares) or buffer only (circles) or (B) 1 (100 μM) and either buffer only (−), HK PSA (50 μg/mL, HK), or PSA (50 μg/mL, +). Cells were then labeled with DIFO−biotin (100 μM) and FITC-avidin. Error bars represent the standard deviation from the mean of three replicate samples. MFI = mean fluorescence intensity in arbitrary units (AU).
Finally, we tested 1 as an enzyme-activatable metabolic substrate for glycan imaging. CHO cells were incubated with 1 in the presence of PSA or HK PSA for 12 h at 37 °C. The cells were then washed and labeled with DIFO−biotin, followed by quantum-dot-conjugated streptavidin. We observed substantial cell-surface labeling of cells treated with 1 and PSA (Figure 4A) and minimal fluorescence on cells treated with 1 and HK PSA (Figure 4B).
Figure 4.
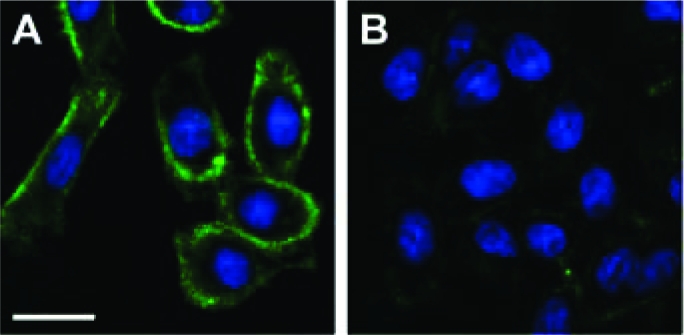
Selective imaging of cells using 1 in the presence of PSA. Fluorescence microscopy analysis of CHO cells treated with 1 (100 μM) and (A) PSA (50 μg/mL) or (B) HK PSA (50 μg/mL), followed by DIFO−biotin (100 μM) and a quantum dot 605−streptavidin conjugate. Green = Texas Red channel; Blue = DAPI channel. Scale bar = 20 μm.
In conclusion, we have developed a strategy for targeted metabolism of azidosugars using an enzymatically activated substrate. While we chose PSA to demonstrate proof-of-concept, it should be noted that the concentrations of PSA employed in our studies are physiologically relevant; i.e., they are similar to the levels of PSA secreted by both prostate cancer xenografts in mice and prostate tumor tissue obtained from human patients.(10) In addition, many cancers, including prostate cancer, are known to express elevated levels of sialic acid compared to surrounding tissue.(11) Thus, clinical imaging applications may be worth pursuing. More generally, however, the approach has promise for use in tissue-specific glycan imaging, a major future direction.
Acknowledgments
This work was supported by NIH Grant GM058867. We thank A. Lo for technical assistance and J. Baskin for critical reading of the manuscript. P.V.C. and D.H.D. were supported by NSF predoctoral fellowships. P.V.C. was also supported by an ACS Division of Medicinal Chemistry predoctoral fellowship. E.M.S. was supported by an ACS Division of Organic Chemistry predoctoral fellowship.
Supporting Information Available
Synthetic procedures and additional data. This material is available free of charge via the Internet at http://pubs.acs.org.
Funding Statement
National Institutes of Health, United States
Supplementary Material
References
- a Blum G.; von Degenfeld G.; Merchant M. J.; Blau H. M.; Bogyo M. Nat. Chem. Biol. 2007, 3, 668–677. [DOI] [PubMed] [Google Scholar]; b Jiang T.; Olson E. S.; Nguyen Q. T.; Roy M.; Jennings P. A.; Tsien R. Y. Proc. Natl. Acad. Sci. U.S.A. 2004, 101, 17867–17872. [DOI] [PMC free article] [PubMed] [Google Scholar]; c Weissleder R.; Tung C. H.; Mahmood U.; Bogdanov A. Jr. Nat. Biotechnol. 1999, 17, 375–378. [DOI] [PubMed] [Google Scholar]
- Massoud T. F.; Gambhir S. S. Genes Dev. 2003, 17, 545–580. [DOI] [PubMed] [Google Scholar]
- Varki A.; Cummings R. D.; Esko J. D.; Freeze H. H.; Stanley P.; Bertozzi C. R.; Hart G. W.; Etzler M. E.. Essentials of Glycobiology, 2nd ed.; Cold Spring Harbor Laboratory Press: New York, 2008. [PubMed] [Google Scholar]
- a Sletten E. M.; Bertozzi C. R. Angew. Chem., Int. Ed. 2009, 48, 6974–6998. [DOI] [PMC free article] [PubMed] [Google Scholar]; b Baskin J. M.; Prescher J. A.; Laughlin S. T.; Agard N. J.; Chang P. V.; Miller I. A.; Lo A.; Codelli J. A.; Bertozzi C. R. Proc. Natl. Acad. Sci. U.S.A. 2007, 104, 16793–16797. [DOI] [PMC free article] [PubMed] [Google Scholar]
- a Chang P. V.; Prescher J. A.; Sletten E. M.; Baskin J. M.; Miller I. A.; Agard N. J.; Lo A.; Bertozzi C. R. Proc. Natl. Acad. Sci. U.S.A. 2010, 107, 1821–1826. [DOI] [PMC free article] [PubMed] [Google Scholar]; b Prescher J. A.; Dube D. H.; Bertozzi C. R. Nature 2004, 430, 873–877. [DOI] [PubMed] [Google Scholar]
- a Denmeade S. R.; Nagy A.; Gao J.; Lilja H.; Schally A. V.; Isaacs J. T. Cancer Res. 1998, 58, 2537–2540. [PubMed] [Google Scholar]; b Khan S. R.; Denmeade S. R. Prostate 2000, 45, 80–83. [DOI] [PubMed] [Google Scholar]; c Jones G. B.; Crasto C. F.; Mathews J. E.; Xie L.; Mitchell M. O.; El-Shafey A.; D’Amico A. V.; Bubley G. J. Bioorg. Med. Chem. 2006, 14, 418–425. [DOI] [PubMed] [Google Scholar]
- Denmeade S. R.; Lou W.; Lovgren J.; Malm J.; Lilja H.; Isaacs J. T. Cancer Res. 1997, 57, 4924–4930. [PMC free article] [PubMed] [Google Scholar]
- de Groot F. M.; Damen E. W.; Scheeren H. W. Curr. Med. Chem. 2001, 8, 1093–1122. [DOI] [PubMed] [Google Scholar]
- Jacobs C. L.; Yarema K. J.; Mahal L. K.; Nauman D. A.; Charters N. W.; Bertozzi C. R. Methods Enzymol. 2000, 327, 260–275. [DOI] [PubMed] [Google Scholar]
- Denmeade S. R.; Sokoll L. J.; Chan D. W.; Khan S. R.; Isaacs J. T. Prostate 2001, 48, 1–6. [DOI] [PubMed] [Google Scholar]
- a Zhang S.; Cordon-Cardo C.; Zhang H. S.; Reuter V. E.; Adluri S.; Hamilton W. B.; Lloyd K. O.; Livingston P. O. Int. J. Cancer 1997, 73, 42–49. [DOI] [PubMed] [Google Scholar]; b Zhang S.; Zhang H. S.; Cordon-Cardo C.; Reuter V. E.; Singhal A. K.; Lloyd K. O.; Livingston P. O. Int. J. Cancer 1997, 73, 50–56. [DOI] [PubMed] [Google Scholar]
Associated Data
This section collects any data citations, data availability statements, or supplementary materials included in this article.


