Abstract
Conventional spatial-spectral RF pulses excite the water or the fat spins in a whole slice or slab. While such pulses prove useful in a number of applications, their applicability is severely limited in sequences with short TR, due to the relatively long duration of the pulses. In the present work, we demonstrate that, by manipulating the parameters of a 2DRF pulse designed to excite a 2D spatial profile, the chemical-shift sensitivity of the pulse can be exploited to obtain potentially useful spatially varying fat-water excitation patterns.
Keywords: 2DRF pulse, fat–water imaging, fast imaging, reduced FOV imaging
INTRODUCTION
Reliable and accurate water-fat imaging is essential to many clinical MR applications, to prevent fat signals from obscuring features of interest (e.g., in musculoskeletal imaging and breast imaging) or to help detect disease-related fat infiltrations into normally fat-free tissues (e.g., arrythmogenic right ventricular dysplasia). Many techniques have been proposed for fat and water imaging, including spectral selective saturation (1), short tau inversion recovery (STIR) (2), the Dixon method (3–4) and other methods derived from it (5–6), as well as the use of spatial-spectral (SPSP) pulses (7). SPSP pulses tend to offer interesting advantages over other techniques, especially in situations where imaging speed is important. For example, unlike the Dixon method and related approaches, it does not require more than one image. Compared to STIR and selective saturation methods, SPSP pulses tend to be less sensitive to B1 inhomogeneities and to avoid SNR penalties associated with inversion pulses.
As a major disadvantage, SPSP excitation pulses tend to be relatively long and complicated, limiting their applicability when using very short TR sequences such as fast gradient echo (FGRE) and balanced steady-state free precession (b-ssfp). In addition, SPSP pulses are also vulnerable to B0 inhomogeneities and susceptibilities.
In this work we investigate the use of 2DRF pulses for fat-water imaging. In a typical spatially selective 2DRF pulse, the goal is to excite a 2D profile that is the same for all resonant frequencies. In practice, however, the fat excitation profile may experience a significant spatial shift with respect to the profile for water. This feature can be exploited by adjusting pulse parameters to move either fat or water out of the FOV, while keeping the other spin species within the FOV (8). In the present study, we extend this idea and demonstrate that a spatially varying fat-water excitation can be achieved in a fractional FOV by employing a shorter 2DRF pulse than would otherwise be used for full-FOV fat-water excitation. We have successfully implemented and tested the proposed pulses during in vivo scans, at 3T.
THEORY
2DRF Pulses
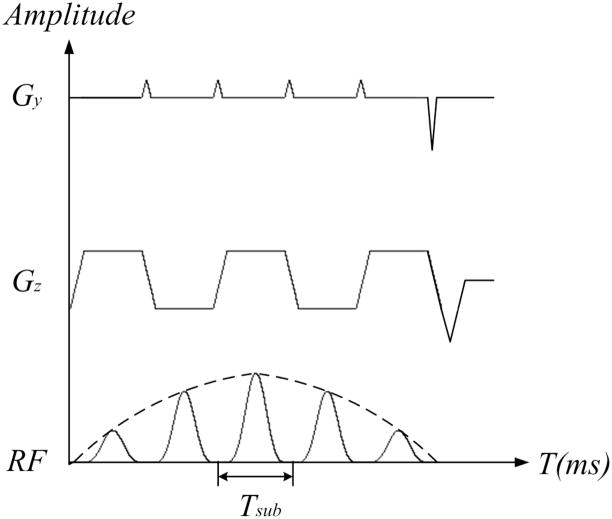
As depicted in Fig. 1, a 2DRF pulse typically consists of a string of sub-pulses. The presence of blip gradients in the PE direction, inserted between sub-pulses, is generally an indication that the pulse is meant to be selective along two spatial dimensions, i.e., a 2D spatial-spatial RF pulse as opposed to a 2D spatial-spectral RF pulse.
Fig. 1.
An echo-planar type 2DRF pulse. The amplitude of the sub-pulses is modulated by a Hamming-windowed SINC-type envelope, and the sub-pulses are played out during both positive and negative z gradients. Blip gradients are played out along the y direction at the end of each sub-pulse.
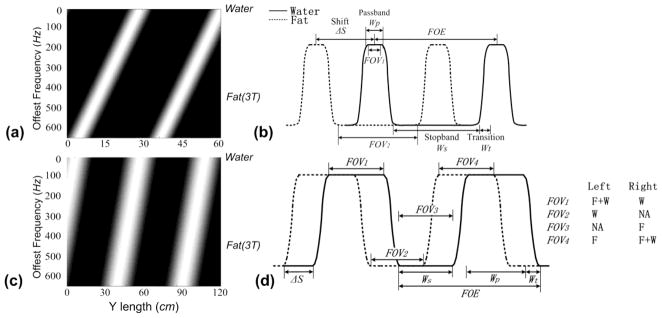
Through applying the Nyquist theorem to an analysis in excitation k-space (9), it can be seen that the 2DRF excitation profile is replicated periodically along the PE direction (y). The excitation profile width and the distance between two neighboring excitation profiles are referred to here as the passband width (Wp) and field of excitation (FOE), respectively. The unexcited region between two neighboring excitation profiles is referred to as the stopband width (Ws). The transition width (Wt) is defined as the region in which the magnetization magnitude is between passband and stopband (e.g., between 10% and 90% of the maximum amplitude). The FOE and passband width can be expressed as:
| [1] |
| [2] |
where ablip is the area of the blip gradient along PE, n is the number of sub-pulses and TBW is the time-bandwidth product of the modulation envelop waveform. Note that ΔKy is the distance between Ky lines in excitation k-space and is equal to ablip.
The spatial shift ΔS of fat along the PE can be expressed as:
| [3] |
where Δf is the frequency offset for fat and Tsub represents the sub-pulse duration.
Spatially Varying Fat-Water Excitation
The basic idea behind the use of 2D spatial-spatial RF pulses for fat-water imaging is to exploit the strong chemical-shift sensitivity of 2DRF in the PE direction as shown in Eq. [3]. A difference in frequency f leads to a difference in location r as follows:
| [4] |
where f0 is the center frequency and r0 is the central position in the FOV. As seen in Eq. [4], uniform water-only or fat-only excitations are obtained when gradient blips have vanishingly small amplitudes, as in regular SPSP pulses where ablip =0. Using appropriate values for ablip, spatially-varying excitations with diverse fat-water contrasts can be obtained, as described below.
The images in Fig. 2a and 2c show the simulated resonant frequency dependence of a 2DRF pulse profile in the PE direction. The bright and dark bands in Fig. 2a and 2c represent the locations where the magnetization is excited (bright areas) or left untouched (dark areas) by a 2DRF pulse. The slope of the bright bands is inversely proportional to Tsub as given by Eq. [4]. Note that, the shorter the sub-pulse duration, the more vertical are these bands (see Fig. 2c). The distance between consecutive bands (the FOE) is determined by the size of the gradient blips. For example, to achieve the ratio of stop band to passband depicted in Fig. 2a would require more sub-pulses that would be needed for a pulse represented by Fig. 2c. Note that the zero location along the frequency axis (Δf) in Fig. 2a and 2c represents the water signal (assuming it is on-resonance), and the 440 Hz location represents fat signal at 3T. The 1D representations in Fig. 2b and 2d illustrate the spatial shift patterns of fat (dotted line) from water (full line) for two cases: (a) fully separated water and fat passband and (b) partially overlapping water and fat passband allowing spatially varying water fat excitation.
Fig. 2.
(a) The spatial shift of the spin excitation profiles along the phase encoding direction (along the horizontal) as it varies with the amount of off-resonance (along the vertical) for a 2DRF pulse; (b) A 1D idealized plot of the separation of fat and water excitation profiles which enable both reduced FOV imaging and fat suppression as with the π method; (c) The spatial shift of the spin excitation profiles as in (a) for a 2DRF pulse for spatially varying fat-water excitation; (d) A 1D idealized plot of the separation of fat and water excitation with a 2DRF pulse as in (c) that gives the potential for variable fat-water distributions within the FOV as, for example, can be achieved within FOV1-FOV4. Ws: the stopband width, Wt: the transition width, Wp: the passband width, FOE: the field of excitation, and ΔS: the spatial shift.
(a) Spatially uniform fat-water excitation with reduced-FOV capability
As shown in Fig. 2b, the fat profile is shifted by ΔS > Wp + 2Wt so that the passbands for fat and water do not overlap. It is also required that Ws ≥ Wp + 2Wt. Assuming that water is on resonance, only the water within FOV1 will be excited, as long as the object has a size (So) smaller than Wp. However, if So is larger than Wp, parts of the object should appear dark as neither fat nor water are excited within the Ws, as shown in FOV2. Accordingly, the size of the imaging FOV can be reduced (reduced-FOV, rFOV) to shorten the scan time.
In the special case where the fat profile shift ΔS = 0.5FOE, a maximum acceleration factor of Ws/(Wp+2Wt) can be achieved. The so-called π method in (10) corresponds to this case. A drawback of the π method is the need for a fixed sub-pulse duration and sufficient sub-pulse numbers. By combining Eq. [2] and Eq. [3], it is derived that the sub-pulse duration is 1/(2Δf) = 1/(2× 440) = 1.136 ms at 3T for the π method.
The acceleration factor for rFOV imaging can be estimated using Eq. [1] and Eq. [2]:
| [5] |
To obtain RrFOV = 2 using an envelope of TBW=2, the ratio of FOE/(Wp+2Wt) ≥ 3 is required, which indicates a at least 9 sub-pulse 2DRF pulse with the total duration of 9 × 1.136=10.224ms .
To suppress water instead of fat, the fat profile can be shifted to the center of the FOV by either adjusting the central frequency so that fat is on resonance, or by applying linear phase variations to the 2DRF sub-pulses.
(b) Spatially varying fat-water excitation with some reduced-FOV capability
An alternative to spatially varying water fat imaging is shown in Fig. 2d. The fat profile is shifted by ΔS<0.5Wp+Wt, allowing fat-water excitation profiles to vary across the object in the imaged FOV. In the example shown in Fig. 2d, the fat excitation profile is shifted by 0.5Wp. With water on resonance and the object about the size of FOV1 (S0 = FOV1), the left half of the image would feature both fat and water signals, while the right half would be water-only. If the object is at the location indicated by FOV2 in Fig. 2c, the left half of the image would become water-only and neither water nor fat would be excited in the right half. Similarly, an image with an unexcited left half and a fat-only right half would be obtained within FOV3. By setting fat on resonance instead, we would transform the image into one with a fat-only in left half and both water and fat signal in the right half within FOV4. For an object located at FOV2 or FOV3, a single-side rFOV could be applied to reduce the scan time.
It should be noted that, as shown in Fig. 2b, the signal can be suppressed on both sides of the selected excitation region using the π method. However, some flexibility is sacrificed when using the spatially varying fat-water excitation because only single-sided signal suppression can be realized such as depicted by FOV2 and FOV3 in Fig. 2d. A further limitation is that, for a very short pulse, the transition width will be much larger than shown in Fig. 2d and there will be areas of the image where fat and/or water are not perfectly suppressed. Nevertheless, as will be demonstrated, it is possible to obtain approximate suppression of fat throughout the FOV and suppression of water in part of the FOV to enable reduced FOV imaging with fat suppression. Note that, for added flexibility, the passband width does not necessarily have to be equal to the stopband width, and the fat profile shift does not necessarily have to be half passband width as depicted in Fig. 2d. A great variety of fat and water distributions can be created by manipulating the blip gradient area, the number of sub-pulses, their relative phase and the total duration of the 2DRF pulse.
METHODS
Using a 2DRF software library developed as part of the National Center for Image-Guided Therapy (www.ncigt.org), 2DRF pulses were implemented on a 3T GE Signa MRI scanner (General Electric Healthcare, Milwaukee, WI) with echo-speed gradient set (40 mT/m maximum gradient strength and a maximum slew rate of 150 T/m/s). The 2DRF library enables the flexible design of echo planar 2DRF pulses through simple changes to parameters such as the sub-pulse duration, the number of sub-pulses, or the number of cycles for the SINC modulation envelope.
In order reduce TE and TR for fast imaging, a bi-polar 2DRF pulse was used, in which sub-pulses were played out during both positive and negative Gz gradients. The RF excitation was performed both during the ramps and the plateaus of the gradient waveform based on the algorithm in (11).
Both phantom and human in vivo validations were performed. Phantoms consisting of vegetable oil and water were scanned using a single-channel head coil and a b-ssfp sequence (TE=3 ms, TR=6 ms, flip angle=45°, FOV=20 cm, matrix size=128 × 128, slice thickness=8 mm). In vivo scans were performed with an 8-channel cardiac array coil; informed consent was obtained using a protocol approved at our institution. Abdominal images were acquired with a fast gradient echo sequence (FGRE): TE=8ms, TR=14ms, flip angle=45°, FOV=34cm, matrix size=256×256, slice thickness=8mm. For spatially-variable fat-water excitations, the FOE was set to 68 cm, the FOV to 34 cm, and a 5 × 560μs 2DRF pulse with envelope TBW of 2 was used. For full FOV fat-water excitation, a 5 × 720μs traditional SPSP pulse with envelope TBW of 2 was used instead.
RESULTS
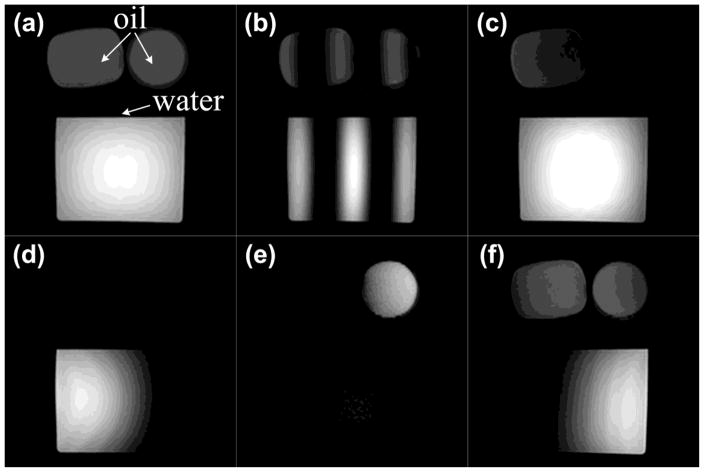
Figure 3 shows results from a phantom consisting of vegetable oil and water. Figure 3a is the reference image produced by the original SINC-shaped RF pulse. Figures 3b–3f show results using a 5 × 560 μs 2DRF pulse with FOE=2 × FOV, except for Fig. 3b where FOE=0.25 × FOV. In Fig. 3c, the left half image features both fat and water signal while the right half is water-only (as for FOV1 in Fig. 2c). Figures 3d–3f show different spatially-varying fat-water excitation schemes, obtained by adjusting the shift factor Rshift (ΔS/FOE) from 0 to a value of 0.25, 0.5 and 0.75 (as for, respectively, FOV2, FOV3, and FOV4 in Fig. 2d).
Fig. 3.
Spatially varying fat-water separation by 2DRF is demonstrated in b-ssfp phantom images at 3T (TE=3ms, TR=6ms, flip angle=45°, FOV=20cm, matrix size=128×128, slice thickness=8mm). (a) A reference image produced by the product sequence using a 1D SINC pulse; (b) The spatial shift of excitation patterns in vegetable oil from water can readily be observed with FOE=0.25FOV; (c) the spatially varying fat-water excitation with the shift factor Rshift=0, (d) the excitation with Rshift=0.25, (e) the excitation with Rshift=0.5 and (f) the excitation with Rshift=0.75 are shown. Fig. (c–f) were produced using a 5×560μs 2DRF pulse and FOE=2FOV, corresponding to the scenarios described with FOV1 to FOV4 in Fig. 2d.
Figure 4 shows full FOV fat-water excitation results obtained in a healthy human volunteer. Figure 4a is the reference image produced by the original SINC-shaped RF pulse. Figures 4b and 4c are water-only and fat-only images, both obtained with a 5 × 720 μs SPSP pulse. Figure 5 presents spatially-varying fat-water excitation results, acquired from the same physical slice as in Fig. 4, using a shorter 5 × 560 μs 2DRF pulse with FOE=2×FOV. Different fat-water spatial distributions are achieved by changing the shift factor Rshift from 0 to 0.25, 0.5 and 0.75 (as for, respectively, FOV2, FOV3, and FOV4 in Fig. 2d). The human results in Fig. 5a–d have similar contrast and can be compared to the phantom results in Fig. 3c–f, respectively.
Fig. 4.
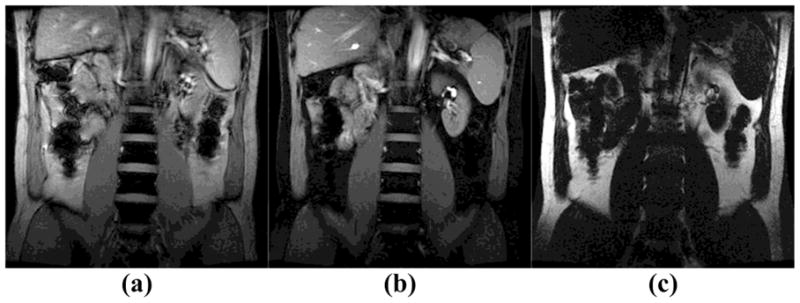
Full FOV fat-water separation was performed on a healthy volunteer at 3T (TE=8ms, TR=14ms, flip angle=45°, FOV=34cm, matrix size=256 × 256, slice thickness=8mm). (a) Reference image produced by the original SINC pulse in the product FGRE sequence; (b) A water-only image was obtained by a 5 × 720 μs SPSP pulse; (c) A fat-only image was obtained by the same SPSP pulse;
Fig. 5.
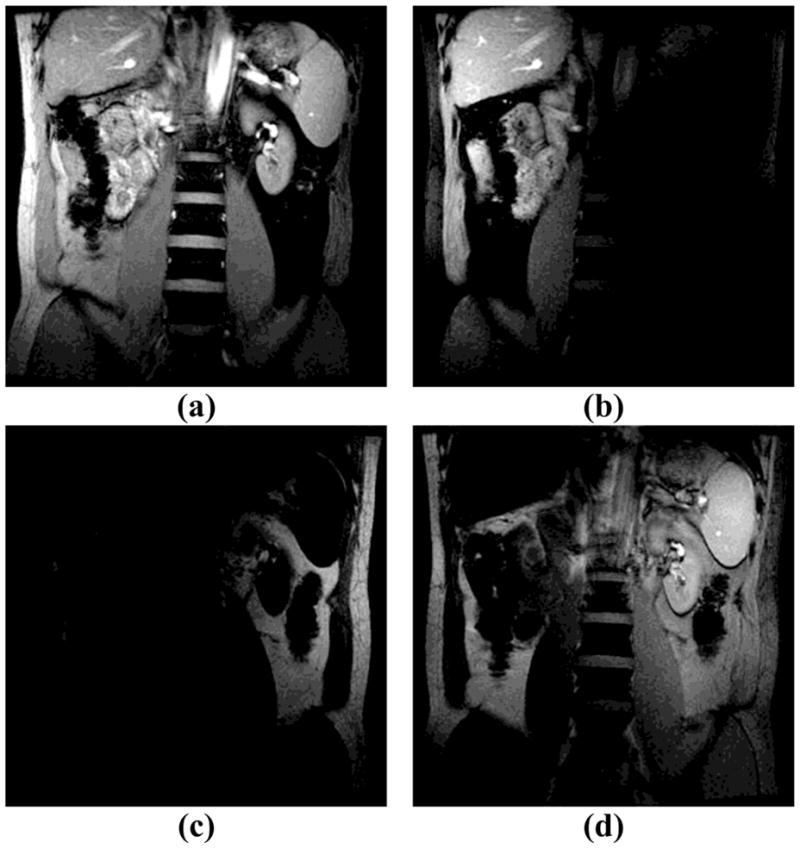
Spatially varying fat-water separation was performed on a healthy volunteer at 3T (TE=8ms, TR=14ms, flip angle=45°, FOV=34cm, matrix size=256×256, slice thickness=8mm). The spatially-varying contrast was adjusted as follows: (a) left: fat+water, right: water-only (Rshift=0); (b) left: water-only, right: no excitation (Rshift =0.25); (c) left: no excitation, right: fat-only (Rshift =0.5); (d) left: fat-only, right: fat+water (Rshift =0.75); Fig. (a–d) were all obtained using a 5×560μs 2DRF pulse and FOE=2 × FOV. The four different contrasts obtained were analogous to those described with FOV1 to FOV4 in Fig. 2d.
DISCUSSION
In the work reported here, our 2DRF pulse acts as a spatial filter for fat-water imaging, as opposed to SPSP pulses that are solely spectral filters. The spectral responses of 2DRF pulses for different species of spins lead to different shifts in the spatial excitation profiles depending on their resonant frequencies, as shown in Eq. [4].
As with regular SPSP pulses, the 2DRF pulses used here are sensitive to B0 inhomogeneity and susceptibility. The spatial varying selectivity of the 2DRF excitation applies at all off-resonances. Thus, a B0 inhomogeneity caused by susceptibility interfaces can also result in a significant shift of the excitation, depending on the FOE and the sub-pulse duration. For example, a 1.5 ppm field inhomogeneity at 3T (Δf=191.6Hz) would be equivalent to a 7.3 cm shift of the excitation band for a 5*560μs pulse and a 68cm FOE as used for Fig. 5. Therefore, good shimming is important to reduce B0 inhomogeneity and hence improve the performance for spatially varying fat-water imaging.
In theory, fat could be completely suppressed as long as the spatial shift of the fat profile is larger than the FOV if the transition width is zero. According to Eq. [3], it would seem as if this condition could be satisfied for an even shorter 2DRF. In practice however, a zero transition width cannot be achieved, as it would require an infinite TBW without truncation (12) and hence an infinite number of sub-pulses. For a finite RF pulse the transition width Wt is 1/T, where T is the overall duration of the RF pulse.
For spatial variable fat-water excitation, a flat passband and stopband, as well as a sharp transition are desired. Since the transition width is not negligible for a very short low TBW pulses (e.g. 2.8ms used in the experiments), the image intensity variation within the transition width along the PE would be noticeable, as shown in Fig. 3d and Fig. 3f. This intensity variation may be used for B1 inhomogeneity compensation, as has been proposed elsewhere (13). For the same reason, areas of the image where fat and/or water are perfectly suppressed could not be obtained in the case of a very short pulse. Nevertheless, it is possible, as demonstrated by Figs.3 and 5 to get approximate suppression of fat throughout the FOV and suppression of water in part of the FOV to enable reduced FOV imaging. In practice, a tradeoff has to be made between uniform fat-only or water-only contrast within a region, sharp transition bands, and shorter 2DRF pulse duration.
A limitation on RF pulse duration is the minimum slice thickness achievable. For example, in most sequences the minimum slice thickness is about 3 mm, which may limit the sub-pulse duration to over 1 ms due to longer ramp times for the slice selection gradient. In order to achieve the minimum possible slice thickness while also minimizing total RF pulse duration, the sub-pulses are played out during both the ramp and plateau of the slice selection gradient. For our MRI system, the minimum achievable sub-pulse duration was 416 μs for an 8 mm slice thickness, and 660 μs for a 3 mm slice thickness, with a maximum slew rate of 150 T/m/s (14).
The main message of the present work is that 2DRF pulse duration can be significantly reduced for spatially varying fat-water excitations, as compared with full FOV uniform fat-water separation. This may be advantageous for motion or scan-time sensitive applications in interventional MRI, especially for those applications where the ROI for fat-water separation is pre-defined, such as MR guided focused-ultrasound therapy (15). In such a case, the 2DRF can be dynamically generated for a specific location. In addition, fractional phase FOV and partial Fourier reconstruction can be applied to reduce the number of required ky lines and hence further reduce scan time, such as shown for FOV2 and FOV3 in Fig. 2c.
Acknowledgments
The authors are grateful to Dr. Yi Tang and Mr. Tzu-Cheng Chao for their help. This work is supported by NIH grant U41RR019703.
References
- 1.Haase A, Frahm J, Hanicke W, Matthaei D. 1H NMR chemical shift selective (CHESS) imaging. Phys Med Biol. 1985;30(4):341–4. doi: 10.1088/0031-9155/30/4/008. [DOI] [PubMed] [Google Scholar]
- 2.Fleckenstein JL, Archer BT, Barker BA, Vaughan JT, Parkey RW, Peshock RM. Fast short-tau inversion-recovery MR imaging. Radiology. 1991;179(2):499–504. doi: 10.1148/radiology.179.2.2014300. [DOI] [PubMed] [Google Scholar]
- 3.Dixon WT. Simple proton spectroscopic imaging. Radiology. 1984;153(1):189–94. doi: 10.1148/radiology.153.1.6089263. [DOI] [PubMed] [Google Scholar]
- 4.Glover GH, Schneider E. Three-point Dixon technique for true water/fat decomposition with B0 inhomogeneity correction. Magn Reson Med. 1991;18(2):371–83. doi: 10.1002/mrm.1910180211. [DOI] [PubMed] [Google Scholar]
- 5.Xiang QS, An L. Water-fat imaging with direct phase encoding. J Magn Reson Imaging. 1997;7(6):1002–15. doi: 10.1002/jmri.1880070612. [DOI] [PubMed] [Google Scholar]
- 6.Reeder SB, Wen Z, Yu H, Pineda AR, Gold GE, Markl M, et al. Multicoil Dixon chemical species separation with an iterative least-squares estimation method. Magn Reson Med. 2004;51(1):35–45. doi: 10.1002/mrm.10675. [DOI] [PubMed] [Google Scholar]
- 7.Meyer CH, Pauly JM, Macovski A, Nishimura DG. Simultaneous spatial and spectral selective excitation. Magn Reson Med. 1990;15(2):287–304. doi: 10.1002/mrm.1910150211. [DOI] [PubMed] [Google Scholar]
- 8.Yuan J, Madore B, Panych LP. Comparison of Fat-Water Separation by 2D RF Pulse and Dixon method in Balanced Steady-State Free Precession. Proceedings 16th Scientific Meeting, International Society for Magnetic Resonance in Medicine; 2008. p. 1388. [Google Scholar]
- 9.Pauly JND, Macovski A. A k-space analysis of small-tipangle excitation. J Magn Reson. 1989;81:43–56. [Google Scholar]
- 10.Sung K, Nayak KS. Reduced Field-of-View RF Pulse Designs with Fat-Suppression. Proceedings 14th Scientific Meeting, International Society for Magnetic Resonance in Medicine; 2006. p. 3010. [Google Scholar]
- 11.Hargreaves BA, Cunningham CH, Nishimura DG, Conolly SM. Variable-rate selective excitation for rapid MRI sequences. Magn Reson Med. 2004;52(3):590–7. doi: 10.1002/mrm.20168. [DOI] [PubMed] [Google Scholar]
- 12.Pauly J, Le Roux P, Nishimura D, Macovski A. Parameter relations for the Shinnar-Le Roux selective excitation pulse design algorithm [NMR imaging] IEEE Trans Med Imaging. 1991;10(1):53–65. doi: 10.1109/42.75611. [DOI] [PubMed] [Google Scholar]
- 13.Sung K, Nayak KS. B1+ compensation in 3T cardiac imaging using short 2DRF pulses. Magn Reson Med. 2008;59(3):441–6. doi: 10.1002/mrm.21443. [DOI] [PubMed] [Google Scholar]
- 14.Yuan J, Mei C-S, Panych LP. Ultra-short 2D RF pulse for reduced field-of-view SSFP imaging. Proceedings 16th Scientific Meeting, International Society for Magnetic Resonance in Medicine; 2008. p. 3137. [Google Scholar]
- 15.Mei C-S, Yuan J, McDannold N, Panych LP. Fast Temperature Measurement Using a 2DRF Pulse Enables Both Reduced-FOV Imaging and Fat Suppression. Proceedings 17th Scientific Meeting, International Society for Magnetic Resonance in Medicine; 2009. p. 4395. [Google Scholar]


