

Abstract
Hydrogels have been demonstrated to swell in response to a number of external stimuli including pH, CO2, glucose, and ionic strength making them useful for detection of metabolic analytes. To measure hydrogel swelling pressure, we have fabricated and tested novel perforated diaphragm piezoresistive pressure sensor arrays that couple the pressure sensing diaphragm with a perforated semi-permeable membrane. The 2×2 arrays measure approximately 3 × 5 mm2 and consist of four square sensing diaphragms with widths of 1.0, 1.25, and 1.5 mm used to measure full scale pressures of 50, 25, and 5 kPa, respectively. An optimized geometry of micro pores was etched in silicon diaphragm to allow analyte diffusion into the sensor cavity where the hydrogel material is located. The 14-step front side wafer process was carried out by a commercial foundry service (MSF, Frankfurt (Oder), Germany) and diaphragm pores were created using combination of potassium hydroxide (KOH) etching and deep reactive ion etching (DRIE).
Sensor characterization was performed (without the use of hydrogels) using a custom bulge testing apparatus that simultaneously measured deflection, pressure, and electrical output. Test results are used to quantify the sensor sensitivity and demonstrate proof-of-concept. Simulations showed that the sensitivity was slightly improved for the perforated diaphragm designs while empirical electrical characterization showed that the perforated diaphragm sensors were slightly less sensitive than solid diaphragm sensors. This discrepancy is believed to be due to the influence of compressive stress found within passivation layers and poor etching uniformity. The new perforated diaphragm sensors were fully functional with sensitivities ranging from 23 to 252 μV/V-kPa (FSO= 5 to 80mV), and show a higher nonlinearity at elevated pressures than identical sensors with solid diaphragms. Sensors (1.5×1.5 mm2) with perforated diaphragms (pores=40 μm) have a nonlinearity of approximately 10% while for the identical solid diaphragm sensor it was roughly 3 % over the entire 200 kPa range. This is the first time piezoresistive pressure sensors with integrated diffusion pores for detection of hydrogel swelling pressure have been fabricated and tested.
1. Introduction
Recent developments of specialized hydrogels for medical and chemical sensing applications has created a need to quantify physical changes that occur (within the hydrogel) in response to changing environmental conditions. These “stimuli-responsive” hydrogels have been shown to swell or shrink in response to a number of environmental and chemical stimuli including temperature [1], electric field [2], pH [3–8], glucose [9–16], and ionic strength [4, 10, 17–21]. Numerous studies have been performed on these hydrogels. Magda et al. [18] designed and tested a miniature biosensor for glucose concentration measurements in blood using the combination of a pressure transducer and a pH glucose gel. Herber et al. [19, 20, 22–24] created a number of sensors used for monitoring carbon dioxide concentrations. Gerlach et al. [6, 7, 17, 25–27] used hydrogels to measure to measure the changes in pH. Other transduction mechanisms used to measure the physical transitions in hydrogels include: quartz crystal microbalances (resonance) [28], holographic Bragg diffraction (optical) [29], electrode impedance (electrical) [12, 30], permittivity [31], and piezoresistive based cantilevers or membranes (mechanical-electrical) [6, 17, 21, 26, 27].
One sensor concept that directly addresses this need directly couples hydrogels to micro pressure sensors. These devices use the principal that chemically induced changes in the hydrogel causes an osmotic pressure increase or decrease leading to swelling or contracting, respectively. This swelling of the gel when confined under isochoric conditions leads to an increased pressure in the sensor cavity. The hydrogel is placed in contact with the sensing diaphragm (<5 mm) which converts these pressure fluctuations to changes in resistance which is measured using a Wheatstone bridge. The diaphragm acts as a stress intensifier and the piezoresistors are placed in regions of highest stress, which are typically located close to the midpoint of the diaphragm edge. The thin piezoresistive diaphragm and hydrogel cavity required are typically created using KOH etching of the bulk silicon [25–27]. Researchers have previously mechanically cut gels to size and manually positioned them in the cavity [6, 17, 21, 25–27] or alternatively polymerized the hydrogel solution directly in the cavity [19, 23].
A commonality to these designs is after hydrogel insertion a backing plate is attached to the backside of the sensor. This backing plate allows the diffusion of analyte into/out of the hydrogel cavity. Backing plates in the past has been made from wire meshes, nonporous polymers, micro-machined silicon, or glass and attached using adhesives or anodic bonding. Although the mesh backing keeps the hydrogel in contact with the sensor diaphragm a number of problems exist with the current technology. First, the fabrication procedure is complex requiring a number of individual components to be fabricated and assembled individually. Secondly, the permeable mesh has been shown to flex, reducing the amount of pressure transferred to the sensor diaphragm and hence reducing sensitivity [32]. If the pores are too large, the gels have been shown to exude through the mesh reducing pressure within the cavity [32]. Therefore it is important to accurately control the size of the pores. We previously reported on the optimization and geometry of a novel perforated diaphragm pressure sensor (Figure 1) through the use of finite element analysis [33]. It was shown that it is possible to incorporate pores directly into the sensing diaphragm without sacrificing sensitivity or mechanical robustness. Another observation was with appropriate placement, pores can act as stress concentrators and increase stress induced in the piezoresistors, potentially yielding higher sensitivity. The remainder of this article describes the fabrication and initial bulge testing of the first generation perforated diaphragm pressure sensors. A subsequent paper will describe the physical behavior of the sensors while coupled with the hydrogels tested in wet sensing environments.
Figure 1.

CAD rendering of an individual hydrogel based pressure sensor with analyte diffusion pores that are integrated into the sensing diaphragm.
2. Sensor Design and Fabrication
Square perforated diaphragm pressure sensors with widths of 0.5, 1.0, 1.25, and 1.5 mm were fabricated to measure hydrogel swelling pressures ranging from 5 to 150 kPa. Specifically two types of dies were fabricated during the process. First, “individual” sensor dies had sensors with widths of 0.5, 1.0, 1.25, and 1.5 mm and designed to have full scale pressures of 150, 50, 25 and 5 kPa, respectively. These sensors were intended to be singulated. Secondly, “array” dies contained four diaphragms: two 1×1 mm2, one 1.25×1.25 mm2 and one 1.5×1.5mm2 in a more compact layout measuring approximately 3×5 mm2. The arrays are intended to be used with various types of hydrogels simultaneously with different swelling pressure characteristics. The bulk micromachined cavities of the arrays are separated by 200 μm thick silicon frame created during the backside KOH etching. Finite element analysis showed that an insignificant amount of deflection occurs within the frame therefore cross sensitivities should be small and individual sensor sensitivity should be unaffected. These sensor designs were created conservatively with a large factor of safety and a burst pressure >10 times that of the specified full pressure. The 14 step front side fabrication process was carried out on 5 wafers by a commercial foundry (MSF, Frankfurt (Oder), Germany). The pores were created in diaphragms using deep reactive ion etching (DRIE) and the hydrogel cavity was etched using potassium hydroxide (KOH). Perforated sensors included etched pores of 10, 20, 30, and 40 μm in diameter within the diaphragms to allow the diffusion of analyte in to the hydrogel cavity using an optimized geometry previously discussed. This pore size was chosen for three primary reasons. First, they can easily be etched using DRIE. Secondly, provide a wide range to open surface areas allowing us to study the effect of pore incorporation and lastly are small enough to prohibit the hydrogel from exuding through the membrane. Solid diaphragm sensors were also fabricated using identical design parameters as a control. All design parameters including diaphragm thickness, piezoresistor dimensions, pores location, and metallization remained consistent. The optimized pattern of pores (30 μm) is shown for the perforated 1×1 mm2 sensor in Figure 2. This design was used because it significantly reduced the stress located on the pores without significantly modifying the normal longitudinal and transverse stress found in the piezoresistors. Figure 2 also illustrates the different types of sensor test structures fabricated including Kelvin, contact chain, diode and alignment test structures.
Figure 2.

CAD mask layout showing the various sensors designs. Sensors with and without perforated diaphragms were fabricated as individual sensors and part of an array. An enlarged image of the 1×1 mm2 perforated (pores=30 μm) diaphragm pressure sensor is shown on the right. This optimized pore geometry reduces the stress located within the pores, maintains high stress within the piezoresistors, while maintaining the diaphragm mechanical integrity. An enlargement of the transverse piezoresistor pair is shown below the 1×1 mm2 sensor magnification.
2.1 Oxidation and Implantation
Four inch (100 mm) n-type wafers oriented in the (100) direction with a resistivity of 3–6 Ω-cm were used as substrates. They were 400 ± 25 μm thick and double side polished with a total thickness variation (TTV) of < 5 μm. The wafers were cleaned using an RCA 1 (NH4OH:1, H2O2: 2, H2O:10) etch bath for 3 minutes. The first step in fabrication was to deposit a 500±20 nm silicon oxide using wet oxidation at 1000°C. Lithography was performed on the silicon oxide using AZ 6612 photo resist as an implantation mask and etched using a buffered oxide etch (BOE 7:1 NH4F:7, HF:1). This oxide layer isolates the metallization from the silicon substrate and opens the active diaphragm regions. A piranha etch (H2O2, H2SO4) was used to remove the resist and another RCA 1 cleaning was performed. The highly conductive p+ plus regions were defined using AZ 6612 resist and the first implantation was performed at an accelerating voltage of 80 keV with a dose of 5.5×1014 cm−2. The second implantation was performed at 90 keV and dose 2.5×1015 cm−2 designed to yield resistivity of 4×10⁻³ Ω-cm and depth of 0.2 μm for the piezoresistors. These are shown as steps1–4 in Figure 3, respectively.
Figure 3.

Fourteen step fabrication processes used to manufacture the perforated diaphragm pressure sensors.
2.2 Insulation and Metallization
After ion implantation the photoresist was removed using AZ stripper and cleaned in an O2 plasma, followed by the growth of a 100±5 nm thick thermal silicon oxide at 1000°C using dry oxidation. This layer is used to passivate the diaphragm and create another dielectric insulation layer for the metallization. The contact traces are situated on top of both oxidations layers to reduce leakage currents to the substrate.
An additional patterning step is performed using AZ 2020 to open contact windows to the piezoresistors followed by a blanket deposition of a 1 μm sputtered aluminum-silicon alloy. Patterning and development of the aluminum metallization traces was performed using AZ 2020 resist and aluminum etchant. The wafer was then briefly (1 min) cleaned to remove any silicon particles using equal parts of HF and HNO3. After the removal of photoresist using AZ stripper the aluminum was annealed in forming gas (H2 + N2 mixture) at 400°C. These are steps 5–8 as shown in Figure 3.
2.3 Passivation and Pore Etching
Passivation of the metallization is critical for our sensors since their intended use is within wet environments (saline) in-vitro and/or in-vivo. Therefore a 600 nm silicon nitride was deposited using plasma enhanced chemical vapor deposition (PECVD) at 400°C on both the topside and backside of the wafers. Windows were etched on the backside of the wafer using reactive ion etching (RIE) at pressure of 100 mTorr, at 100 W, using a mixture of CF4 and O2, creating a mask for the bullk micromachining using potassium hydroxide (KOH) wet etching. This process creates the cavity housing the hydrogel and controls the diaphragm thickness.
An AZ 2020 photoresist mask was used on the front-side of the wafer to define windows for contact etching and openings for the diaphragm pores. The nitride is etched with RIE and a subsequent BOE etching removes the 100 nm thermal oxide located within the pores. Bulk KOH etching was performed at 70°C (40% concentration) resulting in an etch rate of 35 to 40 μm/hour leaving a membrane of 15 ±3 μm thickness. Photoresist (MA-P 1275) was then applied to the topside of the wafer and removed only over the pores for a Bosch DRIE etch process to etch the silicon and finalize the pores using (SF6) and (C4F8). The photoresist was removed on the topside using AZ striper. Optical and scanning electron micrographs are displayed in Figure 4 showing sensors pre and post DRIE etching.
Figure 4.
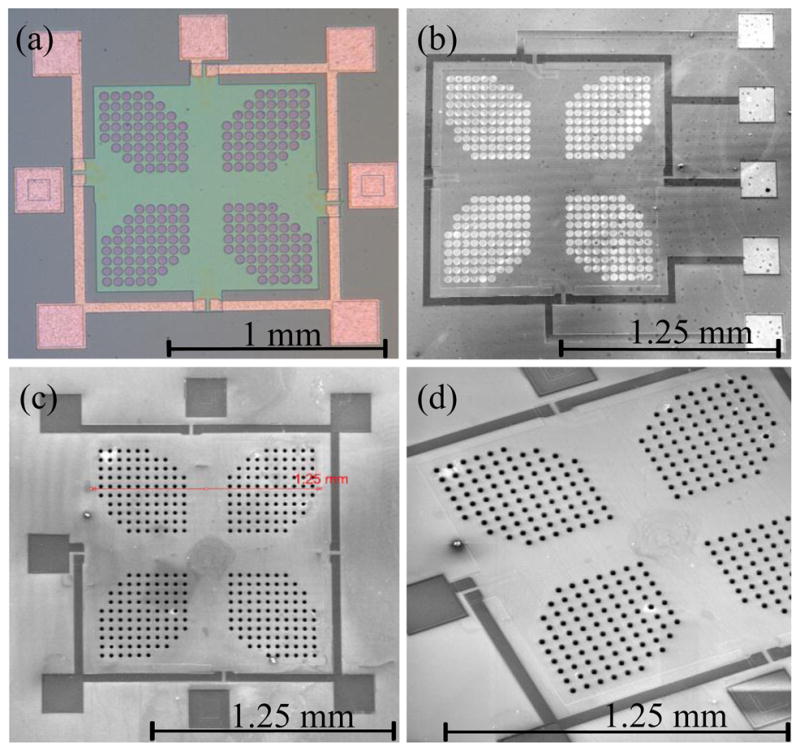
(a) Nomarski contrast optical micrograph of the 1.0 × 1.0 mm2 perforated diaphragm sensor illustrating the pores after wet etching but before DRIE. (b) Scanning electron microscope image of 1.25 × 1.25 mm2 perforated diaphragm sensor before DRIE. (c,d) SEM images of sensors post DRIE.
2.4 Dicing
In order to perform bulge testing “individual” and “array “dies measuring 8×8 mm2 were singulated from the wafer using a semi automatic Disco dicing saw at a feed rate of 2.5cm/sec.
3. Sensor Bulge Testing Apparatus
Investigating the performance of the perforated pressure sensors starts with characterizing the deflections of the diaphragms in response to the applied pressures. Accurate quantification of the deflection-pressure relationship provides important information on bending behavior giving insight to analytical and finite element model validity.
Sensor characterization was performed using a custom bulge testing station that couples an optical profilometer, an electronic pressure regulator, and electronics used to measure the sensor output shown in Figure 5a. The design and performance of this system are found in [34]. The system applies a regulated pressure to the backside of the diaphragms while measuring the sensors electrical output, calibrated applied pressure, and diaphragm deflection. The pressure can accurately be controlled with a resolution of approximately 290 Pa. An optical profilometer (Zygo Newview 5032, Stamford, CT) measures the three dimensional diaphragm deflection with nanometer resolution.
Figure 5.

Illustrated is the CAD design and photographs of the bulge testing apparatus used to measure applied pressure, sensor electrical output, and diaphragm deflection. (a) CAD layout of testing stage. (b) The sensor testing stage is mounted to the optical profilometer. (c) Four sensors are simultaneously mounted to the stage for testing and (d) wire bonded to the PCB board.
The 8×8 mm2 sensor dies were mounted to a stainless steel mounting plate using dicing wax (Nikka Seiko, Step wax No. 1, Tokyo, Japan) at 140°C to create an airtight seal. A calibrated pressure transducer (Omega PX429) with a range of 0–30 PSI and 0.08% full scale accuracy is mounted to the steel plate and connected to the channel that links the backside of the sensors. A Keithley 2400 digital source meter powers and records the output (4–20 mA) from the pressure transducer during experiments. Four sensor dies can be attached to the mounting plate and exposed to the same pressure channel. The sensors are ultrasonically wedge wire bonded using 50 μm diameter insulated gold wire (PF003774, Kanthal, Palm Coast, Florida, USA) from the bond pads to the custom printed circuit board (PCB) that is screwed on top of the steel mounting plate shown in Figure 5d. Although the particular tests presented here do not necessarily require the use of insulated gold wires, they will be needed for future wet tests. Hence, the sensors were assembled with this wire. The PCB board has a total of 80 electrical connections using two double sided 40 contact card edge connectors (Figure 5b-c). This high density output gives us the ability to measure characteristics of all piezoresistors simultaneously.
The card edge connectors are connected to a 40 pin terminal block which is attached to a Keithley 4200 semiconductor parameter analyzer which has four independent source measure units (SMUs) giving us the ability to record data from each piezoresistor while testing. This system allows us to characterize and calibrate the sensors before testing in-vitro/in-vivo while coupled with hydrogels.
4. Experimental Methods
We compared diaphragm deflections (μm), output voltages (V), and sensitivities (μV/V-kPa) between perforated and solid diaphragm sensors. Measurements were performed on “individual” and “array” sensor dies containing both perforated and solid diaphragms with sizes of 0.5×0.5 mm2, 1×1 mm2, 1.25×1.25 mm2, and 1.5×1.5 mm2 and DRIE etched pores have sizes of 10, 20, 30 and 40 μm. While testing sensors, compressed N2 was supplied via the gas inlet (Figure 5a) with pressures up to 200 kPa then exited through pores in the diaphragms while pressure was being measured by the calibrated pressure transducer. As pressure was increased N2 flowed through perforated diaphragms and the system was allowed to reach steady state equilibrium. In these tests we assume that at equilibrium (steady state) pressure gradients along the length of the testing stage N2 gas chamber are minimal and be neglected. Therefore, pressure applied to the bottom face of the diaphragms is identical to that witnessed by the calibrated pressure transducer. This assumption was validated by measuring the identical perforated sensor in all stage four positions at a single pressure; we found no output signal variation dependent on location.
Although analytical models exist that describe the deflection of solid square diaphragms [35–37], to our knowledge no models have been developed for the deflection of perforated diaphragms. Finite element modeling using COMSOL 3.4a (Burlington, MA, USA) was used to evaluate and optimize designs by modeling deflections, and stress within the diaphragms. Details on the finite element models demonstrating proof of concept are presented in [33]. Results show that it is possible to incorporate pores into the diaphragm without compromising the mechanical integrity or electrical sensitivity. Simulations used in this article use the same boundary conditions as previously reported [33] but an additional 120 nm oxide and a 600 nm thick silicon nitride passivation layers were included.
Since these sensors will be used with hydrogels, the boundary conditions of the FE models may not be completely accurate. Specifically the models do not take drag forces/differential pressures across the aperture into account, because they were designed for use with hydrogels.
5. Results and Discussion
5.1 Mechanical Deflection
While testing the pressure signal noise varied by roughly ±20 μA, corresponding to a variation of ±0.26 kPa for pressures <100kPa which is less than 1% and neglected. At higher pressures >150 kPa two sources of pressure noise became apparent. The system base noise levels became larger, on the order of ±100 μA corresponding to fluctuations of ±1.29 kPa. Although there was a significant increase of noise from the pressure sensor output it was still < 1% of the overall output. The second source of noise was large pressure oscillations which at pressures (>150 kPa) would cause large oscillations in deflection as shown in Figure 6 for the most sensitive 1.5×1.5 mm2 sensor.
Figure 6.

Large oscillations were observed in the deflection measurements if pressure fluctuations were present during testing. These pressure fluctuations were found to be caused N2 leaking from the bottom side of the sensors when not properly bonded with dicing wax to the mounting plate.
We eliminated these large pressure fluctuations and deflection oscillations using an improved method of sealing of the sensor dies to the mounting plate. After heating the steel mounting plate to 150ºC dicing wax (stepwax #1, Nikka Seiko, Tokyo, Japan) was applied to the and then sensors were attached. The improved the sensor die adhesion to the mounting plate prevented the leakage of N2 which we suspect caused the pressure fluctuations and diaphragm oscillations. The deflection measurements taken after the dies were mounted using step wax had very stable deflections and were easily measured. Solid diaphragms were tested in a similar fashion but the system was closed and pressure was increased and held constant. Measurements of the solid and perforated diaphragms using the new mounting technique showed little diaphragm vibration and significantly less noise from the pressure sensor output.
Figure 7 shows the deflection of a 1.25×1.25 mm2 diaphragm with 10 μm pores loaded with pressure ranging from 0 to 64.1 kPa (9 PSI). The diaphragm deflection clearly increases with pressure on a scale that can be easily and accurately measured using the optical profilometer. With no applied pressure the diaphragm has a negative deflection (bows downward) approximately (~100nm), which is attributed to the compressive stress developed in the passivation layers.
Figure 7.

(a–f) Diaphragm bulge surface plots for the 1.25×1.25 mm perforated diaphragm (pores = 10 μm) at pressures up to 65.1 kPa. (g) Deflection data was exported along the center of the diaphragm and plotted in relation to position. Compressive stress within the passivation layers caused the diaphragm to bulge downward with no applied pressure.
In previous simulations, only membranes without residual stress were modeled and it is well known that the presence of tensile or compressive stress significantly alters the deflection behavior of a membranes [38]. During deposition compressive stress was formed by a mismatch between the coefficients of thermal expansion of the Si substrate, SiO2, and Si3N4 films or/and intrinsic stresses within the film. The intrinsic residual stress Si3N4 films are known to vary significantly and are affected by the film composition [39, 40]. For our diaphragms, the PECVD Si3N4 films (600 nm) and SiO2 (120 nm) passivation layers are close to 5% the diaphragm thickness the source of compressive stress. A better fit, between the simulated data and empirical results was achieved using 281 MPa compressive stress in the Si3N4 layer.
Figure 8 compares the empirical and simulated deflection behavior of the 1.5×1.5 mm2 diaphragm with respect to hole size at a pressure of 150 kPa. Diaphragms with pores (a) 10 μm (b) 30 μm and (c) 40 μm in diameter had maximum deflections of 1.85, 2.23, and 1.92 μm, respectively. It was determined that the simulated deflections and empirical measurement are well correlated and have similar bending shapes.
Figure 8.

Surface plots recorded during bulge testing of diaphragms with (a)10 μm (b) 30 μm and (c) 40 μm pores at 150 kPa. Data was exported along the center of the diaphragm and (d) plotted in comparison to simulations results. Empirical and simulated results are similar and show that deflection of the diaphragm with 30 μm pores is the largest.
While an approximate solution for deflection and stiffness of a solid clamped rectangular thin plate subjected to uniform loading has been presented by many authors [35, 41, 42], to our knowledge a theoretical solution to the perforated plate geometry described in the paper does not exist. Therefore, only a qualitative understanding based on the numerical simulation results is presented. The perforated diaphragms bending shapes have slightly higher curvature than solid diaphragms due to the incorporation of pores which makes the diaphragms slightly more compliant and less rigid. Sensor diaphragms used in this study have from 1.5 to 33% open surface area and the sensors with 40 μm pores while the most compliant actually deflect less then diaphragms with 30 μm pores. This is presumably due to diaphragms with higher open surface area (larger pores) experience less total loading force on the bottom diaphragm surface due to the applied pressure. Similar trends were observed in empirical measurements and in finite element analysis where it is assumed applied pressure to the diaphragms’ bottom face is uniform. Although the effect is small it was most pronounced when comparing deflections of the largest diaphragms since they are the most pressure sensitive, have the highest pore density, and largest deflections. It should be stated that this simplified model ignores any flow effects due to the incorporation of diaphragm pores. We observed no measurable deflection hysteresis in the pressure testing of the perforated diaphragms.
5.2 Electrical Response
In parallel to measuring deflection the sensors electrically characterized. Seven bond pads were implemented in the design allowing us to characterize the performance of each piezoresistors individually and the bridge output voltage as shown in Figure 9. Pads 6 and 7 were used as substrate contacts which verified that there was insignificant current leakage from the piezoresistors and metallization. The resistance of the unloaded longitudinal piezoresistors was measured across pads 1–2 and 4–5 had an average resistance of 3.16±0.05 kΩ while the transverse piezoresistors had a resistance of 3.02±0.05, slightly unbalancing the Wheatstone bridge. The piezoresistors were within approximately 5% of the 3 kΩ design specification. The imbalance was likely due to preloading caused by initial compressive stresses present in the passivation layers. For sensitivity testing pads 3 and 4 were grounded, voltage of 5V was applied to pad 1, and voltage output is measured between pads 2 (decreasing) and 5 (increasing) with respect to applied pressure. Figure 9 gives the output voltages of the individual solid and perforated sensors from 0 to 62 kPa. The measured bridge offset ranged from 91 to 104 mV at a supply voltage of 5V.
Figure 9.

Micrograph of 1×1 mm2 sensor and electrical output voltages determined from bulge testing. (a) Optical micrograph of the 1×1 mm2 (pores = 20μm) with bond pads labeled. (b–f) Sensor outputs for both perforated and solid diaphragm sensors at a supply voltage of 5V. Results show that the sensors behave linearly within this pressure regime and the largest sensors have the highest sensitivities.
We also estimated the electrical output characteristics of the perforated diaphragm pressure sensors from data derived from the finite element simulations. These results established that sensors with a diaphragm thickness of 10 μm should give a voltage outputs ranging from 0.13 to 1.23 mV/V-kPa for sensors with dimensions of 0.5×0.5 and 1.5×1.5 mm (30 μm pores), respectively. The measured output voltages were approximately 80% less than these approximated values. This is presumably due the fabricated diaphragm thickness of 15±3 μm. The under etching of the diaphragms reduced the stress of the piezoresistors but also changed the location of the diaphragm edge. This combination and the addition of residual stress in the passivation layers significantly reduced measured output voltage. It was promising that the output from sensors was in the mV range and linear for the pressures of interest for the hydrogel sensor platform. To our knowledge these are the first tests of a perforated diaphragm piezoresistive pressure transducer, designed to allow the diffusion of analytes into a hydrogel cavity.
When comparing the sensitivity in over this pressure range (0–64 kPa), solid diaphragm sensors (without pores) had only slightly improved sensitivity shown in Figure 10. This was apparent for all diaphragm widths and is further proof that diaphragm thickness was the primary cause of reduced sensitivity. Examination of data revealed that initial incorporation of pores reduced sensitivity by 16, 28, 34, and 19% for the 10, 20, 30 and 40 μm sized pores when compared to the solid diaphragms. Sensitivity and output voltages are similar for both the individual sensors and arrays (Figure 10), and although the sensitivity is reduced the perforated diaphragm sensors are fully functional and easily measured. Another interesting effect is that sensitivity suddenly increases for the 40 μm pores. This contradicts simulation data and was likely due to DRIE etching irregularities of the larger pores reducing diaphragm thickness. Simulation data showed that pores incorporated in the diaphragm increased longitudinal stresses perpendicular to the diaphragm edge while reducing the parallel transverse stress.
Figure 10.

Sensitivity of the different diaphragm designs as a function of (a) pore diameter and (b) percentage of open area. The incorporation of pores reduced the sensitivity of sensors. Diaphragms with pores=40μm in diameter had higher sensitivity than other perforated designs with smaller diameter pores. This is due to a modified stress distribution across the piezoresistors.
The output nonlinearity was calculated using the End Point Linearity (EPL) model and all sensors tested have a nonlinearity < 1% for pressures < 65 kPa which is the range most significant to measure hydrogel swelling. Elevated pressure testing (up to 200kPa) was performed to study broadened sensor nonlinearity and failure characteristics. All dies were subjected to the elevated pressures without failure. Diaphragms 1.5×1.5 mm2 both solid and perforated (10, 40 μm pores) were compared because they are the most sensitive and most prone to nonlinearity. Results of the test are shown in Figure 11.
Figure 11.

Elevated pressure (~200kPa) linearity test performed on the 1.5×1.5 mm2 diaphragms with (a) solid (b) 10μm and (c) 40 μm pores. Perforated sensors shows higher linearity since pores reduce stiffness of the diaphragm leading to larger geometrical elongation and deformation.
We found that the perforated sensors have higher nonlinearity than the solid diaphragm sensors. In pressures measurements taken to 200 kPa the calculated nonlinearity is 3.49, 6.30, and 10.02 % for the 1.5 ×1.5 mm2 sensors that are solid and perforated with 10 and 40 μm pores, respectively. Nonlinearity in the solid diaphragm sensors is often due to large diaphragm deflections that cause stresses to be partially supported by membrane axial stresses (balloon effect) in response to the applied pressure. This is caused by the finite elongation in the central interior diaphragm plane [35]. For solid square diaphragms approximate formulas have been derived to calculate nonlinearity using the strain-energy method [43] but for perforated diaphragms these models do not apply. The reduced stiffness of the larger pored diaphragms may explain why the electrical output from the 40 μm pored diaphragm is significantly more nonlinear then the output from the 10 μm and solid diaphragm designs.
A second source of nonlinearity for the perorated sensors may stem from nonlinearity of the piezoresistive effect. It has been shown for high values of mechanical stresses (high pressures), resistivity changes are no longer proportional to the applied stress, and second and third order effects cannot be ignored. The diaphragms with 40 μm pores generate have higher sensitivities and therefore more stress in the piezoresistors as shown in Figure 10a, and therefore may also behave more nonlinearly.
Additional sources of nonlinearity in the pressure sensors may be due to the piezoresistor positions deviating from the diaphragm edge location, causing asymmetry in the sensitivities of the different resistors within the Wheatstone bridge. Ideally, the sensors were designed to have all resistors located at the same locations with respect to diaphragm edge. Fluctuations in substrate thickness, pore alignment, diaphragm thickness, and backside alignment accuracy in defining the diaphragm etch masks lead to piezoresistor position variation and may have contributed to the nonlinearity of the perforated diaphragm sensors [44].
The response time of the sensors is limited to the hydrogels ability to create swelling pressure. This intrinsic property is specific to particular hydrogels and is complex and a function of hydrogel kinetics, diffusivity of the hydrogel, amount of crosslinking, and ionic character. To improve the response times thinner gels are used with a higher proportion of surface area, which increases the diffusion rate of analyte into the hydrogel. Therefore the diaphragms with larger open areas should permit higher diffusion rates and reduce sensor response times.
6. Conclusions
We have presented fabrication details and initial bulge testing results for novel sensors that incorporate diffusion channels in to the sensing diaphragm for the detection of hydrogel swelling pressure. Sensors were created using a 14 step fabrication process, and pores were etched in the diaphragm using a combination of DRIE and KOH etching. Bulge testing using N2 show that the diaphragms are under compressive stress attributed to the diaphragms passivation layers (SiO2 and Si3N4). Bulge testing showed all perforated diaphragms are mechanically robust and able to withstand pressures >200 kPa. The diaphragm deflections were also dependent on pore size. Empirical and simulated results showed that the diaphragms with 30 μm pores had the highest deflections. This is due to a combination of effects, as the pore size increases the mechanical compliance is increased but loading force decreases because of a larger open area. For the 30 μm diaphragms the effect of reduced stiffness is more significant than the reduced loading force. Simulated deflections are within 10% of empirically measured values for the fabricated diaphragms. Sensitivities ranged from 23 to 252 μV/V-kPa for the perforated diaphragm pressure sensors. Incorporation of pores reduced sensitivity when compared to solid diaphragms. We found that for our design with 40 μm pores sensitivity was higher than for other pore sizes presumably due to over etching of perforated diaphragm. This paper shows that it is possible to incorporate pores into a pressure sensor diaphragm to allow chemical diffusion into the bulk etched hydrogel cavity. While the perforations do slightly reduce sensitivity sensors remain fully functional. Electrical output measurements conducted at hydrogel relevant output pressures (up to 65 kPa) showed that the perforated diaphragm sensors have little nonlinearity (<1 %) for their designed pressure ranges. It was also found that increased pore size leads to higher nonlinearity at pressures tested up to 200 kPa. A separate paper “Novel Hydrogel Based Piezoresistive Sensor Array (2×2) with Integrated Perforated Diaphragm for Metabolic Monitoring (in vitro)” discusses the results from initial in-vitro chemical testing.
Acknowledgments
This work is supported by NIH R21 grant #: 5R21EB008571-02.
Biographies
M.P. Orthner
Michael Orthner received his M.S. degree in from University of Utah in 2006 and developed a low pressure chemical vapor deposition (LPCVD) system for the epitaxial growth of 3C-SiC on Si. Presently, he is a doctoral candidate in Electrical Engineering focusing his research on development of hydrogel based sensors for metabolic monitoring applications. He was awarded the F. M. Becket summer fellowship from the Electrochemical Society in 2007. In 2008 and 2009, he was awarded a scholarship from the Society of Vacuum Coaters (SVC).
Sebastian Buetefisch
Sebastian Buetefisch received his Diploma in mechanical engineering from the Technical University of Braunschweig, Germany, in 1997. Since 1997, he has been employed at the Institute for Microtechnology at the Technical University of Braunschweig. His research interests are in the development and fabrication of micro-grippers, micro-mechanical actuators, low-g acceleration sensors, tuning fork gyroscopes and high resolution three-dimensional tactile force sensors.
L.W. Rieth
Loren Rieth received his BS degree in materials science from The Johns-Hopkins University, Baltimore, MD, in 1994. He received his PhD in materials science and engineering from the University of Florida, Gainesville, FL, in 2001. From 2001 to 2003, he was a postdoctoral research associate at the University of Utah, Salt Lake City, UT, and continued on at the University of Utah as a research assistant professor in materials science (2003–2005), and electrical and computer engineering (2004–present). His research is focused on deposition and characterization of thin film materials for sensors (chemical, physical, and biological), MEMS, BioMEMS, and energy production.
J. Magda
Jules Magda is an associate professor in Chemical Engineering and in Materials Science & Engineering at the University of Utah. He received his B.S. in chemical engineering in 1979 from Stanford University, and his Ph.D. in chemical engineering and materials science in 1986 from the University of Minnesota in Minneapolis. His areas of interest include stimuli responsive hydrogels and biomedical sensors for treatment of diabetes and obesity.
F. Solzbacher
Prof. Solzbacher is Director of Microsystems Laboratory, Director of the Utah Nanofabrication Laboratory at the University of Utah, Co-Director of the Utah Nanotechnology Institute, President of Blackrock Microsystems and holds faculty appointments in Electrical and Computer Engineering, Materials Science and Bioengineering. His research focuses on harsh environment microsystems and materials, including implantable, wireless microsystems for biomedical and healthcare applications, but also high temperature and harsh environment compatible micro sensors. Prof. Solzbacher received his M.Sc. EE from the Technical University Berlin in 1997 and his Ph.D. from the Technical University Ilmenau in 2003. He is co-founder of several companies such as Blackrock Microsystems, First Sensor Technology and NFocus. He was a board member and Chairman of the German Association for Sensor Technology AMA from 2001 until 2009, and serves on a number of company and public private partnership advisory boards. He is author of over 100 journal and conference publications, 5 book chapters and 16 pending patents.
Footnotes
Publisher's Disclaimer: This is a PDF file of an unedited manuscript that has been accepted for publication. As a service to our customers we are providing this early version of the manuscript. The manuscript will undergo copyediting, typesetting, and review of the resulting proof before it is published in its final citable form. Please note that during the production process errors may be discovered which could affect the content, and all legal disclaimers that apply to the journal pertain.
References
- 1.Richter A, Kuckling D, Howitz S, Gehring T, Arndt KF. Electronically controllable microvalves based on smart hydrogels: magnitudes and potential applications. Journal of Microelectromechanical Systems. 2003;12:748–753. [Google Scholar]
- 2.Tanaka T, Fillmore D, Sun ST, Nishio I, Swislow G, Shah A. Phase Transitions in Ionic Gels. Physical Review Letters. 1980;45:1636. [Google Scholar]
- 3.Johnson BD, Beebe DJ, Crone WC. Effects of swelling on the mechanical properties of a pH-sensitive hydrogel for use in microfluidic devices. Materials Science and Engineering: C. 2004;24:575–581. [Google Scholar]
- 4.De SK, Aluru NR, Johnson B, Crone WC, Beebe DJ, Moore JA. Equilibrium swelling and kinetics of pH-responsive hydrogels: models, experiments, and simulations. Journal of Microelectromechanical Systems. 2002;11:544–555. [Google Scholar]
- 5.Cai QY, Grimes CA. A salt-independent pH sensor. Sensors & Actuators: B Chemical. 2001;79:144–149. [Google Scholar]
- 6.Gerlach G, Guenther M, Suchaneck G, Sorber J, Arndt KF, Richter A. Application of sensitive hydrogels in chemical and pH sensors. Macromolecular Symposia. 2004;210:403–410. [Google Scholar]
- 7.Sorber J, Steiner G, Schulz V, Guenther M, Gerlach G, Salzer R, Arndt KF. Hydrogel-Based Piezoresistive pH Sensors: Investigations Using FT-IR Attenuated Total Reflection Spectroscopic Imaging. Analytical Chemistry. 2008;80:2957–2962. doi: 10.1021/ac702598n. [DOI] [PubMed] [Google Scholar]
- 8.Zhao B, Moore JS. Fast pH- and Ionic Strength-Responsive Hydrogels in Microchannels. Langmuir. 2001;17:4758–4763. [Google Scholar]
- 9.Jung DY, Magda JJ, Han IS. Catalase Effects on Glucose-Sensitive Hydrogels. Macromolecules. 2000;33:3332–3336. [Google Scholar]
- 10.Suri JT, Cordes DB, Cappuccio FE, Wessling RA, Singaram B. Continuous Glucose Sensing with a Fluorescent Thin-Film Hydrogel13. Angewandte Chemie. 2003;115:6037–6039. doi: 10.1002/anie.200352405. [DOI] [PubMed] [Google Scholar]
- 11.Eddington DT, Beebe DJ. Flow control with hydrogels. Advanced Drug Delivery Reviews. 2004;56:199–210. doi: 10.1016/j.addr.2003.08.013. [DOI] [PubMed] [Google Scholar]
- 12.Guiseppi-Elie A, Brahim S, Slaughter G, Ward KR. Design of a subcutaneous implantable biochip for monitoring of glucose and lactate. Sensors Journal, IEEE. 2005;5:345–355. [Google Scholar]
- 13.Zhao YJ, Davidson A, Bain J, Li SQ, Wang Q, Lin Q. A MEMS viscometric glucose monitoring device, in Solid-State Sensors, Actuators and Microsystems, 2005. Digest of Technical Papers; TRANSDUCERS ‘05. The 13th International Conference on,A. Davidson; 2005. pp. 1816–1819 . [Google Scholar]
- 14.Yongjun Z, Siqi L, Arthur D, Bozhi Y, Qian W, Qiao L. A MEMS viscometric sensor for continuous glucose monitoring. Journal of Micromechanics and Microengineering. 2007:2528. doi: 10.1088/0960-1317/23/5/055020. [DOI] [PMC free article] [PubMed] [Google Scholar]
- 15.Zhao Y, Li S, Davidson A, Yang B, Wang Q, Lin Q. A MEMS viscometric sensor for continuous glucose monitoring. Journal of Micromechanics and Microengineering. 2007;17:2528–2537. doi: 10.1088/0960-1317/23/5/055020. [DOI] [PMC free article] [PubMed] [Google Scholar]
- 16.Wang J. Electrochemical Glucose Biosensors. Chemical Reviews. 2008;108:814–825. doi: 10.1021/cr068123a. [DOI] [PubMed] [Google Scholar]
- 17.Gerlach G, Guenther M, Sorber J, Suchaneck G, Arndt KF, Richter A. Chemical and pH sensors based on the swelling behavior of hydrogels. Sensors & Actuators: B Chemical. 2005;111:555–561. [Google Scholar]
- 18.Han IS, Han MH, Kim J, Lew S, Lee YJ, Horkay F, Magda JJ. Constant-Volume Hydrogel Osmometer: A New Device Concept for Miniature Biosensors. Biomacromolecules. 2002;3:1271–1275. doi: 10.1021/bm0255894. [DOI] [PubMed] [Google Scholar]
- 19.Herber S, Borner J, Olthuis W, Bergveld P, Van Den Berg A. Transducers. Vol. 2. Seoul, South Korea: 2005. A micro CO2 gas sensor based on sensing of pH-sensitive hydrogel swelling by means of a pressure sensor; pp. 1146–1149. [DOI] [PubMed] [Google Scholar]
- 20.Herber S, Olthuis W, Bergveld P, van den Berg A. Exploitation of a pH-sensitive hydrogel disk for CO2 detection. Sensors & Actuators: B Chemical. 2004;103:284–289. [Google Scholar]
- 21.Margarita G, Gerald G, Dirk K, Katja K, Cathrin C, Jens W, Joerg S, Gunnar S, Karl-Friedrich A. In: Chemical sensors based on temperature-responsive hydrogels. Daniele I, Wolfgang E, Brian C, Kara JP, Eric U, editors. Vol. 6167. 2006. p. 61670T. [Google Scholar]
- 22.Herber S, Bomer J, Olthuis W, Bergveld P, Berg Avd. A Miniaturized Carbon Dioxide Gas Sensor Based on Sensing of pH-Sensitive Hydrogel Swelling with a Pressure Sensor. Biomedical Microdevices. 2005;7:197–204. doi: 10.1007/s10544-005-3026-5. [DOI] [PubMed] [Google Scholar]
- 23.Herber S, Eijkel J, Olthuis W, Bergveld P, Berg Avd. Study of chemically induced pressure generation of hydrogels under isochoric conditions using a microfabricated device. The Journal of Chemical Physics. 2004;121:2746–2751. doi: 10.1063/1.1773153. [DOI] [PubMed] [Google Scholar]
- 24.Herber S, Olthuis W, Bergveld P. A swelling hydrogel-based PCO2 sensor. Sensors and Actuators B: Chemical. 2003;91:378–382. [Google Scholar]
- 25.Guenther M, Gerlach G, Corten C, Kuckling D, Sorber J, Arndt KF. Hydrogel-based sensor for a rheochemical characterization of solutions. Sensors & Actuators: B Chemical. 2007 [Google Scholar]
- 26.Guenther M, Kuckling D, Corten C, Gerlach G, Sorber J, Suchaneck G, Arndt KF. Chemical sensors based on multiresponsive block copolymer hydrogels. Sensors and Actuators B: Chemical. 2007;126:97–106. [Google Scholar]
- 27.Thong Trinh Q, Gerlach G, Sorber J, Arndt KF. Hydrogel-based piezoresistive pH sensors: Design, simulation and output characteristics. Sensors and Actuators B: Chemical. 2006;117:17–26. [Google Scholar]
- 28.Richter A, Bund A, Keller M, Arndt KF. Characterization of a microgravimetric sensor based on pH sensitive hydrogels. Sensors and Actuators B: Chemical. 2004;99:579–585. [Google Scholar]
- 29.Cong J, Zhang X, Chen K, Xu J. Fiber optic Bragg grating sensor based on hydrogels for measuring salinity. Sensors and Actuators B: Chemical. 2002;87:487–490. [Google Scholar]
- 30.Scheller FW, Wollenberger U, Warsinke A, Lisdat F. Research and development in biosensors. Current Opinion in Biotechnology. 2001;12:35–40. doi: 10.1016/s0958-1669(00)00169-5. [DOI] [PubMed] [Google Scholar]
- 31.Huang X, Li S, Schultz JS, Wang Q, Lin Q. A dielectric affinity microbiosensor. Applied Physics Letters. 2010;96:033701. [Google Scholar]
- 32.Lin G, Chang S, Kuo CH, Magda J, Solzbacher F. Free swelling and confined smart hydrogels for applications in chemomechanical sensors for physiological monitoring. Sensors & Actuators: B Chemical. 2008:186–195. doi: 10.1016/j.snb.2008.11.001. [DOI] [PMC free article] [PubMed] [Google Scholar]
- 33.Orthner M, Rieth L, Buetefisch S, Solzbacher F. Design, Simulation and Optimization of a Novel Piezoresistive Pressure Sensor with Stress Sensitive Perforated Diaphragm for Wet Sensing and Hydrogel Applications. Sensors and Actuators B: Chemical. 2009 Submitted Manuscript. [Google Scholar]
- 34.Orthner M, Rieth L, Solzbacher F. High Speed Wafer Scale Bulge Testing Apparatus for the Determination of Thin Film Mechanical Properties. Review of Scientific Instruments. 2010 doi: 10.1063/1.3427493. Submitted Manuscript. [DOI] [PMC free article] [PubMed] [Google Scholar]
- 35.Timoshenko SP, Woinowsky-Krieger S. Theory of plates and shells, Engineering Societies Monographs. 2 New York: McGraw-Hill; 1959. [Google Scholar]
- 36.Hin-Leung C, Wise KD. Scaling limits in batch-fabricated silicon pressure sensors, Electron Devices. IEEE Transactions on. 1987;34:850–858. [Google Scholar]
- 37.Maier-Schneider D, Maibach J, Obermeier E. A new analytical solution for the load-deflection of square membranes. Journal of Microelectromechanical Systems. 1995;4:238–241. [Google Scholar]
- 38.Vlassak JJ, Nix WD. A new bulge test technique for the determination of Young’s modulus and Poisson’s ratio of thin films. J Mater Res. 1992;7 [Google Scholar]
- 39.Stadtmueller M. Mechanical Stress of CVD-Dielectrics. Journal of the Electrochemical Society. 1992;139:3669–3674. [Google Scholar]
- 40.Olson JM. Analysis of LPCVD process conditions for the deposition of low stress silicon nitride. Part I: preliminary LPCVD experiments. Materials Science in Semiconductor Processing. 2002;5:51–60. [Google Scholar]
- 41.Ventsel E, Krauthammer T. Thin plates and shells: theory, analysis, and applications. CRC Press; 2001. [Google Scholar]
- 42.Madou MJ. Fundamentals of microfabrication : the science of miniaturization. 2. Boca Raton, Fla. ; London: CRC Press; 2002. [Google Scholar]
- 43.Suzuki K, Ishihara T, Hirata M, Tanigawa H. Nonlinear analysis of a CMOS integrated silicon pressure sensor. Electron Devices, IEEE Transactions on. 1987;34:1360–1367. [Google Scholar]
- 44.Marco S, Samitier J, Ruiz O, Morante JR, Esteve J. High-performance piezoresistive pressure sensors for biomedical applications using very thin structured membranes. Measurement Science and Technology. 1996:1195. [Google Scholar]