Abstract
This report details the chemical and associated electrical resistance changes of silver vanadium phosphorous oxide (Ag2VO2PO4, SVPO) incurred during electrochemical reduction in a lithium based electrochemical cell over the range of 0 to 4 electrons per formula unit. Specifically the cathode electrical conductivities and associated cell DC resistance and cell AC impedance values vary with the level of reduction, due the changes of the SVPO cathode. Initially, Ag+ is reduced to Ag0 (2 electrons per formula unit, or 50% of the calculated theoretical value of 4 electrons per formula unit), accompanied by significant decreases in the cathode electrical resistance, consistent with the formation of an electrically conductive silver metal matrix within the SVPO cathode. As Ag+ reduction progresses, V5+ reduction initiates; once the SVPO reduction process progresses to where the reduction of V5+ to V4+ is the dominant process, both the cell and cathode electrical resistances then begin to increase. If the discharge then continues to where the dominant cathode reduction process is the reduction of V4+ to V3+, the cathode and cell electrical resistances then begin to decrease. The complex cathode electrical resistance pattern exhibited during full cell discharge is an important subject of this study.
Keywords: silver vanadium phosphorous oxide, AC impedance, conductivity, electrochemical reduction, electrical resistance, lithium battery
1. INTRODUCTION
Implantable medical electrically powered devices have specific power source performance requirements. For example, devices such as pacemakers and neurostimulators have a fairly constant energy draw from the power source over the lifetime of the device, while the implantable cardioverter defibrillator (ICD) has particularly demanding requirements, due largely to the broad range in power demands required for complete ICD function. Since an ICD is used to both continuously monitor heart function and treat arrhythmias with a high energy shock delivered to the heart, primary lithium batteries for the ICD application must be able to supply continuous 10-50 microampere level currents to power the monitoring circuitry and in some cases to support heart pacing functionality. Yet on detection of an arrhythmia, the same batteries must provide ampere level currents at an energy level of 30 to 50 Joules to rapidly charge the high voltage capacitors whose discharge to the heart interrupts the ventricular fibrillation.(1) Additionally, ICD batteries must enable long device lifetime (high capacity), occupy minimal space (high volumetric energy density), and perform in a safe, reliable and predictable manner.
Silver vanadium oxide (Ag2V4O11, SVO) has been a widely used cathode material in batteries powering ICDs over the past twenty years.(2, 3, 4) Technical details concerning successful implementation of the lithium/SVO battery in ICDs have been described.(5, 6, 7, 8, 9, 10) Further, the discharge process of SVO in a lithium battery has been investigated by several methods including titration, x-ray powder diffraction and solid state NMR.(10, 11, 12, 13) The discharge process of SVO initiates with the competitive reduction of Ag+ to Ag0 and of V5+ to V4+ and then proceeds to some reduction of V4+ to V3+. Notably, the reduction of silver ion was observed to form silver metal nanoparticles and nanowires within the cathode and contribute to a significant increase in cell conductivity on discharge.(3, 14) Since the ICD application requires pulse power, minimizing cell resistance and impedance are critical to appropriate ICD battery function. Studies of the impedance characteristics of Li/SVO batteries and SVO conductivity measurements have been reported as a function of depth of discharge where the battery impedance and SVO cathode resistance decreased as discharge was initiated and increased after mid-life of the battery.(13, 15)
A fluorinated silver vanadium oxide material (Ag4V2O6, SVOF) has been reported as a new cathode material for potential ICD battery use.(16) When discharged under a constant current of 0.001 mA to 1.5 V, a discharge capacity of 251 mAh/g was reported for lithium / SVOF batteries, with insertion of up to 6.25 mol of lithium insertion per formula unit. The high voltage (> 3 V) capacity of SVOF (148 mAh/g) was stated to compared favorably to that of SVO (100 mAh/g). Hydrothermal(17) and low temperature routes(18) have been explored for SVOF synthesis. Due to its high density (6.03 g cm-3) SVOF shows a high thermodynamic capacity of 892 mAh cm3 above 3 V, which compares favorably with SVO. However, the SVOF material shows significant polarization, corresponding to a 30%, 45%, and 80% decrease in capacity at D/50, D/10, and D rates, respectively.(17) Optimizations to SVOF particle size and electrode porosity have been posed as pathways to further improve rate capability and performance of the SVOF cathode.
Over the past several years, phosphate-based materials, generally LixMPO4 where M represents Fe, Mn, or VO, have received significant attention as rechargeable materials for secondary energy storage, for applications ranging from power tools to load leveling devices to electric vehicles.(19, 20, 21, 22, 23, 24, 25, 26, 27) These phosphate-based materials demonstrate high levels of chemical and structural stability in lithium based batteries while providing adequate voltage and capacity despite their inherently low electrical conductivity.(28, 29, 30, 31) We recently released the first report on the electrochemistry of silver vanadium phosphorous oxide (Ag2VO2PO4, SVPO) in lithium batteries.(32) SVPO was deliberately selected for consideration in next generation implantable device batteries anticipating several promising characteristics: 1) high chemical stability consistent with that observed in other phosphate cathode materials, 2) high capacity due to the multiple electron transfer present in bimetallic materials, 3) high conductivity exceeding that of other phosphate based materials due to in-situ generation of a conductive silver matrix. Under constant current discharge, the SVPO material displayed high current capability, supporting 50 mA cm-2 pulses above 1.5 V.
In our investigation of the discharge of a lithium/silver vanadium phosphorous oxide electrochemical cell we also reported the formation of silver nanoparticles in the cathode upon discharge.(33) Ex-situ x-ray diffraction analysis of the reduced cathode material revealed generation of silver metal on initiation of discharge, where Ag0 peak intensity increased linearly from 0 – 2.4 electrons per formula unit and remained unchanged from 2.4 – 3.6 electrons per formula unit. Cell AC impedance measurements in the range of 0 – 0.08 electrons per formula unit showed a 15,000 fold decrease in cell resistance, which was attributed to a significant cathode conductivity increase. However, cathode conductivity was not measured directly in this previous report, and cell AC impedance was not analyzed beyond 0.2 electrons per formula unit (5% depth of discharge).
Lithium cell resistance is a key parameter in assessing the suitability of cathode materials for applications requiring pulse power such as the implantable cardioverter defibrillator, and it is critical to understand cell resistance changes over the full cell lifetime. The study reported here is a comprehensive investigation of SVPO cathode conductivity measured by the four-point probe method and the associated changes in lithium cell impedance and cell DC resistance as a function of discharge over the complete range of 0 to 4 electrons per formula unit of silver vanadium phosphorous oxide (Ag2VO2PO4, SVPO). In addition, ex-situ x-ray diffraction (XRD) and magnetic susceptibility measurements of the SVPO cathodes are presented to explain the discharge mechanism and rationalize the observed changes in conductivity.
2. EXPERIMENTAL
Silver vanadium phosphorous oxide (SVPO, Ag2VO2PO4) was synthesized according to a previously reported method.(34) The material was characterized by x-ray powder diffraction to verify structure and by differential scanning calorimetry to confirm phase purity. Cathodes were prepared as pressed pellets using either the pure as prepared Ag2VO2PO4 or as a composite. For the composite, a mixture of the active material was combined with graphite and polytetrafluoroethylene (PTFE). Typical SVPO only cathode thickness was 0.54 mm, while typical composite cathode thickness was 0.46 mm.
The four-point probe method was used to obtain the conductivity of the mixture based cathodes.(35, 36) The equipment for this measurement was a standard linear 4-point probe arrangement with a probe spacing of 1 mm. The outer probes were connected to a current source in series with a current meter while the corresponding voltage drop was measured across the inner probes using a voltmeter. Measurements were taken in five different positions along the central region of each pellet. Cathode conductivity measurements were obtained on fresh cathodes and cathodes recovered from partially discharged cells. Cathode pellets were recovered from the partially discharged cells and repeatedly rinsed with solvents in a glove box atmosphere prior to drying. Scanning electron micrographs of the cathode pellets mounted on double-sided carbon sticky tape were taken on a Hitachi SU-70 field emitting microscope, using a YAG backscatter electron detector. Magnetic susceptibility measurements were collected at room temperature using a Johnson-Matthey Mark I magnetic susceptibility balance. XRD data was collected using a Rigaku Ultima IV instrument, and analyzed using JADE software with ICDD and ICSD databases.
Experimental type 2325 coin cells were fabricated in an Argon atmosphere glove box. Coin cells had a 23 mm diameter and an overall thickness of 2.5 mm. Cells used 1M LiAsF6 in 50/50 (v/v) propylene carbonate/dimethoxyethane electrolyte and a lithium foil anode, with cathodes of 1.33 cm2 area. Polypropylene separator disks were used in the cell assembly. Cell discharge was performed at 37°C using a Maccor multichannel testing system under rates of C/200 to C/700 until the desired depths of discharge (DODs) were achieved. For the SVPO only cells, discharge rates of 1.3 mA g-1 and 0.30 mA cm-2 were used, while for the SVPO composite cells, discharge rates of 0.39 mA g-1 and 0.045 mA cm-2 were used. Cell internal resistance, RDC, was calculated for both sets of experimental cells from the open circuit voltage, loaded voltage and applied current. Open circuit voltage readings were recorded until the cell voltage had changed less than 10 mV over the previous 24 hours.
AC impedance measurements were collected using a CH Instruments Model 604C Electrochemical Analyzer in the frequency range of 0.1 mHz to 100 kHz using a 5 mV amplitude for the undischarged SVPO only cathode cells. AC Impedance measurements were performed on partially discharged cells and composite cells with a low frequency of 10 mHz. Analysis of the AC Impedance measurements was conducted using the ZView™ Impedance/Gain Phase Graphing and Analysis Software, Version 3.1c. The data were fit to simplified circuits which were selected for analysis of the resistance components. In some cases, the raw data contained some minor discontinuities. Data discontinuities were not corrected or smoothed, rather the mathematical fits were used directly on the collected AC impedance data.
3. RESULTS
SVPO crystallizes in a monoclinic C2/m space group and exhibits a layered structure as shown in Figure 1.(37) XRD data was assessed as a function of state of discharge from ex-situ analysis of as prepared and reduced SVPO cathodes, shown in Figure 2. Silver metal formation was observed upon reduction of SVPO, with a regular increase in Ag0 peak intensity up to 2.4 equivalents of Li+ (from Ag2VO2PO4 → Li2.4Ag2VO2PO4).(33) Ex-situ magnetic susceptibility data was collected for the powdered SVPO cathode samples as a function of discharge, as shown in Figure 3. Measurements were taken in triplicate and the reported values are averages of three measurements. A powdered HgCo(SCN)4 sample was used to calibrate the balance.(38)
Figure 1.
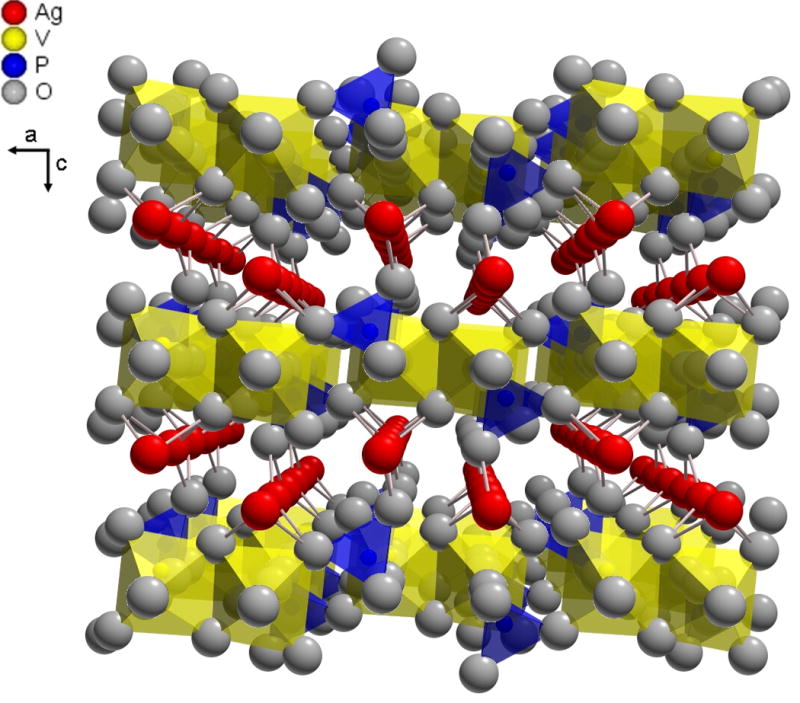
Structure of silver vanadium phosphorous oxide (Ag2VO2PO4, SVPO), oriented along the [010] direction showing silver ions between the vanadium phosphorous oxide layers.
Figure 2.
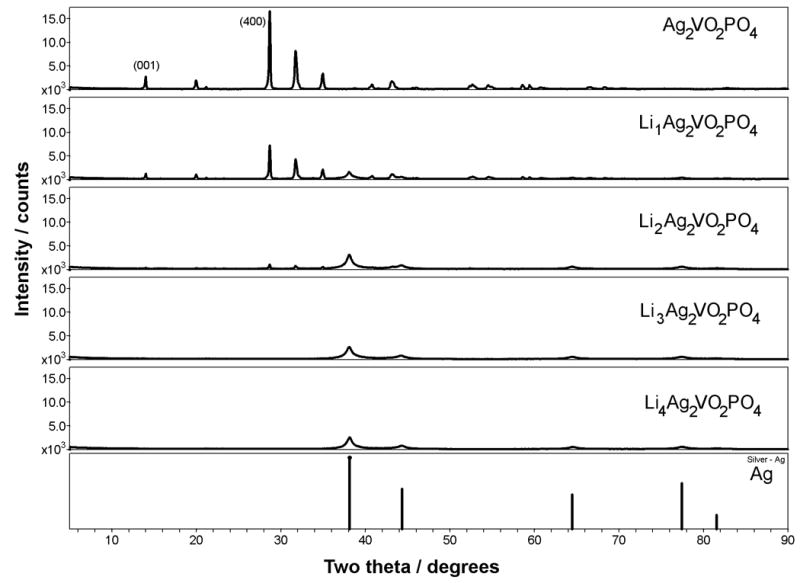
X-ray diffraction of SVPO as a function of discharge.
Figure 3.
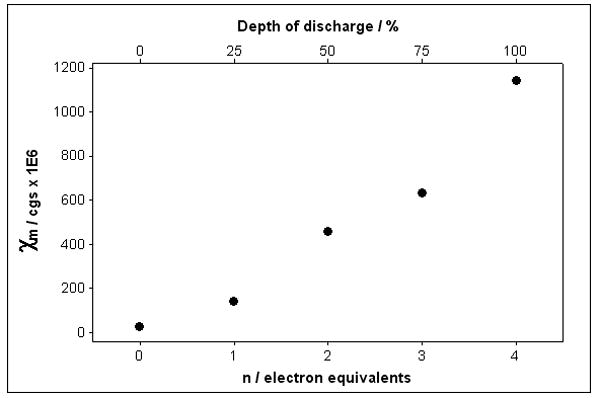
Magnetic susceptibility of SVPO as a function of discharge.
The open circuit voltage values for lithium/ silver vanadium phosphorous oxide (SVPO, Ag2VO2PO4) cells as a function of discharge are shown in Figures 4A and 4B. Figure 4A displays the values for cells assembled using composite cathodes containing carbon and binder. Figure 4B shows the results for lithium cells assembled using pure SVPO cathodes with no binder or conductive additives in the cathode. The theoretical discharge capacity calculations are based on four electron transfer per formula unit where it was assumed that both Ag+ ions are reduced to silver metal and V5+ is reduced to V4+ and then V3+ consistent with our prior findings.(33) The open circuit voltage values in each plot are reported for a population of cells with the average value and the variation of each population shown. The difference between the open circuit voltage and the loaded voltage divided by the applied current was used to calculate cell internal DC resistance, RDC. The calculated cell RDC values are shown in Figures 4A and 4B. For both groups of cells, the cell resistance decreases as cell discharge initiates. There is a significant decrease in cell resistance with a discharge of only about 0.1-0.2 electron equivalents. After the initial decrease in cell resistance, the cell DC resistance remains fairly constant until approximately 2.0-2.5 electron equivalents where a significant increase in the calculated cell resistance is observed. Notably, as the discharge of the cells is continued past 3.0-3.5 electron equivalents, a decrease in cell resistance is noted. Since the resistance of the cells was calculated from difference between the loaded voltage and the open circuit voltage, values were not available from the cells with the composite electrodes as the cells were fully depleted past the 3.5 electron equivalent point. Overall, the cell resistance is lower for cells constructed with the composite cathodes compared to the cells assembled with pure SVPO cathodes.
Figure 4.
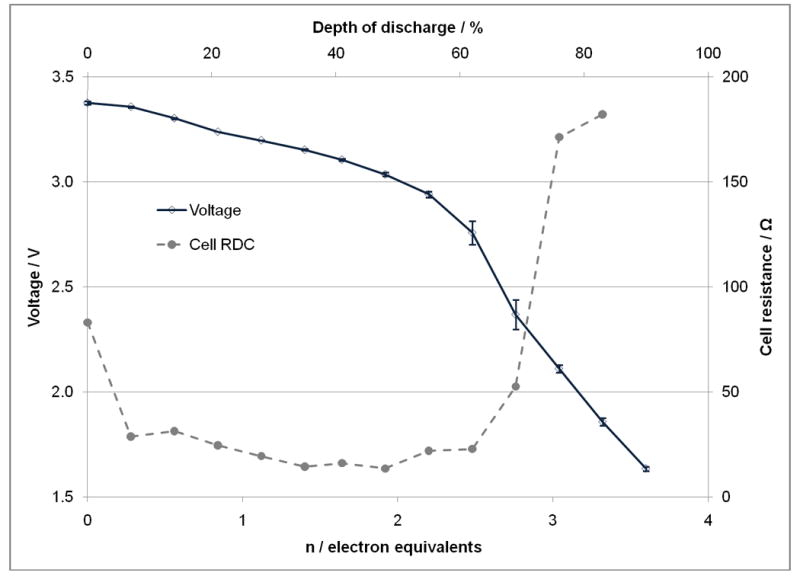
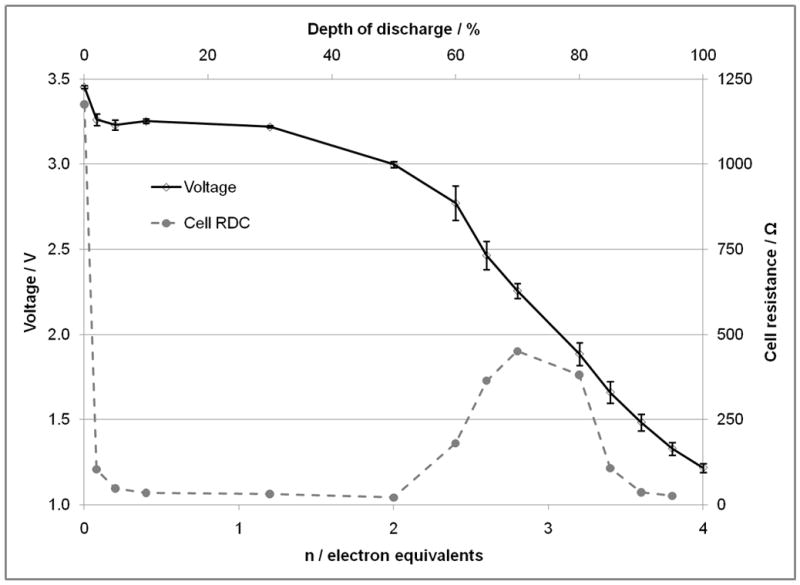
Open circuit voltage and calculated cell DC resistance as a function of electron equivalents and depth of discharge. A. For lithium anode / SVPO composite cathode cells. B. For lithium anode / SVPO only cathode cells as a function of electron equivalents and depth of discharge.
AC impedance was recorded at various depths of discharge for cells with SVPO composite cathodes as well as cells with SVPO only cathodes. The impedance at several selected depths of discharge is shown in Figures 5 and 6. In all cases, 100% depth of discharge (DOD) was taken as 4 electron equivalents per formula unit of silver vanadium phosphorous oxide (Ag2VO2PO4, SVPO). Figure 5 illustrates the measured AC impedance for cells assembled with composite cathodes at 0, 7, 48, 83 and 90% depth of discharge. These depths of discharge were selected as they illustrate the significant changes taking place in the cells during the course of the discharge. As illustrated in Figure 5, the diameter of the semicircle in the Nyquist plot for a fresh cell is approximately 60 ohms. Once discharge has been initiated, the diameter of the semicircle of the cell AC impedance decreases to approximately 15 ohms at 7% depth of discharge (DOD). This value remains relatively constant until about 50% depth of discharge. As discharge continues an increase in the diameter of the semi-circle is noted. The largest recorded impedance was obtained at ~83% DOD. As the cell discharge continued to 90%, an approximately three-fold decrease in the diameter of the semicircle of the cell AC impedance was observed. Figure 6 illustrates the measured AC impedance results for lithium cells assembled with pure SVPO cathodes at 0, 5, 50, 80 and 90% depth of discharge. The AC impedance measured for a fresh cell showed a large diameter of the Nyquist plot with the semi-circle exceeding 106 ohms. Once the cell depth of discharge had progressed to a few percent, a substantial decrease in the cell impedance was observed where the diameter of the semicircle in the Nyquist plot had decreased to a value of about 40 ohms at 5% DOD. The change in the diameter of the semicircle was a >15,000 fold decrease. As the cell discharge progressed, the observed cell impedance remained between 20 and 50 ohms until about 50% depth of discharge and then began to rise again. The AC impedance measured for cells at ~80% DOD had the highest value. As cells were discharged further to 90% DOD, the measured cell impedance value had decreased by a factor of 20 compared to the 80% DOD measurement. The general trends of the impedance values for the lithium/SVPO cells with composite cathodes as well as pure SVPO cathodes showed impedance decreases with initial discharge. The cell impedance then stayed relatively constant from about 10-50% DOD and then rose as the cells discharged past ~60% DOD. The maximum impedance values were noted for cells at approximately 80% DOD. If the cell discharge continued past 85% DOD, a decrease in the cell AC impedance was observed.
Figure 5.
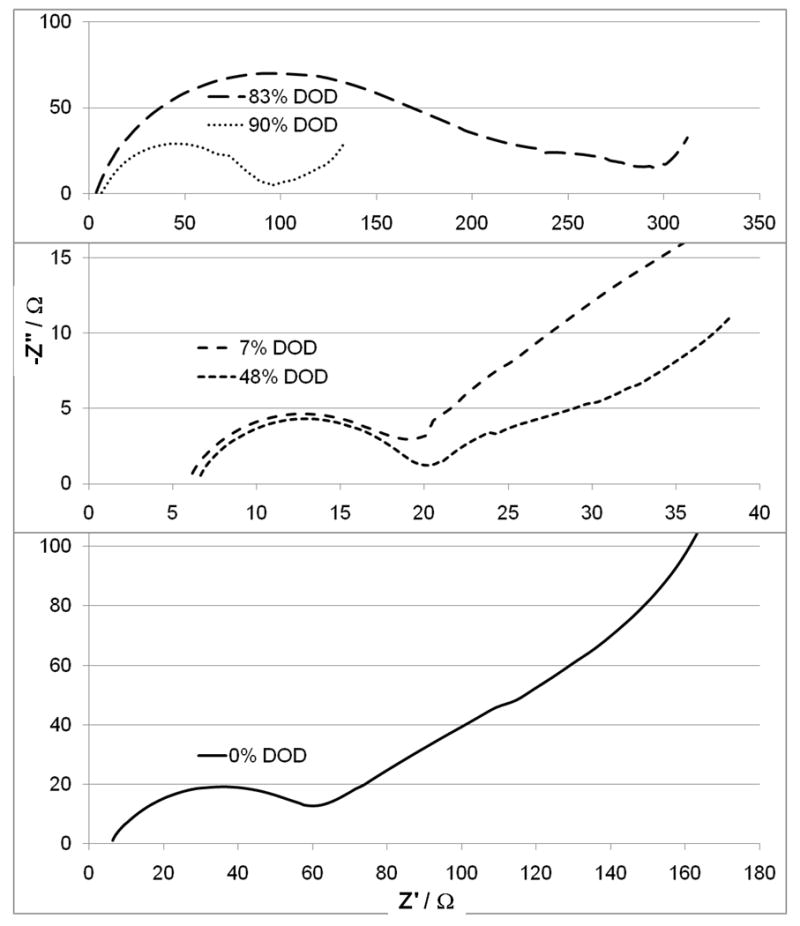
Cell AC impedance for lithium anode / SVPO composite cathode cells at 0, 7, 48, 83 and 90% depth of discharge.
Figure 6.
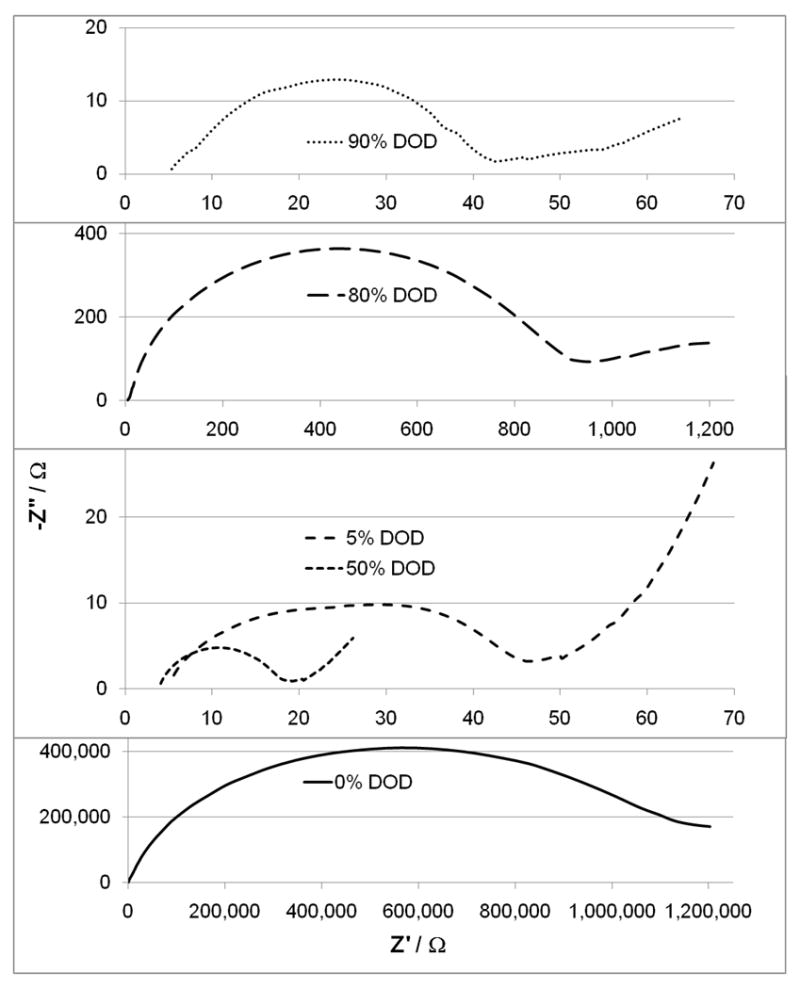
Cell AC impedance for lithium anode / SVPO only cathode cells at 0, 5, 50, 80 and 90% depth of discharge.
In order to further probe the impedance and quantify the results, simple equivalent circuits were used to fit the recorded cell AC impedance data. For the cells with SVPO composite electrodes, a simple circuit using a resistor, Rs, in series with a parallel combination of a constant phase element, CPE, and a resistor, Rp1, was used and is shown in Figure 7A at all levels of cell discharge. ZView software was used to mathematically fit the data. The sum of squares values for the simulation fit of the data were in the range of 0.01 to 0.09. The calculated Rs values remained fairly constant ranging from 3.8 to 8.2 ohms over the range 0 to 90% depth of discharge. R1 varied much more significantly as a function of depth of discharge ranging from low values of 9-11 ohms at 14 to 41% DOD to over 180 ohms at 83% DOD. As the cell discharge was continued, R1 decreased to ~ 80 ohms at 90% DOD. In order to allow comparison with calculated cell DC resistance, a total cell resistance value was calculated by summing Rs and R1 and is shown in Figure 8 versus depth of discharge and electron equivalents noted on the x axis. The calculated cell DC resistance from the discharge data is shown on the plot for comparison. Good agreement is noted between the two data sets both in trend and in total magnitude.
Figure 7.


Equivalent circuit diagrams used to fit the AC impedance data. A. Circuit used to fit lithium anode / SVPO composite cathode cells and lithium/SVPO only cathode cells at 10-80% depth of discharge. B. Circuit used to fit lithium anode / SVPO only cathode cells at 0-5% and 85-100% depth of discharge.
Figure 8.
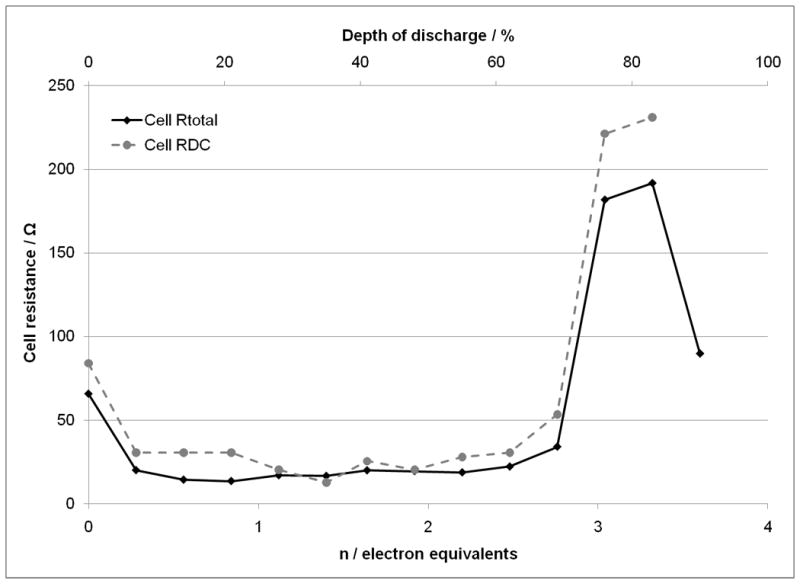
Comparison of calculated total cell DC resistance and Rtotal from cell AC impedance for lithium anode / SVPO composite cathode cells versus depth of discharge and electron equivalents.
The equivalent circuit fit for the Li/SVPO cells using pure SVPO cathode used the same circuit as the composite cathode cells from 10-80% depth of discharge as shown in Figure 7A. However, from ≤5% and 85-100% depth of discharge two distinct semicircular elements in the Z’ versus Z“ or Nyquist plots were observed. Therefore, a circuit with two parallel combinations of constant phase element and a resistor as shown in Figure 7B was used to fit the data. Thus, at the specified depths of discharge the circuit fits provide values for Rs, R1 and R2. In examining the trends over the course of cell discharge, Rs remained fairly constant ranging from 3.7 to 6.4 ohms over 2-100% depth of discharge. The contribution of R1 ranged from 2 to over 18 ohms. R2 ranged from 14 ohms to over 900 ohms over the depths of discharge. Values from 14 to 29 ohms were observed at depths of discharge from 5 to 60%. Past 60% DOD the value of R2 increased to a maximum of >900 ohms observed at 80% DOD and then decreased as cell discharge progresssed. In a similar fashion to the data analysis above, an Rtotal value was calculated by summing Rs, R1 and R2. Figure 9 shows the comparison of Rtotal to the cell DC resistance calculated from discharge data related to depth of discharge and electron equivalents. The correlation of the two data sets is strong both in magnitude and trend.
Figure 9.
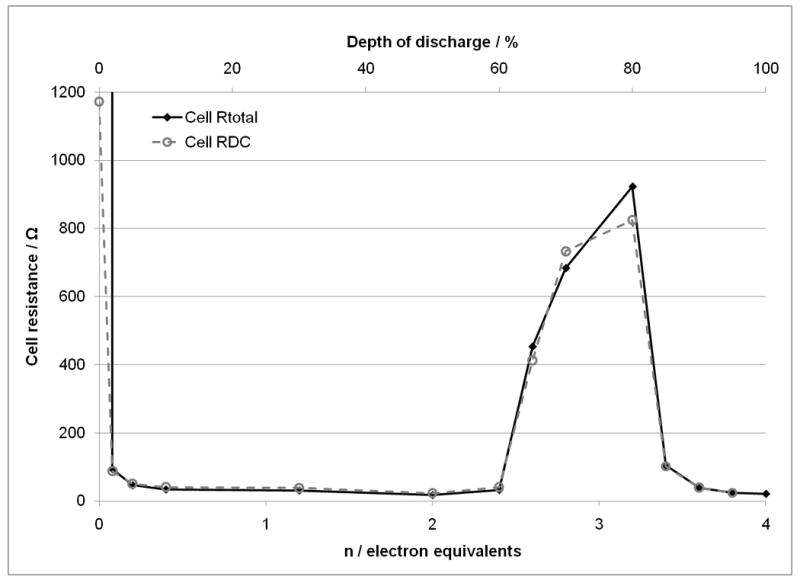
Comparison of calculated total cell DC resistance and Rtotal from cell AC impedance for lithium anode / SVPO only cathode cells versus depth of discharge and electron equivalents.
Analysis of Li/SVPO cell data shows a decrease in cell resistance as discharge is initiated. Since the mechanism of the cathode discharge has been determined to include the generation of silver metal due to the reduction of Ag+ to Ag0 during the discharge process,(33) there was interest in measuring the cathode conductivity directly. Cathodes were recovered from partially discharged cells where the individual cells had been discharged to a series of DODs. Once the cathodes were recovered, rinsed, and dried, four point probe conductivity measurements of the cathodes were conducted. The conductivity of each cathode was measured at five locations across the cathode. Composite cathodes were used for this portion of the study as the cathodes based on silver vanadium phosphorous oxide alone were too fragile for recovery and measurement. It should be noted that the cathodes did not incorporate grids of any kind, but were formed as free standing structures. Figure 10 shows the measured resistivity of the cathodes recovered from cells related to the electron equivalents of discharge. Note that the individual measurements are shown as open circles on the plot, the closed diamonds show the average value and the bars indicate the 95% confidence interval for the data set at each discharge point. The measured resistivity of the cathodes decreases for cathodes that have been reduced compared to the fresh cathodes. The resistivity reaches a minimum level at ~0.8 electron equivalents. The resistivity remains relatively constant until 2 electron equivalents have been transferred and then the resistivity begins to increase. The maximum average cathode resistivity was noted at approximately 3.2 electron equivalents. As the cathodes were discharged to approximately 3.8 electron equivalents, a decrease in the cathode resistivity was noted for this advanced state of discharge.
Figure 10.
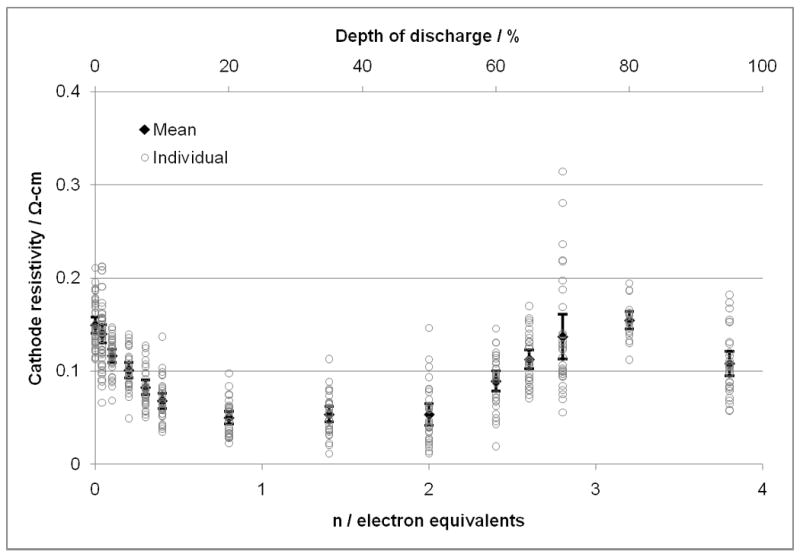
Cathode resistivity values for SVPO composite cathodes recovered from cells at various depths of discharge. Open circles show individual values. Closed diamond is the mean value for each group. 95% confidence intervals are indicated by the vertical lines terminated with horizontal marks.
4. DISCUSSION
The cathode reduction process of SVPO can be formally considered as described below (Scheme 1). For simplicity, the general notation LixAg2-xVO2PO4 is used when describing multiple levels of discharge. The notation LiyAg2-yVO2PO4 + yAg0 is used specifically for y < 2, and the notation LizVO2PO4 + 2Ag0 is used specifically for z > 2 to describe the reduced and lithiated material. This notation is described as a shorthand way of describing the material stoichiometry, and does not imply specific crystallographic phases.
Scheme 1.

Reduction of Ag2VO2PO4
The cell DC resistance values, cell AC impedance values and cathode conductivity measurements show clear trends linked to state of discharge. The data sets show substantial resistance decrease on initiation of cell discharge. The cell DC resistance and cell impedance remain relatively constant from approximately 10% to 50% DOD or 0.4 to 2.0 electron equivalents (Li0.4Ag2VO2PO4 → Li2.0Ag2VO2PO4). It is interesting to note that the measured cathode resistivity begins to rise after 50% DOD while the cell resistance is fairly stable until about 60% DOD. The overall correlation in the trends indicates that the cathode resistance is a major contributor to the cell DC resistance and AC impedance. There is then a significant increase in cell resistance between 60% and 80% DOD or 2.4 to 3.2 electron equivalents (Li2.4Ag2VO2PO4 → Li3.2Ag2VO2PO4). As the cells are discharged further, there is a decrease in cell resistance as the cells approach 90-100% DOD or 3.6 to 4.0 electron equivalents (Li3.6Ag2VO2PO4 → Li4.0Ag2VO2PO4). The trends in cell resistance are illustrated in Figures 8 and 9. The recorded cathode resistivity data are shown in Figure 10. Figure 11 provides an overlay of the average cathode resistivity values, the cell Rtotal from the AC impedance study, and the calculated cell DC resistance for the cells constructed using the composite SVPO cathodes. The general trends for the calculated cell DC resistance and AC impedance values and the resistivity values for the recovered cathodes are similar. Correlation between calculated cell DC resistance and measured cell AC impedance was noted for pure SVPO cathode cells as well as for cells with composite cathodes.
Figure 11.
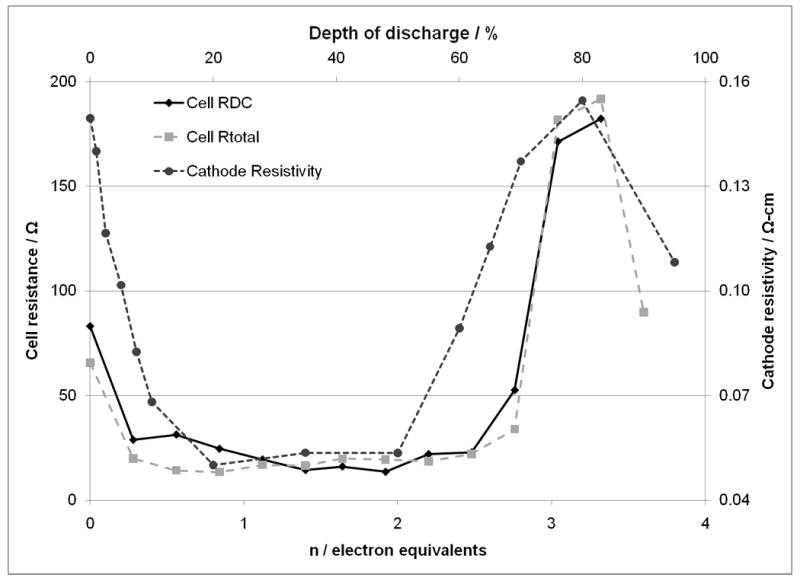
Cathode resistivity values, calculated cell DC resistance and Rtotal from cell AC impedance for lithium anode / SVPO composite cathode cells.
These results can be considered in relationship to the discharge process of the Ag2VO2PO4 cathode material. At the early stages of discharge there is a significant decrease in the cathode resistance which can be explained by the formation of a conductive silver metal network formed internal to the cathode enhancing the conductivity as a result of the silver ion reduction. At later stages of discharge, changes in vanadium oxidation state dominate, with an increase in cell resistance at end of discharge. XRD, SEM, and magnetic susceptibility measurements were used to probe changes in the cathode material during the reduction process, and the discharge mechanism is explored to rationalize the observed changes in cathode and cell resistance and impedance.
SVPO exhibits a layered structure as shown in Figure 1.(37) Vanadium-phosphorous-oxide layers are formed from dimers of edge-sharing vanadium oxide bioctahedra and phosphorous oxide tetrahedra. The edge-sharing Ag+ ions are located between the VPO layers, with distorted octahedral coordination. Ex-situ XRD measurements were used to monitor changes in the SVPO cathode material as a function of discharge, as shown in Figure 2. Upon discharge, the SVPO peak intensity decreases indicating an increase in amorphous character of the structure. In a similar fashion, in situ XRD measurements showed that the SVOF discharge process is accompanied by amorphization of the parent structure.(17) While the SVPO structure becomes more amorphous on discharge, no significant interlayer collapse of the vanadium-phosphorous-oxygen layer structure occurs. No significant constriction along the [400] direction was observed for SVPO upon discharge. In addition, no significant change in SVPO [001] interlayer spacing was observed, suggesting that the vanadium-phosphorous-oxide layers have a rigid structure that does not undergo interlayer collapse on discharge even with the exit of silver from the structure. This supports our hypothesis that the vanadium-phosphorous-oxide structure is a robust framework which provides a high level of structural stability. In contrast, SVO shows substantial constriction on discharge, corresponding to a 13% decrease in the interlayer spacing (d001) for three equivalents of Li+ (from AgV2O5.5 ! Li3AgV2O5.5).(39)
Upon initiation of discharge, formation of Ag0 is observed, as shown in Figure 2. Similar to SVO and SVOF, Ag0 formation was observed upon reduction. Ag0 crystallite size showed no significant change with SVPO discharge, with an average size of 6.7 nm. As discussed in our previous work, XRD indicates that some vanadium reduction initiates prior to the completion of the silver ion reduction for SVOP as the Ag0 peak intensity showed a linear increase beyond 2.0 electron equivalents Li2Ag2VO2PO4), up to 2.4 electron equivalents (Li2.4Ag2VO2PO4).(33) Partial reduction of V5+ in parallel with Ag+ was also reported for SVO, with chemical analysis by chemical titration(40) and Li-7 and V-51 NMR(11) studies of ex-situ SVO cathode material.
Note that the silver metal nanoparticles can also be observed by SEM on the surface of the particles. The image shown in Figure 12 is a sample SVPO only cathode from 20% depth of discharge, or 0.8 electron equivalents. The silver ions initially present in the SVPO structure, exit the structure and form nanodeposits on the particle surfaces, appearing as bright locations in the backscatter SEM image. As the reduction of the material progresses, additional silver metal sites are located on the particles. These silver metal sites form in sufficient quantity to form a conductive network in the cathode structure. This manifests as reduced cathode resistance as well as reduced cell resistance. Notably, a significant decrease in cell resistance is observable with 0.08 electron equivalents transferred. An increase in conductivity has been previously reported for the SVPO system(33) as well as for the related lithium/silver vanadium oxide, Ag2V4O11, system(13) due to the formation of silver nanowires and nanoparticles as the discharge initiates.
Figure 12.
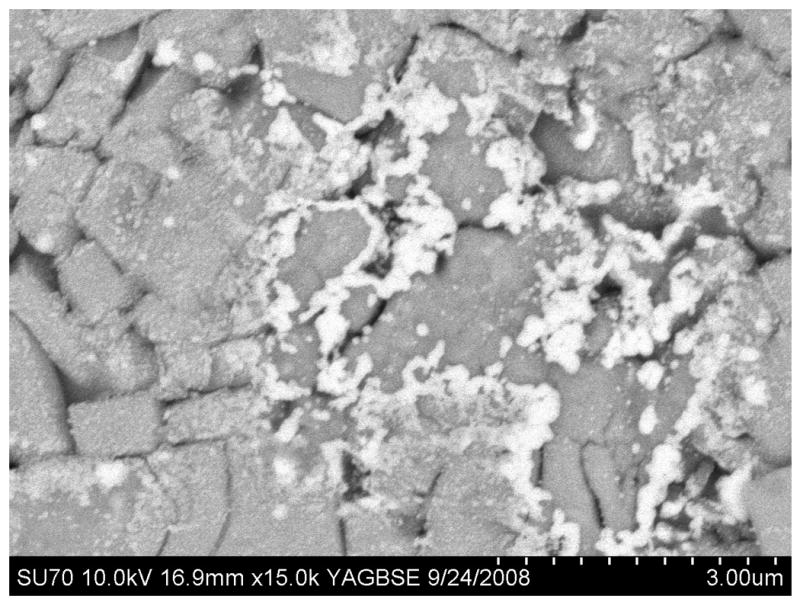
Scanning electron micrograph of SVPO cathode recovered from 20% depth of discharge cell.
As the cells reach 50% discharge, the majority of the silver ion has been reduced and it would be expected that the major reduction process shifts from the reduction of silver ion to silver metal to the reduction of vanadium, V5+ to V4+. As the cathode reduction progresses to 75% depth of discharge, the reduction of V4+ to V3+ will also be taking place. Of further interest in the data reported here is the observation that both the cathode and accompanying cell resistance rise as the cells reach 50% to 60 % discharge. The significant rise in cell resistance begins in the region where the cathode reduction mechanism is shifting from primarily the reduction of silver ion (Ag+) to silver metal (Ago) to the reduction of the vanadium centers.
Previous studies have reported the AC impedance of LixV2O5 cathode containing cells.(41, 42) The authors noted that the cell resistance was consistently lower for fully charged cells versus discharged cells. The authors also investigated the discharge process by 51V NMR and reported that the discharge process took place with lithiation of the vanadium oxide and reduction of V5+ to V4+ and some amount of V4+ to V3+. While the authors did not report a detailed study of the cathode or cell resistance as a function of depth of discharge, their observations are consistent with the cell resistance rise on reduction of vanadium reported here. Recently, studies of Li3V2(PO4)3 have been reported.(43, 44) Tang reports the cell AC impedance of Li3V2(PO4)3 containing cells as a function of cell voltage and also notes a relationship of impedance with state of charge.(43) Rui reports the cell resistance of Li3V2(PO4)3 on charge and discharge and noted that the cell resistance changes with the state of charge with several increasing and decreasing resistances noted as a function of cell voltage.(44) Interestingly, Rui reports an increase in DC cell resistance on initial discharge of the of Li3V2(PO4)3 cathode material with subsequent decrease and increase stages. In the Li/SVPO case under study here, as the silver vanadium phosphorous oxide reduction process progresses to the reduction of vanadium, both the cell and cathode resistances increase. These observations are consistent with those observed in the reduction of vanadium oxides and by Rui in the study of Li3V2(PO4)3 who note the resistance increases with the initial reduction of vanadium (V5+).
Thus, the observed changes in cell and cathode resistance can be rationalized as follows. Initial reduction of the Ag2VO2PO4 cathode material involves the reduction of Ag+ to silver metal, Ag0 and is accompanied by decreases in the cathode and cell resistances. Some reduction of V5+ occurs in parallel with Ag+ reduction. Since the paramagnetic character of the SVPO increases upon vanadium discharge, ex-situ magnetic susceptibility measurements of the SVPO cathode material were collected. Upon reduction from V5+ → V4+ → V3+ the vanadium d electron configuration changes from d0 → d1 → d2, while reduction from Ag+ → Ag0 has no significant change, retaining a d10 electron configuration. Therefore, magnetic susceptibility measurements should provide evidence of changes in vanadium oxidation state in the presence of the silver reduction process. However, the physical properties of vanadium oxides(45, 46) such as NaVO2 and vanadium phosphates(47) such as Ag2VOP2O7 have been the subject of recent study, and it has been observed that the magnetic susceptibilities of V3+ and V4+ oxides and phosphates are approximately one half those anticipated from simple spin only calculations, likely due to partial V – V communication through O or O-P-O.
Given the above limitations, we have observed that our magnetic susceptibility data is consistent with our XRD observations regarding the discharge of SVPO. A regular increase in magnetic susceptibility was observed upon discharge of SVPO, as shown in Figure 3. If the Ag+ reduced fully prior to the V5+ reduction, then no significant magnetic susceptibility changes would be anticipated on initial reduction from 0 to 2 electron equivalents (Ag2VO2PO4 → Li2Ag2VO2PO4). However, the data shows > 400 fold increase in magnetic susceptibility in this range. Thus, the magnetic susceptibility data supports our hypothesis that some reduction of V5+ occurs in parallel with the Ag+ reduction with the magnitudes of our magnetic susceptibility data being consistent with the above cited vanadium oxide and vanadium phosphate observations. Finally, the oxidation state of vanadium in SVPO changes most significantly when the reduction of Ag+ is no longer the dominant process.
Once the cells have reached about 10% depth of discharge or 0.08 electron equivalents, where approximately 20% of the Ag+ sites have been reduced, the cell resistance remains relatively constant until reaching approximately 50 to 60% depth of discharge. During the 10-50% discharge, the dominant process is the reduction of silver and the majority of the silver ions would be reduced by the transfer of 2 electron equivalents. Once the cells have transferred two electron equivalents and have reached ~50% depth of discharge, reduction of V5+ to V4+ becomes the dominant discharge process. At this stage of discharge, a notable increase in cell resistance takes place with a maximum noted at ~3.2 electron equivalents or 80% depth of discharge. As the cell discharge continues to >85% depth of discharge or greater than 3.4 electron equivalents, a decrease in cell resistance is noted. At this depth of discharge, the dominant discharge process is consistent with the reduction of V4+ to V3+. Thus, the resistance trends of the cells correlate with the depth of discharge and can be rationalized by analysis of the discharge process of the active cathode material, Ag2VO2PO4.
5. SUMMARY
This study reports the investigation of SVPO cathode electrical conductivity and the associated lithium cell resistance as a function of electrochemical reduction over the range of 0 to 4 electron equivalents per formula unit. The cell DC resistance values, cell AC impedance values and cathode electrical conductivity measurements show clear trends linked to the level of reduction. In considering the SVPO cathode electrochemical reduction mechanism, the initial dominant process is reduction of Ag+ to Ag0 for a theoretical total of 2 electrons per formula unit, or 50% of the calculated theoretical value of 4 electrons per formula unit. In a parallel reaction, some reduction of V5+ to V4+ also takes place. As the reduction progresses, V4+ to V3+ is also observed. At early stages of cathode reduction there is a significant decrease in the cathode electrical resistance due to the formation of a conductive silver metal matrix forming within the SVPO cathode, thereby enhancing SVPO electrical conductivity. Once the SVPO electrochemical reduction process progresses to the reduction of vanadium (V5+) to (V4+) as the dominant process, both the cell and cathode electrical resistances begin to increase. If the discharge continues to the stage where the dominant cathode reduction process is the reduction of vanadium (V4+) to (V3+), the cathode and cell electrical resistances then begin to decrease. Since the electrical resistance of cathode materials is a critical factor in lithium cell performance factors, interpreting complex patterns of changes in SVPO cathode electrical resistance to chemical changes incurred during the electrochemical reduction of SVPO allows a more sophisticated and accurate prediction of lithium cell performance, and greater chemical insight into the relationships among cathode chemical compositions, electrical resistance, and cell performance.
Acknowledgments
This project was supported by the New York State Foundation for Science, Technology, and Innovation, the University at Buffalo (SUNY), and the National Institutes of Health under Grant 1R01HL093044-01A1 from the National Heart, Lung, and Blood Institute.
Footnotes
Publisher's Disclaimer: This is a PDF file of an unedited manuscript that has been accepted for publication. As a service to our customers we are providing this early version of the manuscript. The manuscript will undergo copyediting, typesetting, and review of the resulting proof before it is published in its final citable form. Please note that during the production process errors may be discovered which could affect the content, and all legal disclaimers that apply to the journal pertain.
References
- 1.Takeuchi ES. Reliability systems for implantable cardiac defibrillator batteries. J Power Sources. 1995;54:115–119. [Google Scholar]
- 2.Takeuchi KJ, Marschilok AC, Davis SM, Leising RA, Takeuchi ES. Silver vanadium oxides and related battery applications. Coordination Chemistry Reviews. 2001;219-221:283–310. [Google Scholar]
- 3.Anguchamy YK, Lee J-W, Popov BN. Electrochemical performance of polypyrrole/silver vanadium oxide composite cathodes in lithium primary batteries. J Power Sources. 2008;184:297–302. [Google Scholar]
- 4.Chen K, Merritt DR, Howard WG, Schmidt CL, Skarstad PM. Hybrid cathode lithium batteries for implantable medical applications. J Power Sources. 2006;162:837–840. [Google Scholar]
- 5.Takeuchi ES, Quattrini PJ, Greatbatch W. Lithium/silver vanadium oxide batteries for implantable defibrillators. Pacing Clin Electrophysiol. 1988;11:2035–2039. doi: 10.1111/j.1540-8159.1988.tb06346.x. [DOI] [PubMed] [Google Scholar]
- 6.Takeuchi ES, Zelinsky MA, Keister P. High rate capability of lithium/silver vanadium oxide cells. Proc Int Power Sources Symp 32nd. 1986:268–273. [Google Scholar]
- 7.Holmes CF, Keister PP, Takeuchi ES. High-rate lithium solid cathode battery for implantable medical devices. Prog Batteries Sol Cells. 1987;6:64–66. [Google Scholar]
- 8.Takeuchi KJ, Leising RA, Palazzo MJ, Marschilok AC, Takeuchi ES. Advanced lithium batteries for implantable medical devices: mechanistic study of SVO cathode synthesis. Journal of Power Sources. 2003;119-121:973–978. [Google Scholar]
- 9.Takeuchi KJ, Marschilok AC, Takeuchi ES. In: Vanadium: Chemistry, Biochemistry, Pharmacology and Practical Applications. Tracey AS, Willsky GR, Takeuchi ES, editors. Taylor and Francis; New York: 2007. [Google Scholar]
- 10.Takeuchi ES, Leising RA. Lithium batteries for biomedical applications. Material Research Society Bulletin. 2002;27:624–627. [Google Scholar]
- 11.Leifer ND, Colon A, Martocci K, Greenbaum SG, Alamgir FM, Reddy TB, Gleason NR, Leising RA, Takeuchi ES. Nuclear Magnetic Resonance and X-Ray Absorption Spectroscopic Studies of Lithium Insertion in Silver Vanadium Oxide Cathodes. J Electrochem Soc. 2007;154:A500–A506. [Google Scholar]
- 12.Takeuchi ES, Thiebolt WC., III The reduction of silver vanadium oxide in lithium/silver vanadium oxide cells. J Electrochem Soc. 1988;135:2691–2694. [Google Scholar]
- 13.Sauvage F, Bodenez V, Vezin H, Morcrette M, Tarascon J-M, Poeppelmeier KR. Structural and transport evolution in the LixAg2V4O11 system. Journal of Power Sources. 2010;195:1195–1201. [Google Scholar]
- 14.Gleason RAL Nancy R, Palazzo Marcus, Takeuchi Esther S, Takeuchi Kenneth J. Talk #248 - Microscopic Study of the First Voltage Plateau in the Discharge of SVO and the Consequences on Electronic Conductivity. 208th Meeting of the Electrochemical Society. Session D2 - Rechargeable Lithium and Lithium-Ion Batteries - Battery/Energy Technology; Friday, October 1 2005. [Google Scholar]
- 15.Ramasamy RP, Feger C, Strange T, Popov BN. Discharge characteristics of silver vanadium oxide cathodes. J Appl Electrochem. 2006;36:487–497. [Google Scholar]
- 16.Sorensen EM, Izumi HK, Vaughey JT, Stern CL, Poeppelmeier KR. Ag4V2O6F2: An electrochemically active and high silver density phase. Journal Of The American Chemical Society. 2005;127:6347–6352. doi: 10.1021/ja050150f. [DOI] [PubMed] [Google Scholar]
- 17.Sauvage F, Bodenez V, Vezin H, Albrecht TA, Tarascon J-M, Poeppelmeier KR. Ag4V2O6F2 (SVOF): A high silver density phase and potential new cathode material for implantable cardioverter defibrillators. Inorganic Chemistry. 2008;47:8464–8472. doi: 10.1021/ic800793e. [DOI] [PubMed] [Google Scholar]
- 18.Albrecht TA, Sauvage F, Bodenez V, Tarascon J-M, Poeppelmeier KR. Room temperature synthesis of the larger power, high silver density cathode material Ag4V2O6F2 for implantable cardioverter defibrillators. Chemistry of Materials. 2009;21:3017–3020. [Google Scholar]
- 19.Delmas C, Maccario M, Croguennec L, Le Cras F, Weill F. Lithium deintercalation in LiFePO4 nanoparticles via a domino-cascade model. Nature Materials. 2008;7:665–671. doi: 10.1038/nmat2230. [DOI] [PubMed] [Google Scholar]
- 20.Yang H, Wu X-L, Cao M-H, Guo Y-G. Solvothermal Synthesis of LiFePO4 Hierarchically Dumbbell-Like Microstructures by Nanoplate Self-Assembly and Their Application as a Cathode Material in Lithium-Ion Batteries. Journal of Physical Chemistry C. 2009;113:3345–3351. [Google Scholar]
- 21.Chang C, Xiang J, Shi X, Han X, Yuan L, Sun J. Hydrothermal synthesis of carbon-coated lithium vanadium phosphate. Electrochimica Acta. 2008;54:623–627. [Google Scholar]
- 22.Zhou X, Liu Y, Guo Y. One-step synthesis of Li3V2(PO4)3/C positive material with high performance for lithium-ion batteries. Solid State Communications. 2008;146:261–264. [Google Scholar]
- 23.Li Z, Zhang D, Yang F. Developments of lithium-ion batteries and challenges of LiFePO4 as one promising cathode material. Journal of Materials Science. 2009;44:2435–2443. [Google Scholar]
- 24.Liao X-Z, Ma Z-F, He Y-S, Zhang X-M, Wang L, Jiang Y. Electrochemical Behavior of LiFePO4/C Cathode Material for Rechargeable Lithium Batteries. Journal of the Electrochemical Society. 2005;152:A1969–A1973. [Google Scholar]
- 25.Song YN, Zavalij PY, Whittingham MS. epsilon-VOPO4: Electrochemical synthesis and enhanced cathode behavior. Journal Of The Electrochemical Society. 2005;152:A721–A728. [Google Scholar]
- 26.Franger S, Bourbon C, Le Cras F. Optimized lithium iron phosphate for high-rate electrochemical applications. Journal of the Electrochemical Society. 2004;151:A1024–A1027. [Google Scholar]
- 27.Martha SK, Markovsky B, Grinblat J, Gofer Y, Haik O, Zinigrad E, Aurbach D, Drezen T, Wang D, Deghenghi G, Exnar I. LiMnPO4 as an Advanced Cathode Material for Rechargeable Lithium Batteries. Journal of the Electrochemical Society. 2009;156:A541–A552. [Google Scholar]
- 28.Gaubicher J, Mercier TL, Chabre Y, Angenault J, Quarton M. Li/beta -VOPO4: a new 4V system for lithium batteries. Journal of the Electrochemical Society. 1999;146:4375–4379. [Google Scholar]
- 29.Tarascon JM, Armand M. Issues and challenges facing rechargeable lithium batteries. Nature. 2001;414:359–367. doi: 10.1038/35104644. [DOI] [PubMed] [Google Scholar]
- 30.Amine K, Yasuda H, Yamachi M. Olivine LiCoPO4 as 4.8 V electrode material for lithium batteries. Electrochemical and Solid-State Letters. 2000;3:178–179. [Google Scholar]
- 31.Huang H, Yin SC, Nazar LF. Approaching theoretical capacity of LiFePO4 at room temperature at high rates. Electrochemical and Solid-State Letters. 2001;4:A170–A172. [Google Scholar]
- 32.Marschilok AC, Takeuchi KJ, Takeuchi ES. Preparation and Electrochemistry of Silver Vanadium Phosphorous Oxide, Ag2VO2PO4. Electrochemical and Solid-State Letters. 2008;12:A5–A9. [Google Scholar]
- 33.Takeuchi ES, Marschilok AC, Tanzil K, Kozarsky ES, Zhu S, Takeuchi KJ. Electrochemical Reduction of Silver Vanadium Phosphorus Oxide, Ag2VO2PO4: The Formation of Electrically Conductive Metallic Silver Nanoparticles. Chemistry of Materials. 2009;21:4934–4939. doi: 10.1021/cm902102k. [DOI] [PMC free article] [PubMed] [Google Scholar]
- 34.Kang HY, Wang SL, Tsai PP, Lii KH. Hydrothermal synthesis, crystal structure and ionic conductivity of silver vanadium oxide phosphate, Ag2VO2PO4: a new layered phosphate of vanadium(V) Journal of the Chemical Society Dalton Transactions: Inorganic Chemistry (1972-1999) 1993:1525–1528. [Google Scholar]
- 35.Schroder DK. Semiconductor Material and Device Characterization. John Wiley and Sons; New York: 2006. [Google Scholar]
- 36.A J Uhlir. The potentials of infinite systems of sources and numerical solutions of problems in semiconductor engineering. Bell System Technical Journal. 1955;34:105–128. [Google Scholar]
- 37.Ag2VO2PO4 FIZ73580
- 38.Figgis BN, Nyhlom RS. A convenient solid for calibration of a the Gouy magnetic susceptibility balance. Journal of the Chemical Society. 1958:4190–4191. [Google Scholar]
- 39.Leising RA, Thiebolt WC, III, Takeuchi ES. Solid-State Characterization of Reduced Silver Vanadium Oxide from the Li/SVO Discharge Reaction. Inorg Chem. 1994;33:5733–5740. [Google Scholar]
- 40.Leising RA, Thiebolt WC, Takeuchi ES. Solid-State Characterization Of Reduced Silver Vanadium-Oxide From The Li/SVO Discharge Reaction. Inorganic Chemistry. 1994;33:5733–5740. [Google Scholar]
- 41.Moss PL, Fu R, Au G, Plichta EJ, Xin Y, Zheng JP. Investigation of cycle life of Li-LixV2O5 rechargeable batteries. Journal of Power Sources. 2003;124:261–265. [Google Scholar]
- 42.Zheng ZP, Moss PL, Fu R, Ma Z, Xin Y, Au G, Plichta EJ. Capacity degradation of lithium rechargeable batteries. Journal of Power Sources. 2005;146:753–757. [Google Scholar]
- 43.Tang A, Wang X, Xu G, Zhou Z, Nie H. Determination of the chemical diffusion coefficient of lithium in Li3V2(PO4)3. Materials Letters. 2009;63:1439–1441. [Google Scholar]
- 44.Rui XH, Li C, Chen CH. Synthesis and characterization of carbon-coated Li3V2(PO4)3 cathode materials with different carbon sources. Electrochimica Acta. 2009;54:3374–3380. [Google Scholar]
- 45.McQueen TM, Stephens PW, Huang Q, Klimczuk T, Ronning F, Cava RJ. Successive orbital ordering transitions in NaVO2. Physical Review Letters. 2008;101:164402–164401. 164402–164404. doi: 10.1103/PhysRevLett.101.166402. [DOI] [PubMed] [Google Scholar]
- 46.Chamberland BL, Porter SK. A study on the preparation and physical property determination of NaVO2. Journal of Solid State Chemistry. 1988;73:398–404. [Google Scholar]
- 47.Tsirlin AA, Nath R, Geibel C, Rosner H. Magnetic properties of Ag2VOP2O7: An unexpected spin dimer system. Physical Review B. 2008;77:104436–104431. 104436–104437. [Google Scholar]


