

Abstract
Background
Endoventricular patch plasty (Dor) is used to reduce left ventricular (LV) volume after myocardial infarction (MI) and subsequent LV remodeling.
Methods and Results
End-diastolic and end-systolic pressure volume and Starling relationships were measured and magnetic resonance (MRI) images with non-invasive tags used to calculate 3D myocardial strain in six sheep 2 weeks before, and 2 and 6 weeks after the Dor procedure. These experimental results were previously reported.
The imaging data from one sheep was incomplete. Animal specific finite element (FE) models were created from the remaining five animals using MRI images and LV pressure obtained at early diastolic filling. FE models were optimized using 3D strain and used to determine systolic material properties, Tmax,skinned-fiber, and diastolic and systolic stress in remote myocardium and borderzone (BZ).
Six weeks after Dor procedure, end-diastolic and end-systolic stress in the BZ were substantially reduced. However, although there was a slight increase in Tmax,skinned-fiber in the BZ near the MI at 6 weeks, the change was not significant.
Conclusions
The Dor procedure decreases end-diastolic and end-systolic stress but fails to improve contractility in the infarct BZ. Future work should focus on measures that will enhance BZ function alone or in combination with surgical remodeling.
Keywords: Myocardial Infarction, Remodeling, Dor procedure, Restoration, Strain, Stress, Finite Element
Introduction
Initially described by Dor in 1989 1, endoventricular patch plasty (Dor procedure) is used to reduce left ventricular (LV) volume after myocardial infarction (MI) and subsequent LV remodeling. Briefly, the infarct is incised and a purse-string suture (Fontan stitch) used to reduce the circumference of the aneurysm “neck.” A patch of either autologous or synthetic material is then sewn to the edge of the aneurysm neck thereby reducing LV volume. 1
The Dor procedure can be performed safely. 2, 3 However, the NIH-sponsored Surgical Treatment for Ischemic Heart failure (STICH) trial recently found no difference in composite outcome between coronary bypass (CABG) and CABG plus Dor procedure. 4 The authors speculated that improved systolic function was balanced by worsened diastolic function. 4 On the other hand, even if pump function is not improved, the Dor procedure may have important effects on stress, strain and contractility in the infarct borderzone (BZ).
It has been known since the mid 1980s that systolic function (systolic shortening and wall thickening) is depressed in the non-ischemic infarct borderzone. 5 It was initially thought that reduced borderzone shortening was due to mechanical tethering (high systolic stress) by the infarct. To better clarify the cause, we previously created a finite element model of the LV that was based on magnetic resonance imaging (MRI) data obtained after anteroapical MI in sheep. 6, 7 Model output was optimized by comparing strain predicted by the model with strain measured using MRI. Surprisingly, the finite element simulations showed that BZ contractility was significantly depressed. Specifically, BZ contractility was found to be 50% of that in the remote uninfarcted myocardium. 6
It has been suggested that the Dor procedure reduces borderzone stress and strain and as a consequence BZ contractility would improve. 8 The primary goal of the present study was, therefore, to quantify the effect of the Dor procedure on BZ contractility and stress using MRI based finite element models. We tested the hypothesis that the Dor procedure will decrease diastolic and systolic stress and increase regional myocardial contractility in the infarct BZ in sheep.
Material and Methods
Experimental Measurements
End-diastolic and end-systolic pressure volume and Starling relationships were measured 9 and magnetic resonance (MRI) images with non-invasive tags used to calculate 3D myocardial strain 10 in six sheep 2 weeks before, and 2 and 6 weeks after the Dor procedure. These experimental results were previously reported.
Specifically, an elliptical Dacron patch was fashioned so that the major and minor axes were 50% of the corresponding infarct neck on magnetic resonance imaging (MRI). An incision was made in the apical infarct, and the transition between infarcted aneurysm and uninfarcted myocardium was determined by inspection and palpation. The patch was positioned parallel to the septum and sutured to the line of transition with interrupted 2-0 Ethibond Excel suture (Ethicon, Somerville, NJ). All dyskinetic portions of the anterior wall and septum were excluded. 9
Previously reported end-diastolic and end-systolic pressures and volumes are seen in Table 1. 9 Representative long axis magnetic resonance imaging (MRI) images before and after Dor procedure are seen in Figure 1. 10
Table 1.
Effect of Dor procedure on LV pressure and volume. Values are mean ± standard deviation. LVP = left ventricular pressure; EDV = end-diastolic volume; ESV = end-systolic volume; SV = stoke volume; EF = ejection fraction
| Pre-Dor | Two weeks Post-Dor | Six weeks Post-Dor | |
|---|---|---|---|
| LVP at ED (mmHg) | 8.9±5.5 | 17.5±5.6* | 10.5±3.9 |
| LVP at ES (mmHg) | 96.2±23.2 | 105.7±20.0 | 123.2±19.4 |
| EDV (mL) | 161.6±37.1 | 104.1±29.2* | 101.3±22.2* |
| ESV (mL) | 130.1±36.0 | 68.0±29.5* | 66.3±14.3* |
| SV (mL) | 31.5±9.4 | 31.9±13.9 | 35.0±10.8 |
| EF (%) | 20.6±8.1 | 33.0±11.0 | 34.4±7.1* |
P < 0.05 two and six week Dor versus pre-Dor.
P < 0.05 two week Dor versus six week Dor.
Figure 1.
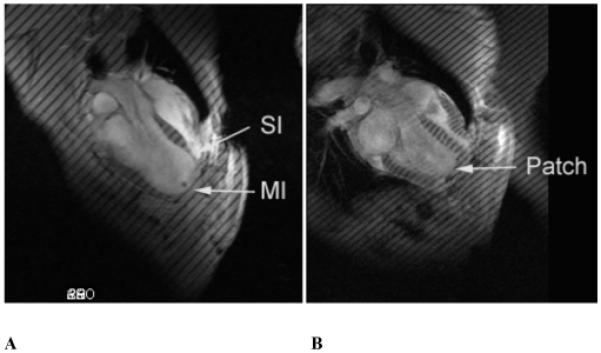
Long axis MR images (A) post-MI and (B) 2 weeks post-Dor in sheep. MI=dykinetic infarct; SI=septal infarct. All images were obtained at end-systole.
FE Model
The imaging data from one sheep was incomplete. Animal specific finite element (FE) models were created from the remaining five animals using MRI images and LV pressure obtained at early diastolic filling. A flow chart of overall FE/material property optimization method is seen in Figure 2.
Figure 2.
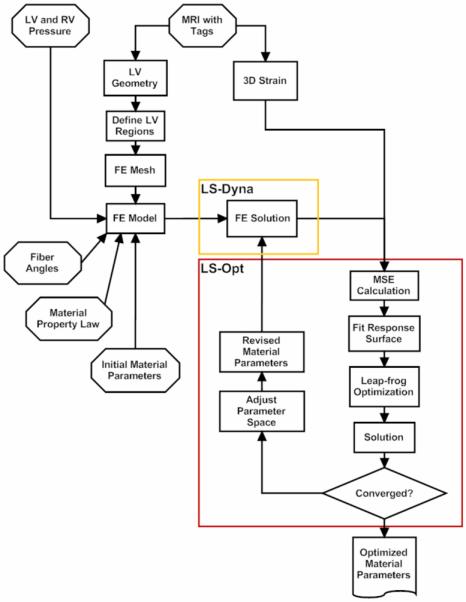
Flow chart of finite element/ material property optimization method.
The BZ infarct intersection was defined manually. The remote BZ intersection was defined as the point where the wall thickness is 70% of the maximum wall thickness and the intersection between intermediate BZ (BZ1) and BZ near MI (BZ2) was mid way between the BZ infarct and remote BZ intersections.
From the LV contours, surface meshes were created to replicate the in-vivo geometry (Rapidform, INUS Technology, Inc., Sunnyvale, CA). The spaces between the endocardium and epicardium surfaces were filled with 8-noded brick elements, each with a single integration point, to generate a volumetric mesh that is 3 element thick transmurally and has a different material for each of the 4 regions (Truegrid, XYZ Scientific Applications, Inc., Livermore, CA). Representative surface and FE meshes are seen in Figure 3.
Figure 3.

Finite element model of the LV with anteroapical MI. Animal specific contours were generated from MRI (A). Solid mesh (B) was broken into four regions (green = remote, brown = BZ1 (intermediate), red = BZ2 (near MI), blue = MI) defined by wall thickness. Long-axis cross-section (C) at end-systole six-weeks post-Dor in a typical sheep (yellow = patch).
Cardiac myofiber angles of −37°, 23° and 83° were assigned at the epicardium, midwall and endocardium, respectively, in the remote and borderzone regions 11. At the aneurysm region, fiber angles were set to 0° in order to use experimentally determined aneurysm material parameters with respect to this direction 12. Nodes at the LV base were only allowed to move in the plane of the LV base and basal epicardial nodes were fixed. The LV endocardial surface was loaded to the measured in-vivo end-diastolic and end-systolic LV pressures.
Material parameters
Passive 13 and active myocardial 14 material property laws (see Appendix) were implemented using a user-defined material subroutine in the explicit FE solver, LS-DYNA (Livermore Software Technology Corporation, Livermore, CA).
Diastolic materials parameters, bf, bt and bfs, were set to the average optimized values for sheep obtained previously from Walker et al. 7: bf = 49.25, bt = 19.25, bfs = 17.44. C in the remote myocardium was determined so that the calculated end-diastolic LV volume matched the measured value. For the Pre-Dor models, C in the aneurysm region was defined as 10 times stiffer than that in the remote. 15 The patch was assumed to be isotropic and made of a very stiff material, with Young’s modulus = 10 GPa and Poisson’s ratio = 0.3.
The material constants for active contraction were found to be 16: Ca0 = 4.35 μmol/L, (Ca0)max = 4.35 μmol/L, B = 4.75 μm−1, l0 = 1.58 μm, m = 1.0489 sec μm−1, b = −1.429 sec, and lR was set at 1.85 μm, the sacromere length in the unloaded configuration. Based on the biaxial stretching experiments 17 and FE analyses 7, 18, cross-fiber, in-plane stress equivalent to 40% of that along the myocardial fiber direction was added.
Material parameter optimization
The commercial FE optimization software, LS-OPT (Livermore Software Technology Corporation, Livermore, CA), was used to find the optimum systolic material properties in remote myocardium and the BZ. 19 FE simulations were performed and the mean square errors (MSE) for all points were calculated. The MSE is defined as the difference between the computed FE and experimental results (end-diastolic and end-systolic volumes and strains).
| (1) |
where n is the in-vivo strain point, N is the total number of in-vivo strain point, Eij,S is the computed FE strains at each strain point, VED and VSD are the computed FE end-diastolic and end-systolic LV volumes, respectively. The overbar represents experimental in-vivo measurements. Strain in the radial direction, E33, is excluded as it cannot be measured with sufficiency accuracy with tagged MR images. 20, 21 The goal of the optimization is to minimize the MSE.
Since tagged MR images were acquired during systole, only systolic myocardial strains could be determined. This meant that only systolic material parameters, Tmax_twitch in remote (Tmax_twitch_R) and BZ regions (Tmax_twitch_intermediate and Tmax_twitch_nearMI), could be optimized. Tmax_twitch in the aneurysm region was set to zero as the coronary ligations were permanently put in place to create dyskinetic infarcts. Initial ranges for Tmax_R were between 0.1 and 1000.0 kPa, and between 0.1 and 500.0 kPa for Tmax_B.
Statistical analysis
All values are expressed as mean ± standard deviation (SD) and compared by repeated measures analysis using a mixed model to test for both fixed and random effects. We performed the analysis using SAS PROC MIXED (SAS system for Windows Version 9.1, SAS Institute, Cary, NC) which uses a maximum likelihood or restricted maximum likelihood estimation technique as opposed to ordinary least squares. As a consequence, subjects with missing data were not automatically deleted from the analysis. Also, variables can be either continuous or categorical and relationships between the variables can be linear or curvilinear since the mixed model does not assume a normal distribution. 22 The statistical model was as follows:
| (2) |
where Difference = difference between pre- and post-operative values, Zone is the different regions (remote and 2 separate BZ regions). As can be seen, the difference between pre- and post-treatment strain was used as the dependent variable and absolute pre-treatment strain was used as a covariate. 23 A similar statistical model was use to determine changes in fiber stress. The statistical significance of individual group comparisons was tested using the Student t test. Due to the large number of between Zone comparisons, no multiple-comparison corrections were applied. Significance was set at p less than 0.05.
Results
All 5 infarcted sheep survived the Dor procedure and completed the entire protocol. Weight loss was minimal. Previously reported LV pressure and volume from these same animals are shown in Table 1. 9, 10 Two weeks postoperatively, the Dor procedure had a significant effect on end-diastolic pressure (P < .0475) and volume (P < .0027) and end-systolic volume (P < .0260). Six weeks postoperatively, the Dor procedure had a significant effect on end-diastolic (P < .0119) and end-systolic volume (P < .0072) and ejection fraction (P < .0058). There was no trend toward re-dilation: no significant difference in end-diastolic volume (P = .560) or end-systolic volume (P = .801) between 2 and 6 weeks after the Dor procedure. 9, 10
The reliability of the predictions from the 5 models was tested with a mesh convergence study to find the minimum number of elements needed to produce accurate results within the fastest computation time. The mesh convergence study determined that 2496 elements are required and further mesh refinement only results in a 1% change in strain prediction.
Figure 4 shows how MSE (normalized to MSE at iteration = 0) changes during the optimization. Table 2 documents the close agreement between measured and predicted circumferential strains and LV volume.
Figure 4.

Convergence of MSE during the optimization. MSE values are normalized to the starting MSE value for comparison.
Table 2.
Comparison between experimentally measured and finite element predicted volume and circumferential strain. Values are mean ± standard deviation. LV = left ventricle, ED = end-diastole, ES = end-systole, BZ = borderzone
| Experiment | Simulation | |
|---|---|---|
| LV Volume @ ED [ml] | 94.3±25.1 | 94.2±25.1 |
| LV Volume @ ES [ml] | 73.6±26.0 | 75.6±27.5 |
| Circumferential Strain | ||
| @ Base | −0.091±0.041 | −0.067±0.029 |
| @ Remote | −0.114±0.037 | −0.108±0.046 |
| @ BZ | −0.030±0.015 | −0.033±0.026 |
Figure 5 shows the effect of the Dor procedure on the optimum systolic material property. Panel A includes Tmax,twitch generated by the optimization routine. In panel B, values have been corrected so that they correspond to results of skinned fiber preparation (Tmax,skinned-fiber; Equation 5). Note the decrease in Tmax,skinned-fiber in remote myocardium, intermediate BZ and BZ near the MI (24.4, 73.9 and 78.5% respectively) 2 weeks after Dor. There was a slight increase in Tmax,skinned-fiber in the BZ near the MI at 6 weeks but the change was not significant.
Figure 5.


Calculated systolic material property, Tmax, after the Dor procedure. Panel A shows Tmax,twitch generated by the optimization routine. In panel B, values have been corrected so that they correspond to results of a skinned fiber preparation (Tmax,skinned-fiber; Equation 5). Note the decrease in Tmax in the infarct BZ. Also, there is an increase in BZ Tmax at 6 weeks but the change was not significant. Data is presented as mean ± standard deviation. * = p < 0.05
Figure 6 shows the effect of the Dor procedure on stress at end-diastole (A) and end-systole (B). Pre-Dor and 2 week post-Dor midwall fiber stress at end-diastole were similar. Note the decrease in midwall fiber stress at end-diastole in the intermediate BZ and BZ near the MI (56.0 and 60.1% respectively) between 2 and 6 weeks after Dor. Pre-Dor and 2 week post-Dor fiber stress distributions at end-systole are shown in long-axis cross-sections (Fig. 7).
Figure 6.


Effect of Dor procedure on fiber stress at end-diastole (A) and end-systole (B). Note the decrease in fiber stress in the infarct BZ. There was an overall effect of time and region but the change in BZ 2 was not significant. Data is presented as mean ± standard deviation. * = p < 0.05
Figure 7.
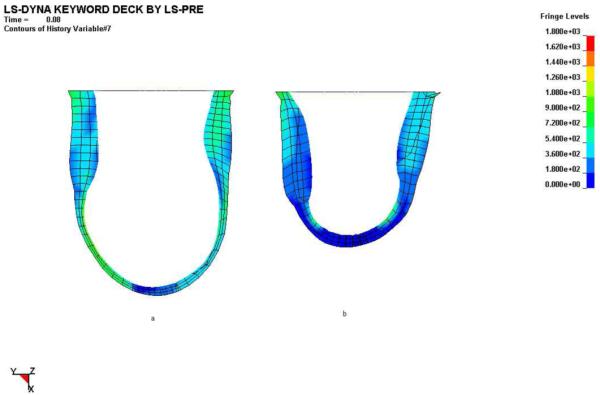
Effect of Dor procedure on longitudinal and transmural distributions of end-systolic myofiber stress pre-Dor (left) and six-weeks post-Dor (right) in a typical sheep (corresponds to Fig. 3c). Fringe levels are in units of hPa = 0.1 kPa = 0.1 mN/mm2. Note that stress concentrations (green surrounded by blue) in the subendocardium of the infarct BZ pre-Dor still remain six-weeks post-Dor. Additionally, wall thickening in the remote region six-weeks post-Dor is much greater than that pre-Dor. Finally, note that the end-systolic myocardial material properties are different between these two states separated by six weeks.
There was an overall reduction in midwall fiber stress at end-systole but only the decrease in midwall fiber stress at end-systole in the BZ near the MI (28.5%) between 2 and 6 weeks after Dor was significant.
Discussion
The primary finding of this study is that the Dor procedure decreases end-diastolic and end-systolic stress but fails to improve contractility in the infarct borderzone.
The STICH tial
The NIH-sponsored Surgical Treatment for Ischemic Heart failure (STICH) trial recently found no difference in composite outcome between coronary bypass (CABG) and CABG plus Dor procedure. 4 This corroborates previous mathematical simulation 24, 25 and animal studies 9 of the Dor procedure in which LV pump function failed to improve. In each case, a shift to the left of the end-systolic pressure volume relationship (PVR) was balanced or exceeded by a shift of the end-diastolic PVR. The resultant effect on pump function was neutral 9. However, even if the effect of Dor procedure on pump function is neutral, the Dor procedure might reduce borderzone stress and strain and as a consequence improve regional BZ contractility. 8
Calculation of myocardial material properties with the inverse finite element method
Moulton and colleagues were the first to show that material properties of passive, diastolic myocardium could be determined using the finite element method. 26 Moulton determined material parameters by minimizing the least squares difference between FE model-predicted and MRI-measured diastolic strain.
The gradient-free response surface optimization method (RSM) 27 used in this study achieved good agreement between calculated and measured strain has significant advantages. RSM has inherent noise-filtering properties 28 and should become popular for biomechanical design applications where the response can be highly nonlinear.
Interpretation of Tmax
In our mathematical model for active stress development in ventricular muscle 14, 29, Tmax is the isometric tension achieved at the longest sarcomere length and maximum peak intracellular calcium concentration. An alternative approach to changing border zone contractility using our mathematical model is to vary peak intracellular calcium concentration (Ca0). However, this also would change the shape of the active stress-sarcomere length relationship. 14 For simplicity, we only allowed the regional values of Tmax (and not Ca0) to be optimized to best fit myocardial strain measurements.
Kentish et al have shown that maximal force developed by skinned rat ventricular trabeculae at saturation levels of calcium concentration depends on sarcomere length. 30 In order to remove this load dependence, we define our index of contractility, Tmax, to be the maximal stress developed at the highest calcium concentration and the longest sarcomere length. Our stress-strain equations for systolic ventricular myocardium can accurately simulate the data measured by Kentish et al from rat ventricular trabeculae before the muscle were skinned with the detergent Triton X-100. 30
Contractility in the borderzone
As above, borderzone contractility is depressed after anteroapical MI. The cause is unclear but is probably initiated by high stress and strain in the borderzone myocardium. High systolic stress and positive strain in the BZ initiates myocyte apoptosis 31, 32 and activation of MMPs 2 and 9. 33, 34 Activated MMP2 has been shown to directly damage the intracellular contractile proteins myocin light chain 1 and troponin I. 35, 36
The LV wall is thin in the borderzone near to the infarct (BZ2). This is best seen in Figure 1. Wall thickness is a predictor of functional recovery in hibernating myocardium 37, 38 and that hibernating myocardium with an end-diastolic wall thickness less than 0.6 cm in humans is unlikely to recover. 38 However, the myocardium in peri-infarct borderzone in sheep has a normal blood supply. 8 Furthermore, contractile reserve in hibernating myocardium is inversely correlated with interstitial fibrosis 39 and, with the exception of a rim of borderzone immediately adjacent to the infarct, the infarct borderzone in sheep does not have increased interstitial fibrosis. For these reasons we believe that it is very reasonable to continue to look for medical and surgical therapies that increase BZ function.
In spite of stress reduction, our finite element-based calculations show that borderzone contractility is not improved after Dor procedure. We thought that 6 week post Dor would be sufficient for BZ recovery. However, long term observation after Dor procedure in this animal model may be necessary.
We tested the hypothesis that enhanced BZ contractility after Dor would improve LV function. Specifically, the Sheep 50 finite element model was re-run with Tmax,BZ = Tmax,Remote. Sheep 50 is illustrious since it was the animal with the lowest cardiac output after Dor. Figure 8 shows the effect of enhanced BZ contractility on EES and Starling’s law in Sheep 50. Note the significant increase in stroke volume at given LV pressure at end diastole.
Figure 8.

Effect of enhanced BZ contractility after Dor in Sheep 50 on end systolic elastance, EES, and Starlings law. Results were obtained by re-running the finite element analysis with Tmax, twitch in the BZ equal to that in the remote. LV = left ventricle, ED = end-diastole, ES = end-systole.
Contractility in the remote myocardium
In our first finite element modeling study of border zone contractility 6 we did not allow Tmax in the remote region to vary. Instead, we set Tmax = 81.4 kPa in the remote region at the end of isovolumic contraction and varied Tmax in the border zone region until our model simulation was able to reproduce experimentally observed stretching of border zone fibers during isovolumic systole. 40 Since in the present study we also had measurements of strain in the remote region, we allowed the value of Tmax in the remote region to be optimized as well in order to best fit these strain measurements. It is somewhat surprising that Tmax in the remote region decreases significantly due to the Dor procedure.
Stress reduction
A reduction in systolic border-zone stress may stop or reduce non-ischemic infarct extension (NIIE)—a process in which normally perfused segments adjacent to the infarct increase in size over time in response to high systolic stress. 8, 41 Our finite element-based calculations show that end-diastolic and end-systolic fiber stress is decreased in the border-zone after Dor procedure.
However, the amount of stress reduction necessary to halt or reverse NIIE in the infarct BZ is unknown. In a recent study, Moustakidis and coworkers reported that peak systolic stress (circumferential) in normal sheep was approx 12 kPa (see figure 4A). 42 It should be noted that the Dor procedure, which reduces end-systolic fiber stress to 31.1, 17.6, and 21.2 kPa in the remote, intermediate BZ and BZ near to the MI, does not succeed in ‘normalizing’ stress. Further evaluation of end-systolic and end-diastolic stress levels in normal sheep using the methods employed in this study may be warranted.
Limitations
The primary limitation of the present study is the limited spatial resolution associated with our MR image acquisition. In several of our experiments we acquired tagged short-axis images that were separated by 1 cm. Since the long-axis length of repaired LVs were significantly less than those of the other LVs, strain comparisons could be made only in the short-axis slices 1-4 cm below the valves. Moreover, the border zone in the anterior LV wall was contained within the latter slice but the other border zone regions were located below it. Thus, it is not entirely accurate to label all LV regions in the short-axis slice 4 cm below the valves as border zone regions.
Conclusions and Future Directions
The Dor procedure decreases end-diastolic and end-systolic stress but fails to improve contractility in the infarct borderzone. Future work should focus on measures that will enhance borderzone function alone or in combination with surgical remodeling.
Acknowledgments
This study was supported by NIH grant R01-HL-77921 (Dr. Guccione), VA Merit Review (Dr. Wallace), and R01-HL-63348 (Dr. Ratcliffe); this support is gratefully acknowledged.
Appendix
Diastolic constituitive relationship (material property law)
The passive myocardium was described by a strain energy function, W, that is transversely isotropic with respect to the local fiber direction,
| (3) |
where C, bf, bt and bfs are diastolic myocardial material parameters. E11 is strain in fiber direction, E22 is cross-fiber in-plane strain, E33 is radial strain transverse to the fiber direction, and the rest are shear strains.
Systolic constituitive relationship
Systolic contraction was modeled as the sum of the passive stress derived from the strain energy function and an active fiber directional component, T0, which is a function of time, t, peak intracellular calcium concentration, Ca0, sacromere length, l, and maximum isometric tension achieved at the longest sacromere length, Tmax 14,
| (4) |
where S is the second Piola-Kirchoff stress tensor, p is the hydrostatic pressure introduced as the Lagrange multiplier needed to ensure incompressibility and was calculated from the bulk modulus of water, J is the Jacobian of the deformation gradient tensor, C is the right Cauchy-Green deformation tensor, Dev is the deviatoric projection operator and is the deviatoric contribution of the strain energy function, W (Equation 3).
The modified Hill equation is used to describe the sigmoidal relation between active tension and calcium concentration in skinned cardiac muscle.
| (5) |
To describe the effect of twitch duration, Tozeren and colleagues suggested scaling the modified Hill equation with an internal variable, Ct, 43 as follows:
| (6) |
and m and b are constants. n is assumed to be 2. Note also that:
| (7) |
The length-dependent calcium sensitivity, ECa50, was determined by Guccione et al 14 to be:
| (8) |
where B is a constant, (Ca0)max is the maximum peak intracellular calcium concentration, l0 is the sarcomere length at which no active tension develops and lR is the stress-free sarcomere length.
Footnotes
Publisher's Disclaimer: This is a PDF file of an unedited manuscript that has been accepted for publication. As a service to our customers we are providing this early version of the manuscript. The manuscript will undergo copyediting, typesetting, and review of the resulting proof before it is published in its final citable form. Please note that during the production process errors may be discovered which could affect the content, and all legal disclaimers that apply to the journal pertain.
References
- 1.Dor V, Saab M, Coste P, Kornaszewska M, Montiglio F. Left ventricular aneurysm: A new surgical approach. Thoracic and Cardiovascular Surgeon. 1989;37:11–19. doi: 10.1055/s-2007-1013899. [DOI] [PubMed] [Google Scholar]
- 2.Aguiar Ribeiro GC, Antoniali F, Lopes MM, Costa CE, Albuquerque AN, Franchini KG. Left ventricular reconstruction brings benefit for patients with ischemic cardiomyopathy. J Card Fail. 2006;12(3):189–194. doi: 10.1016/j.cardfail.2005.11.002. [DOI] [PubMed] [Google Scholar]
- 3.Dor V, Di Donato M, Sabatier M, Montiglio F, Civaia F. Left ventricular reconstruction by endoventricular circular patch plasty repair: a 17-year experience. Semin Thorac Cardiovasc Surg. 2001;13(4):435–447. doi: 10.1053/stcs.2001.29966. [DOI] [PubMed] [Google Scholar]
- 4.Jones RH, Velazquez EJ, Michler RE, Sopko G, Oh JK, O’Connor CM, Hill JA, Menicanti L, Sadowski Z, Desvigne-Nickens P, Rouleau J-L, Lee KL, STICH Hypothesis 2 Investigators Coronary Bypass Surgery with or without Surgical Ventricular Reconstruction. N Engl J Med. 2009 doi: 10.1056/NEJMoa0900559. NEJMoa0900559. [DOI] [PMC free article] [PubMed] [Google Scholar]
- 5.Homans DC, Asinger R, Elsperger KJ, Erlien D, Sublett E, Mikell F, Bache RJ. Regional function and perfusion at the lateral border of ischemic myocardium. Circulation. 1985;71(5):1038–1047. doi: 10.1161/01.cir.71.5.1038. [DOI] [PubMed] [Google Scholar]
- 6.Guccione JM, Moonly SM, Moustakidis P, Costa KD, Moulton MJ, Ratcliffe MB, Pasque MK. Mechanism underlying mechanical dysfunction in the border zone of left ventricular aneurysm: a finite element model study. Ann Thorac Surg. 2001;71(2):654–662. doi: 10.1016/s0003-4975(00)02338-9. [DOI] [PubMed] [Google Scholar]
- 7.Walker JC, Ratcliffe MB, Zhang P, Wallace AW, Fata B, Hsu EW, Saloner D, Guccione JM. MRI-based finite-element analysis of left ventricular aneurysm. Am J Physiol Heart Circ Physiol. 2005;289(2):H692–700. doi: 10.1152/ajpheart.01226.2004. [DOI] [PubMed] [Google Scholar]
- 8.Jackson BM, Gorman JH, Moainie SL, Guy TS, Narula N, Narula J, John-Sutton MG, Edmunds LH, Jr., Gorman RC. Extension of borderzone myocardium in postinfarction dilated cardiomyopathy. J Am Coll Cardiol. 2002;40(6):1160–1167. doi: 10.1016/s0735-1097(02)02121-6. discussion 1168-1171. [DOI] [PubMed] [Google Scholar]
- 9.Zhang P, Guccione JM, Nicholas SI, Walker JC, Crawford PC, Shamal A, Saloner DA, Wallace AW, Ratcliffe MB. Left ventricular volume and function after endoventricular patch plasty for dyskinetic anteroapical left ventricular aneurysm in sheep. J Thorac Cardiovasc Surg. 2005;130(4):1032–1038. doi: 10.1016/j.jtcvs.2005.05.039. [DOI] [PMC free article] [PubMed] [Google Scholar]
- 10.Zhang P, Guccione JM, Nicholas SI, Walker JC, Crawford PC, Shamal A, Acevedo-Bolton G, Guttman MA, Ozturk C, McVeigh ER, Saloner DA, Wallace AW, Ratcliffe MB. Endoventricular patch plasty for dyskinetic anteroapical left ventricular aneurysm increases systolic circumferential shortening in sheep. J Thorac Cardiovasc Surg. 2007;134(4):1017–1024. doi: 10.1016/j.jtcvs.2007.03.060. [DOI] [PMC free article] [PubMed] [Google Scholar]
- 11.Omens JH, May KD, McCulloch AD. Transmural distribution of three-dimensional strain in the isolated arrested canine left ventricle. Am J Physiol. 1991;261(3 Pt 2):H918–928. doi: 10.1152/ajpheart.1991.261.3.H918. [DOI] [PubMed] [Google Scholar]
- 12.Moonly S. Experimental and computational analysis of left ventricular aneurysm mechanics. Department of Bioengineering, University of California, San Francisco with University of California, Berkeley; San Francisco, CA: 2003. [Google Scholar]
- 13.Guccione JM, McCulloch AD, Waldman LK. Passive material properties of intact ventricular myocardium determined from a cylindrical model. J Biomech Eng. 1991;113(1):42–55. doi: 10.1115/1.2894084. [DOI] [PubMed] [Google Scholar]
- 14.Guccione JM, Waldman LK, McCulloch AD. Mechanics of active contraction in cardiac muscle: Part II--Cylindrical models of the systolic left ventricle. J Biomech Eng. 1993;115(1):82–90. doi: 10.1115/1.2895474. [DOI] [PubMed] [Google Scholar]
- 15.Dang AB, Guccione JM, Mishell JM, Zhang P, Wallace AW, Gorman RC, Gorman JH, 3rd, Ratcliffe MB. Akinetic myocardial infarcts must contain contracting myocytes: finite-element model study. Am J Physiol Heart Circ Physiol. 2005;288(4):H1844–1850. doi: 10.1152/ajpheart.00961.2003. [DOI] [PubMed] [Google Scholar]
- 16.Guccione JM, Costa KD, McCulloch AD. Finite element stress analysis of left ventricular mechanics in the beating dog heart. J Biomech. 1995;28(10):1167–1177. doi: 10.1016/0021-9290(94)00174-3. [DOI] [PubMed] [Google Scholar]
- 17.Lin DH, Yin FC. A multiaxial constitutive law for mammalian left ventricular myocardium in steady-state barium contracture or tetanus. J Biomech Eng. 1998;120(4):504–517. doi: 10.1115/1.2798021. [DOI] [PubMed] [Google Scholar]
- 18.Usyk TP, Mazhari R, McCulloch AD. Effect of laminar orthotropic myofiber architecture on regional stress and strain in the canine left ventricle. J Elasticity. 2000;61:143–164. [Google Scholar]
- 19.Stander N, Roux W, Eggleston T, Craig K. LS-OPT user’s manual version 3.2. 2007. [Google Scholar]
- 20.Declerck J, Denney TS, Ozturk C, O’Dell W, McVeigh ER. Left ventricular motion reconstruction from planar tagged MR images: a comparison. Phys Med Biol. 2000;45(6):1611–1632. doi: 10.1088/0031-9155/45/6/315. [DOI] [PMC free article] [PubMed] [Google Scholar]
- 21.Denney TS, Jr., Gerber BL, Yan L. Unsupervised reconstruction of a three-dimensional left ventricular strain from parallel tagged cardiac images. Magn Reson Med. 2003;49(4):743–754. doi: 10.1002/mrm.10434. [DOI] [PubMed] [Google Scholar]
- 22.Krueger C, Tian L. A comparison of the general linear mixed model and repeated measures ANOVA using a dataset with multiple missing data points. Biol Res Nurs. 2004;6(2):151–157. doi: 10.1177/1099800404267682. [DOI] [PubMed] [Google Scholar]
- 23.Wooding W. Probability and mathematical statistics. John Wiley and Sons, Inc.; New York: 1994. Planning pharmaceutical clinical trials: Basic statistical principals; pp. 34–36. [Google Scholar]
- 24.Artrip JH, Oz MC, Burkhoff D. Left ventricular volume reduction surgery for heart failure: a physiologic perspective. J Thorac Cardiovasc Surg. 2001;122(4):775–782. doi: 10.1067/mtc.2001.116208. [DOI] [PubMed] [Google Scholar]
- 25.Dang AB, Guccione JM, Zhang P, Wallace AW, Gorman RC, Gorman JH, 3rd, Ratcliffe MB. Effect of ventricular size and patch stiffness in surgical anterior ventricular restoration: a finite element model study. Ann Thorac Surg. 2005;79(1):185–193. doi: 10.1016/j.athoracsur.2004.06.007. [DOI] [PubMed] [Google Scholar]
- 26.Moulton MJ, Creswell LL, Actis RL, Myers KW, Vannier MW, Szabó BA, Pasque MK. An inverse approach to determining myocardial material properties. Journal of Biomechanics. 1995;28(8):935–948. doi: 10.1016/0021-9290(94)00144-s. [DOI] [PubMed] [Google Scholar]
- 27.Myers RH, Montgomery DC. Response surface methodology. John Wiley and Sons; New York: 1995. [Google Scholar]
- 28.Stander N, Craig KJ. On the robustness of a simple domain reduction scheme for simulation based optimization. Engineering Computations. 2002;19:431–450. [Google Scholar]
- 29.Guccione JM, McCulloch AD. Mechanics of active contraction in cardiac muscle: Part I--Constitutive relations for fiber stress that describe deactivation. J Biomech Eng. 1993;115(1):72–81. doi: 10.1115/1.2895473. [DOI] [PubMed] [Google Scholar]
- 30.Kentish JC, ter Keurs HE, Ricciardi L, Bucx JJ, Noble MI. Comparison between the sarcomere length-force relations of intact and skinned trabeculae from rat right ventricle. Influence of calcium concentrations on these relations. Circ Res. 1986;58(6):755–768. doi: 10.1161/01.res.58.6.755. [DOI] [PubMed] [Google Scholar]
- 31.Dispersyn G, Mesotten L, Meuris B, Maes A, Mortelmans L, Flameng W, Ramaekers F, Borgers M. Dissociation of cardiomyocyte apoptosis and dedifferentiation in infarct border zones. European Heart Journal. 2002;23:849–857. doi: 10.1053/euhj.2001.2963. [DOI] [PubMed] [Google Scholar]
- 32.Narula N, Narula J, Zhang P, Haider N, Raghunath P, Britten R, Gorman J, Gorman R, Tomaszewski J. Is the myofibrillarlytic myocyte a forme fruste apoptotic myocyte? Ann Thorac Surg. 2005;79:1333–1337. doi: 10.1016/j.athoracsur.2004.09.061. [DOI] [PubMed] [Google Scholar]
- 33.Wilson EM, Moainie SL, Baskin JM, Lowry AS, Deschamps AM, Mukherjee R, Guy TS, St John-Sutton MG, Gorman JH, 3rd, Edmunds LH, Jr., Gorman RC, Spinale FG. Region- and type-specific induction of matrix metalloproteinases in post-myocardial infarction remodeling. Circulation. 2003;107(22):2857–2863. doi: 10.1161/01.CIR.0000068375.40887.FA. [DOI] [PubMed] [Google Scholar]
- 34.Mukherjee R, Mingoia JT, Bruce JA, Austin JS, Stroud RE, Escobar GP, McClister DM, Jr., Allen CM, Alfonso-Jaume MA, Fini ME, Lovett DH, Spinale FG. Selective spatiotemporal induction of matrix metalloproteinase-2 and matrix metalloproteinase-9 transcription after myocardial infarction. Am J Physiol Heart Circ Physiol. 2006;291(5):H2216–2228. doi: 10.1152/ajpheart.01343.2005. [DOI] [PubMed] [Google Scholar]
- 35.Sawicki G, Leon H, Sawicka J, Sariahmetoglu M, Schulze CJ, Scott PG, Szczesna-Cordary D, Schulz R. Degradation of myosin light chain in isolated rat hearts subjected to ischemia-reperfusion injury: a new intracellular target for matrix metalloproteinase-2. Circulation. 2005;112(4):544–552. doi: 10.1161/CIRCULATIONAHA.104.531616. [DOI] [PubMed] [Google Scholar]
- 36.Gao CQ, Sawicki G, Suarez-Pinzon WL, Csont T, Wozniak M, Ferdinandy P, Schulz R. Matrix metalloproteinase-2 mediates cytokine-induced myocardial contractile dysfunction. Cardiovasc Res. 2003;57(2):426–433. doi: 10.1016/s0008-6363(02)00719-8. [DOI] [PubMed] [Google Scholar]
- 37.Biagini E, Galema TW, Schinkel AF, Vletter WB, Roelandt JR, Ten Cate FJ. Myocardial wall thickness predicts recovery of contractile function after primary coronary intervention for acute myocardial infarction. J Am Coll Cardiol. 2004;43(8):1489–1493. doi: 10.1016/j.jacc.2004.02.035. [DOI] [PubMed] [Google Scholar]
- 38.Cwajg JM, Cwajg E, Nagueh SF, He ZX, Qureshi U, Olmos LI, Quinones MA, Verani MS, Winters WL, Zoghbi WA. End-diastolic wall thickness as a predictor of recovery of function in myocardial hibernation: relation to rest-redistribution T1-201 tomography and dobutamine stress echocardiography. J Am Coll Cardiol. 2000;35(5):1152–1161. doi: 10.1016/s0735-1097(00)00525-8. [DOI] [PubMed] [Google Scholar]
- 39.Nagueh SF, Mikati I, Weilbaecher D, Reardon MJ, Al-Zaghrini GJ, Cacela D, He ZX, Letsou G, Noon G, Howell JF, Espada R, Verani MS, Zoghbi WA. Relation of the contractile reserve of hibernating myocardium to myocardial structure in humans. Circulation. 1999;100(5):490–496. doi: 10.1161/01.cir.100.5.490. [DOI] [PubMed] [Google Scholar]
- 40.Moulton MJ, Downing SW, Creswell LL, Fishman DS, Amsterdam DM, Szabó BA, Cox JL, Pasque MK. Mechanical dysfunction in the border zone of an ovine model of left ventricular aneurysm. Annals of Thoracic Surgery. 1995;60(4):986–997. doi: 10.1016/0003-4975(95)00521-l. discussion 998. [DOI] [PubMed] [Google Scholar]
- 41.Jackson BM, Gorman JH, 3rd, Salgo IS, Moainie SL, Plappert T, St John-Sutton M, Edmunds LH, Jr., Gorman RC. Border zone geometry increases wall stress after myocardial infarction: contrast echocardiographic assessment. Am J Physiol Heart Circ Physiol. 2003;284(2):H475–479. doi: 10.1152/ajpheart.00360.2002. [DOI] [PubMed] [Google Scholar]
- 42.Moustakidis P, Maniar HS, Cupps BP, Absi T, Zheng J, Guccione JM, Sundt TM, Pasque MK. Altered left ventricular geometry changes the border zone temporal distribution of stress in an experimental model of left ventricular aneurysm: a finite element model study. Circulation. 2002;106(12 Suppl 1):I168–175. [PubMed] [Google Scholar]
- 43.Tozeren A. Continuum rheology of muscle contraction and its application to cardiac contractility. Biophys J. 1985;47(3):303–309. doi: 10.1016/S0006-3495(85)83920-5. [DOI] [PMC free article] [PubMed] [Google Scholar]