

Abstract
Multiple myeloma is characterized by increased bone marrow neovascularization driven in part by vascular endothelial growth factor (VEGF). In addition, the Ras/Raf/MEK/ERK pathway is critical for the proliferation of myeloma cells and is often upregulated. Sorafenib (Nexavar) is a novel multi-kinase inhibitor that acts predominantly through inhibition of Raf-kinase and VEGF receptor 2, offering the potential for targeting two important aspects of disease biology. In in vitro studies, sorafenib-induced cytotoxicity in MM cell lines as well as freshly isolated patient myeloma cells. It retained its activity against MM cells in co-culture with stromal cells or with interleukin-6, VEGF or IGF; conditions mimicking tumor microenvironment. Examination of cellular signaling pathways showed downregulation of Mcl1 as well as decreased phosphorylation of the STAT3 and MEK/ERK, as potential mechanisms of its anti-tumor effect. Sorafenib induces reciprocal upregulation of Akt phosphorylation; and simultaneous inhibition of downstream mTOR with rapamycin leads to synergistic effects. Sorafenib also synergizes with drugs such as proteasome inhibitors and steroids. In a human in vitro angiogenesis assay, sorafenib showed potent anti-angiogenic activity. Sorafenib, through multiple mechanisms exerts potent anti-myeloma activity and these results favor further clinical evaluation and development of novel sorafenib combinations.
Keywords: vascular endothelial growth factor, myeloma, angiogenesis, proliferation, apoptosis, microenvironment
Introduction
The tumor microenvironment has an important role in myeloma and new treatments need to target the tumor as well as the microenvironment to be effective. Demonstration of increased bone marrow (BM) angiogenesis and studies highlighting the relevance of endothelial cell–myeloma cell interactions provides a compelling rationale for use of anti-angiogenic agents in multiple myeloma (MM) (Vacca et al., 1994; Rajkumar et al., 2002; Kumar et al., 2004a). Although several cytokines are implicated in the angiogenesis in multiple myeloma (MM), vascular endothelial growth factor (VEGF) is important and interruption of VEGF signaling may have therapeutic potential. The interaction between the tumor cells and the microenvironment is mediated through various mechanisms including cytokines such as VEGF, IL-6, IGF-1 and HGF among others. The Ras/Raf/MEK/ERK pathway lies downstream of the receptors for these cytokines and has an important role in this disease (Uchiyama et al., 1993; Vacca et al., 1994; Ferlin et al., 2000; Podar et al., 2001; Rajkumar et al., 2002; Rowley and Van Ness, 2002; Kumar et al., 2004a). It enables activated cell surface receptor–tyrosine–kinases to convey growth signals to the cell nucleus and thus influence transcriptional activity leading to cell cycle progression, downregulation of pro-apoptotic pathways and enhanced cell motility. The blockade of Ras/Raf/MEK/ERK pathway can induce apoptosis of MM cells even in the presence of stroma, which typically protects them from conventional drugs such as dexamethasone (Chatterjee et al., 2002, 2004). This pathway can also be upregulated by oncogenic activation of Ras, an event found with increasing frequency in the late stages of myeloma (Neri et al., 1989; Paquette et al., 1990; Portier et al., 1992; Liu et al., 1996; Bezieau et al., 2001). In newly diagnosed MM, Ras mutations can be observed in one third of the patients and appeared to correlate with shorter survival regardless of the response to treatment (Liu et al., 1996) and its acquisition appears to correlate with disease progression. (Corradini et al., 1993; Brown et al., 1994; Pope et al., 1997) Given the important role of the Raf pathway in tumor progression in MM, it is only logical that it should be examined as a potential therapeutic target in MM.
Sorafenib is a bisaryl urea designed to specifically target Raf kinase by binding to the adenosine triphosphate binding site of Raf kinase. (Strumberg, 2005; Strumberg and Seeber, 2005; Strumberg et al., 2005) Sorafenib has shown in vitro and in vivo efficacy in a broad range of cancers including renal cell, hepatocellular, colon, breast, pancreas and ovarian cancer and is currently approved for treatment of renal cell carcinoma. Given the importance of Raf/MEK/ERK pathway and VEGF in myeloma biology, we examined the in vitro activity of sorafenib as well as its potential mechanisms of action with the eventual goal of developing a rationale for its evaluation in clinical trials.
Results
Sorafenib inhibits the growth of multiple myeloma cell lines
Treatment of myeloma cell lines (RPMI 8226, ANBL-6, KAS-6/1, MM1.S, OPM-2, LR5, Dox40 and MM1R) with sorafenib for 48 h resulted in a dose-dependent growth inhibition (Figure 1a, not all cell lines shown). The median growth inhibitory concentration of sorafenib was around 5 μm at 48 h with a range from 1 to 10 μm observed between cell lines. Maximum inhibition was observed at 48 h of incubation after a single treatment, with little additional effect observed at 72 h (data not shown). A similar degree of growth inhibition was also observed with two interleukin (IL)-6-dependent cell lines, ANBL-6 and KAS-6/1. More importantly, dose-dependent growth inhibition was observed with drug-resistant myeloma cell lines MM1.R, LR5 and Dox-40, albeit at higher doses compared with the respective parental cell line (MM1.S, RPMI 8226).
Figure 1.

Sorafenib is cytotoxic to multiple myeloma (MM) cell lines including those resistant to conventional drugs and overcomes proliferative effect of BMSCs and human umbilical vein endothelial cells (HUVECs). When MM cell lines were incubated with sorafenib for 48 h, dose-dependent cytotoxic effects were observed as measured using the MTT cell viability assay (a). The IC50 value was around 5 μm for most of the cell lines tested. Sorafenib concentration (μm) is indicated on the X axis and viability (as a percentage of the control) is indicated on the Y axis. Error bars represent one s.d. When MM1.S cells were grown in contact with stromal cells (b) or HUVECs (c), an enhanced proliferation of the MM cells were observed (measured by thymidine uptake), which was completely reversed when incubated with sorafenib. The Y axis represents the thymidine uptake (counts per minute) and the X axis represents the drug concentrations. The concentrations of sorafenib used are indicated in the figure and the duration of incubation with sorafenib was 48 h. When MM1S cells were grown with cytokines (25 ng/ml IL-6, 50 ng/ml VEGF,or 50 ng/ml IGF-1) sorafenib can inhibit the increase in cytokine-induced proliferation as measured by thymidine uptake (d). The concentrations of sorafenib used are indicated in the figure and the time of incubation with sorafenib was 48 h. The Y axis represents the thymidine uptake (counts per minute) and the X axis represents the drug concentrations.
Sorafenib overcomes the protective effect of BM microenvironment on MM cells
Given that tumor microenvironment protects myeloma cells against cytotoxic effects of various drugs, we examined if sorafenib can overcome this resistance. The tumor microenvironment was simulated in vitro either by co-culture of myeloma cells (MM1.S cells) with BMSC or human umbilical vein endothelial cells or by growing myeloma cell lines in the presence of different cytokines such as IL-6, VEGF and IGF-1. Although the BMSC (Figure 1b) and the human umbilical vein endothelial cells (Figure 1c) can stimulate the growth of the myeloma cells as measured by thymidine uptake, treatment with sorafenib can overcome their protective effect on MM1S cells. In addition, sorafenib can inhibit cytokine (IL6 or VEGF or IGF)-induced increase in proliferation as observed by thymidine uptake (Figure 1d).
Sorafenib induces apoptosis of myeloma cell lines and primary myeloma cells
We next examined if the cytotoxic effects of sorafenib were mediated through the induction of apoptotic cell death. Sorafenib-induced apoptosis in MM1.S myeloma cell lines in a time-dependent manner as measured by flow cytometry using Annexin/PI staining. At 6-h post-treatment with sorafenib there was a minimal increase in apoptosis. At 24-h post-treatment with sorafenib there was a significant increase in apoptotic cells as indicated (Figure 2a). Immunoblotting of cellular lysates after sorafenib treatment showed a time-dependent cleavage of PARP, confirming induction of apoptosis. In addition, by performing both western blotting and flow cytometry we can observe a time-dependent cleavage of caspases 3, 8 and 9 in MM1.S cells confirming involvement of the intrinsic and extrinsic apoptotic pathways (Figure 2b). Sorafenib can induce cytotoxicity in ZVADfmk pretreated and non-ZVADfmk treated myeloma cells at similar levels indicating that although sorafenib treatment leads to increase in caspase cleavage, it can induce apoptosis by caspase-independent mechanisms as well (data not shown).
Figure 2.


Sorafenib induces apoptosis in MM1.S myeloma cell line and myeloma patient cells. Time-dependent increase in the apoptotic cells was observed when MM1.S multiple myeloma (MM) cells were treated with increasing doses of sorafenib (a). Annexin V-fluorescein isothiocyanate (FITC) staining is represented on the X axis and propidium iodide (PI) staining is represented on the Y axis. The proportion of cells in each quadrant is as indicated in the figure. There is a time-dependent decrease in viable cells (lower left quadrant) with concomitant increase in apoptotic (lower right quadrant) and necrotic (upper right quadrant) cells. When MM1.S MM cells were treated with sorafenib (5 μm), induction of apoptosis in MM cells was accompanied by a time-dependent (0, 3 and 6 h) cleavage of caspase 3, caspase 8 and caspase 9 as shown by flow cytometry (b). Induction of apoptosis is also confirmed by the timedependent (0, 1, 2, 4 and 6) cleavage of caspases 3, 8 and 9 as well as PARP as shown by immunoblotting (b). Sorafenib induces apoptosis of freshly isolated patient MM cells when cultured with the indicated drug concentrations for 36–48 h as measured using Apo 2.7-PE staining and flow cytometry. Sorafenib concentrations (μm) are indicated and percentage of apoptotic cells (percentage of cells expressing membrane Apo 2.7) is indicated on the Y axis (c). Results from 10 different patients are shown; proportion of cells positive for Apo 2.7 is shown on the Y axis. In addition, whole marrow mononuclear cells were treated with 5 or 10 μm sorafenib for 48 h and the CD38/CD45 plasma cell compartment was examined using flow cytometry (d). CD38 expression is denoted on the Y axis and CD45 expression on the X axis. Plasma cells were identified as those cells staining brightly for CD38. Both the CD45 positive and negative MM cells appear to be sensitive to the cytotoxic effects of sorafenib. Primary patient cells were treated with indicated concentrations of sorafenib for 48 h and cytotoxic effects of sorafenib on patient cells measured using MTT assays (e). In the above experiments it must be noted that all groups (control cells and sorafenib treated cells) were analysed at the same time. Control groups were left untreated for the duration of the experiment and analysed along with the sorafenib-treated cells. In the case of drug-treated cells, sorafenib was added at different time points to cells in culture that were set up at the same time. The duration of incubation with sorafenib is indicated in respective figures.
We then treated primary myeloma cells with increasing doses of sorafenib and the degree of apoptosis induction was determined by flow cytometric evaluation of Apo 2.7 staining as a marker of apoptosis. (Figure 2c) Comparison of treated cells and the untreated controls revealed varying degree of apoptosis that appeared to be dose dependent in some of the patients. However, significant heterogeneity was observed between patient samples with respect to their sensitivity to sorafenib. We also studied unsorted marrow cells from patients with myeloma to evaluate the differential effects, if any, of the drug on the CD45 positive and negative plasma cell populations given the biological differences between these two sets of plasma cells (Kumar et al., 2005b). When plasma cells were identified by their CD38 expression, both the CD45 positive and negative cells were affected by treatment (Figure 2d). To validate the cytotoxic effects of sorafenib on patient cells, we performed an MTT assay on two patients. Sorafenib can induce cytotoxicity on both the patients although at different doses (Figure 2e). Sorafenib can induce cytotoxicity on patient 1 primary cells only at 20 μm whereas it can kill patient 2 primary cells at concentrations as low as 5 μm once again confirming the heterogeneity among patient samples.
Mechanisms of anti-myeloma activity of sorafenib
We then examined the intracellular events leading to induction of apoptosis to identify potential mechanisms of action of sorafenib in myeloma cells. The changes were examined both at a protein level by immunoblotting as well as at a gene expression level using micro arrays.
First, we examined pathways known to be important for myeloma cell proliferation and survival (Figure 3a). Treatment of myeloma cells lines (MM1.S and OPM-2) resulted in time-dependent downregulation of STAT3 phosphorylation. Consistent with sorafenib’s effect on the Raf/MEK/ERK pathway, we saw a time-dependent downregulation of ERK phosphorylation. However, we observed a transient upregulation of Akt phosphorylation, which returned to baseline by 6 h. As reported with sorafenib earlier, we observed a downregulation of Mcl1 after sorafenib treatment. Repeating the experiment in the presence of the pan-caspase inhibitor ZVADfmk did not significantly affect the Mcl1 downregulation (data not shown).
Figure 3.
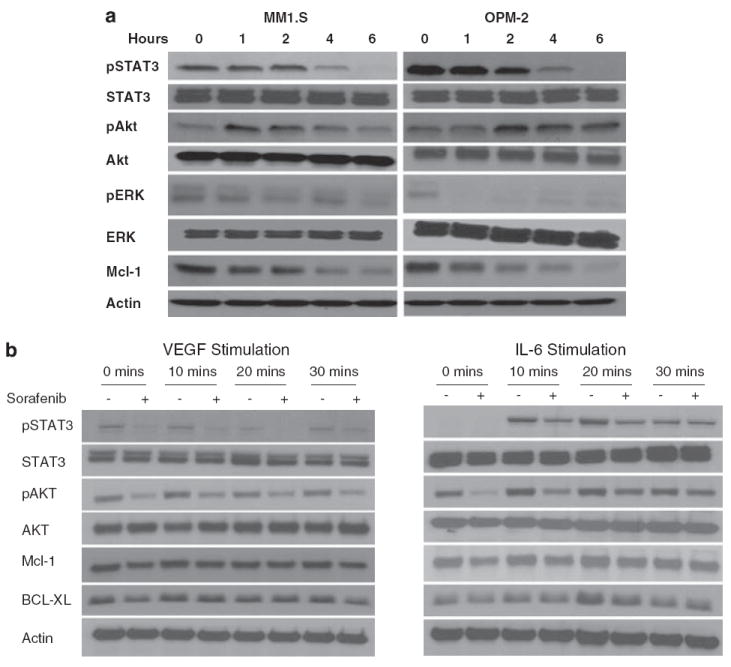

Sorafenib treatment induces changes in proliferation and survival signals in multiple myeloma (MM) cells. Immunoblots of extracts from MM1.S and OPM2 cells treated with sorafenib (5 μm) for the indicated time periods show consistent downregulation of phospho-ERK, phospho-STAT3 and Mcl-1 (a). In contrast a time-dependent increase in Akt phosphorylation was observed that returned to near baseline levels by 6 h of treatment. No change was observed in total Akt, Erk or Stat3. Equal protein loading is confirmed by blotting for actin (a). MM1.S cells were then incubated with Interleukin-6 (IL-6) (25 ng/ml) or VEGF (50 ng/ml) for the indicated times with (+) or without a 6 h pre-incubation with sorafenib (5 μm) (b). IL-6 and VEGF treatments were carried out during the last 30, 20 or 10 min of the 6-h incubation with the drug as shown in the figure. Immunoblots were performed for pSTAT3, pAKT, MCl-1, BCl-xl, total STAT3, AKT and β-actin (control). Preincubation with sorafenib partially abrogates the vascular endothelial growth factor (VEGF) and IL-6-induced upregulation of pSTAT3 as well as Mcl1. MM1.S cells were treated with sorafenib (5 μm) for 4, 8 or 24 h, cells harvested, and subjected to gene expression profiling using Affymetrix U 133 Plus 2.0 platform (c). The experiment was repeated three times and the corresponding samples were combined to reduce experiment to experiment variation. The output files were imported into Genespring 7.2, GCRMA normalized and expression levels analysed at each time point. The graph and the accompanying table show genes that show a consistent time-dependent differential regulation.
We then specifically examined the effect of IL-6 and VEGF-mediated signaling and the effect of drug treatment on these pathways. Pretreatment of myeloma cells (MM1S) with sorafenib resulted in abrogation of STAT3 phosphorylation induced by both VEGF and IL-6 (Figure 3b). Similarly, the Akt phosphorylation induced by IL-6 was also abrogated by the pretreatment with sorafenib. This also led to abrogation of the Bcl-xL upregulation typically observed with IL-6 and is responsible for some of the anti-apoptotic effects of IL-6. We then examined the effect on Mcl-1, given the ability of IL-6 and VEGF to upregulate Mcl-1 in myeloma cell lines. Treatment with sorafenib resulted in suppression of the upregulation in Mcl-1 levels in MM1.S cells observed after treatment with IL-6 or VEGF. These results confirm the ability of sorafenib to target signal transduction pathways in the presence of cytokines indicating the potential of this drug in vivo.
Gene expression profiles of myeloma cells were determined at three time points after exposure to sorafenib (4, 8 and 24 h). A total of 261 genes were at least 10-fold differentially expressed at any time point compared with the untreated sample, 77 were downregulated and 139 genes were upregulated. We specifically identified genes that increased or decreased in a time-dependent manner, because these were most likely to be mediating some of the effects we see with treatment and can provide clues to mechanisms (Figure 3c). The genes included those involved in glucocorticoid receptor signaling (hsp70, c-fos), oxidative stress (hsp70, hsp90), small GTP-mediated signal transduction (Histone H2), ECM remodeling and cell adhesion (serpine 2, MMP 10, HB-EGF, fibronectin and collagen 1), hypoxia-induced HIF activation (hsp70, p53), ubiquitin pathway (hsp70), apoptosis (p53, Bcl2, Bim, GADD45, hsp70) and VEGF signaling (Neuropilin 1, c-fos, fibronectin).
Sorafenib synergizes with common myeloma drugs as well as the mTOR inhibitor rapamycin
We first examined the effect of combining sorafenib with commonly used myeloma drugs such as dexamethasone and the proteasome inhibitor bortezomib. The combination can induce synergistic killing of myeloma cells at different dose combinations (Figures 4a and b). The synergistic nature of the combination was confirmed by examination of the combination index (CI) values using Chou–Talalay method in Calcusyn software (Biosoft, Ferguson, MO, USA). Synergy was not observed when concentrations of either of the drug were reduced below the lowest dose indicated in the respective figures (Figures 4a and b).
Figure 4.

Sorafenib synergizes with the proteasome inhibitor bortezomib and dexamethasone as well as the mTOR inhibitor rapamycin. Synergistic killing of MM1.S cells were observed when sorafenib was combined with the anti-myeloma drug bortezomib (a) or with dexamethasone (b). MTT assays were performed after 48 h of drug treatment. The sorafenib concentrations (μm) and bortezomib or dexamethasone concentrations (nm) in the combination are as shown on the X axis. The combination indices (CI) are as shown below the X axis. When sorafenib was combined with the mTOR inhibitor rapamycin, a synergistic cytotoxicity was observed in the MM1.S cells at different dose combinations after 48 h of treatment with the drugs as measured using the MTT assay (c). The sorafenib concentrations (μm) and rapamycin concentrations (nm) in the combination are as shown on the X axis. Similar effects were observed across several myeloma cell lines and the figure represents myeloma cells treated with 5 μm of sorafenib and 5 nm of rapamycin in combination after 48 h of drug treatment (d).
Given that the transient upregulation of Akt phosphorylation after treatment of myeloma cells could have potential effect of cell survival, as well as the importance of the PI3K/Akt pathway in the biology of myeloma, we examined the effect of an mTOR inhibitor on the sorafenib-induced cytotoxicity. An mTOR inhibitor was chosen because this was downstream of pAkt and because this class of drugs is currently available in the clinic and would be amenable to incorporate in clinical trials. We examined the functional effect of mTOR inhibition by combining sorafenib with rapamycin (an mTORC1 inhibitor) and observed a synergistic effect on the cytotoxicity across a spectrum of doses (Figure 4c) as well as in multiple cell lines (Figure 4d). The synergy was confirmed using an isobologram analyses, which showed CI values of <1. Fa and CI values were calculated using Chou–Talalay method in Calcusyn software.
Sorafenib treatment effects the microenvironment and its interaction with myeloma cells
Given the potent anti-VEGF receptor 2 antagonist activity of sorafenib, we examined its ability to inhibit angiogenesis in the context of myeloma. We have shown earlier the ability of marrow plasma from patients with myeloma to stimulate angiogenesis in an in vitro human angiogenesis kit (Angiokit, TCS Cellworks, Buckinghamshire, UK) (Kumar et al., 2004b). In this assay system, sorafenib treatment resulted in a dose-dependent inhibition of the tubule formation induced by myeloma marrow plasma with the effects obvious at very low concentrations of the drug (Figure 5a). In the presence of the positive control (VEGF) and the negative control (suramin) there is increased and decreased tubule formation respectively compared with the control (100%). Addition of myeloma marrow plasma resulted in significant increase in the tubule formation, which was abrogated by sorafenib.
Figure 5.

Sorafenib has anti-angiogenic properties in a myeloma setting and modulates the interaction between myeloma cells and stromal cells: the angiogenic potential of the marrow plasma from a patient with myeloma was estimated by using the Angiokit Assay system (a). The positive control represents the effect of vascular endothelial growth factor (VEGF) treatment and the negative control was treated with suramin. The initial set of bars shows the effect of sorafenib alone on the tubule formation in the wells highlighting a dose-dependent inhibition. The subsequent bar (no drug) show near doubling of the tubule formation with marrow plasma, which then is progressively inhibited by increasing concentration of the drug with complete blockade observed at 1 μm concentration. MM1.S cells were then grown in co-culture with marrow stromal cells and VEGF (b) or interleukin-6 (IL6) (c) levels in the culture supernatants were measured using enzyme-linked immunosorbent assay (ELISA). A time-dependent increase in the VEGF and IL-6 is observed in the absence of sorafenib with a significant decrease in the secretion of these cytokines in the presence of sorafenib (1 μm).
Previous studies have shown the enhanced secretion of VEGF by myeloma cells and the marrow stromal cells when they are grown in co-culture and the ability of VEGF to induce IL-6 secretion by the stromal cells. In addition, IL-6 has been shown to augment VEGF secretion in co-culture. Given the ability of sorafenib to inhibit VEGF receptor and Raf kinase activity, we examined the ability of sorafenib to inhibit this upregulation of VEGF and IL-6 secretion. In a co-culture of myeloma cells (MM1.S) and marrow stromal cells, treatment with sorafenib at a dose (1 μm) that significantly lower than the median cytotoxic doses, resulted in a dose-dependent decrease in the VEGF (Figure 5b) and IL-6 secretion (Figure 5c). These data confirm the ability of sorafenib to modulate the marrow microenvironment in myeloma.
Discussion
New approaches to myeloma treatment must take advantage of the recent improvements in our understanding of the disease biology, especially the mechanisms of myeloma cell survival and its potential interactions with the microenvironment. This study represents such an effort, to adapt a novel targeted agent with known safety profile for treatment of myeloma. We have presented evidence that would form the rationale for evaluation of sorafenib, a Raf kinase/VEGF receptor 2 inhibitor, either alone or in combination with other drugs, for treatment of myeloma.
We show potent activity of sorafenib on a wide spectrum of myeloma cell lines and primary patient cells. Interestingly, sorafenib had similar effect on the CD45− and + myeloma patient cells, which is important from a disease biology perspective. The CD45 positive PCs are believed to be the proliferative compartment and more dependent on the microenvironment and cytokines, showing higher density of cytokine receptors such as VEGF, and hence potentially more sensitive to the action of this class of drugs (Kumar et al., 2005b; Kimlinger et al., 2006). In contrast, the CD45–PCs are likely less dependent on the microenvironment signals depending more on constitutive activation of the signaling pathways and may be more susceptible to Raf kinase inhibition. The activity of this Raf kinase inhibitor is consistent with those described with other inhibitors of the pathway. Farnesyl transferase inhibitors, which inhibit farnesylation of the Ras and its membrane association, have been shown to be cytotoxic to myeloma cells that are resistant to dexamethasone and other chemotherapeutic agents (Frassanito et al., 2002). MEK inhibitors have been shown to induce apoptosis in myeloma cells (Dai et al., 2002). However, ERK inhibition in the myeloma cell line RPMI 8226, which harbors an activated K-Ras allele, did not result in cell death showing the presence of other signaling pathways and highlighting the importance of targeting an upstream mediator (Zhang and Fenton, 2002). Ability of sorafenib to downregulate this pathway is confirmed by the downregulation of ERK observed in the myeloma cell lines after treatment. Examination of the cellular signaling pathways identifies effects of sorafenib on multiple survival and proliferative signals, including those mediated by the MEK/ERK pathway as discussed as well as the JAK/STAT and the PI3K/ Akt pathways. We can see an effective downregulation of the STAT3 phosphorylation by sorafenib that can overcome the stimulatory effect of IL-6, a survival cytokine for MM cells (Lentzsch et al., 2003). STAT3 has been shown to be constitutively upregulated in tumors and this upregulation leads to the aberrant activation of anti-apoptotic proteins including BclXl and Mcl1 and cyclins. Upregulation of phospho-STAT3 levels have been reported in BM plasma cells of myeloma patients and in the myeloma line U266. Inhibiting JAK/STAT pathway leads to downregulation of anti-apoptotic proteins leading to increased apoptosis in myeloma cell lines (Catlett-Falcone et al., 1999a, b). Clearly the simultaneous downregulation of MEK/ERK and JAK/STAT pathways can contribute to the anti-myeloma activity of sorafenib.
Given the importance of Mcl-1 in the survival of myeloma cells and previous reports of Mcl-1 regulation by sorafenib in other tumors, we specifically examined the effect on Mcl-1 expression in myeloma cells (Le Gouill et al., 2004; Rahmani et al., 2005; Yu et al., 2005). We observed a time-dependent downregulation of Mcl-1 after treatment with sorafenib in myeloma cell lines. Sorafenib can completely abrogate the stimulation of Mcl-1 expression typically induced by IL-6 and VEGF in myeloma cells. Pretreatment of the myeloma cells with ZVAD-fmk, a pan caspase inhibitor resulted in only a minimal effect on the Mcl-1 downregulation after exposure to the drug (data not shown) ruling out the possibility of caspase-mediated degradation of Mcl-1. Puthier et al. had shown earlier that the JAK/STAT pathway and not the Ras/Raf/MEK/ERK pathway is involved in IL-6-induced Mcl-1 expression suggesting that the effect of sorafenib on Mcl-1 expression may not be related to its ability to downregulate the Ras/Raf/MEK/ERK pathway (Puthier et al., 1999). These findings are consistent with those reported in leukemia cell lines, in which the effect was mediated in most part through a rapid decrease in Mcl-1 translation (Rahmani et al., 2005). Other studies have suggested an inhibitory effect of sorafenib on Mcl1 transcription in lung cancer cell lines (Yu et al., 2005).
Interestingly, we saw a paradoxical upregulation of Akt phosphorylation after treatment with sorafenib, confirming the presence of cross-talk between the PI3K/Akt and the Ras/Raf/MEK/ERK pathway observed in other studies. Although IL-6 can induce Ras/Raf/MEK/ERK pathway activation, this appears to be partly mediated through cross-talk from the PI3-K pathway because PI3-K inhibitor LY294002 partially blocked IL-6-triggered MEK/ERK activation and proliferation in MM (Hideshima et al., 2001). In contrast, IL-6-mediated activation of PI3-K in MM tumor cells is at least partly mediated by signaling through Ras-dependent pathways (Hsu et al., 2004) and in this setting inhibition of Raf kinase may lead to increased Ras-mediated PI3K activation and explain the upregulation of Akt phosphorylation observed here. Conversely, treatment of myeloma cells with a selective PI3-K inhibitor lead to MEK activation showing the presence of cross-talk between the pathways (Hideshima et al., 2006).
Given the role of PI3K/Akt pathway in survival and drug resistance of myeloma cells, we decided to test the functional effect of this upregulation by targeting one of the downstream mediators in this pathway. mTOR inhibitors rapamycin and CCI-779 can inhibit IL-6-induced plasma cell proliferation by preventing p70 activation and 4E-BP1 phosphorylation (Shi et al., 2002). Given the importance of mTOR and the availability of clinically tested drugs that can inhibit it, we tested the effect of adding rapamycin to sorafenib. There was a clear cut synergy, confirmed by isobologram analysis, between sorafenib and rapamycin confirming the functional consequence of the pAkt upregulation. However, this does not exclude the possibility of active mTORC2 leading to an increase in rictormediated increase in pAkt levels, which in turn might have reduced the degree of synergy we saw. In addition, we also examined and confirmed synergistic combination of sorafenib with bortezomib and dexamethasone, combinations that should be evaluated through clinical trials.
The gene expression profiling of the myeloma cells after exposure to sorafenib, whereas limited by the fact that it is representative of only one cell line, raises interesting findings and hypotheses. We specifically focused on genes that were consistently modulated by sorafenib in a time-dependent manner. One of the genes differentially regulated was the heat shock protein hsp70, the gene being nearly five log overexpressed by 24 h. This is likely a stress response because one of the major roles for this heat shock protein is protection of cells from apoptosis and previous studies have also shown a role for hsp70 in mediating drug resistance. The PI3K/Akt pathway has been shown to be capable of upregulating hsp70 transcription and the upregulation of pAkt observed in our experiments may be having a role (Liu et al., 2006). Ongoing studies are examining the combinations of heat shock protein inhibitors with sorafenib. The GADD45 (growth arrest and DNA damage-inducible) family of genes is involved in the regulation of cell cycle progression and apoptosis and is often upregulated by cellular stress. Other mediators of the apoptotic pathway were up to 13-fold upregulated and these include p53, bcl2 and Bim.
In this study, we observed potent effect of sorafenib on the microenvironment in terms of its anti-angiogenic effect as well as its ability to modulate the interaction between myeloma cells and stromal cells. Sorafenib can abrogate the angiogenic ability of myeloma marrow plasma, which could not overcome by VEGF. Importantly, this effect was obvious at concentrations nearly one log lower than the median inhibitory doses for myeloma cells. The anti-angiogenic effect observed here is similar to that observed with sorafenib in other tumor systems (Wilhelm et al., 2004). VEGF is an important mediator of myeloma cell–stromal cell interaction and when myeloma cells come in contact with stromal cells there increased VEGF secretion by myeloma cells, stromal cells and the endothelial cells, which in turn leads to stromal cell IL-6 secretion (Gupta et al., 2001). The Ras/Raf/MEK/ERK pathway has an important role in VEGF secretion and studies have shown that downregulation of ERK can inhibit VEGF secretion by myeloma cells (Giuliani et al., 2004). Consistent with the role of this pathway in VEGF secretion, we observed decreased VEGF secretion in a co-culture system containing myeloma cells and BMSC in presence of non-cytotoxic doses of sorafenib. We also noticed decreased secretion of IL-6 consistent with the role of VEGF in stimulating IL-6 secretion by the BMSC. These effects of sorafenib will potentially have a role in indirectly decreasing the myeloma cell proliferation, abrogating some of the drug resistance phenotype and enhancing the activity of other drugs.
Materials and methods
MM cell lines and BM stromal cells
Multiple myeloma cell lines included dexamethasone sensitive (MM1.S) and resistant (MM1.R) cell lines; RPMI 8226, OPM-2, NCI-H929, U266 as well as doxorubicin-resistant (Dox 40), and melphalan-resistant (LR5) RPMI 8226 cell lines. All the cell lines were cultured in RPMI 1640 media (Sigma Chemical, St Louis, MO, USA) that contained 10% fetal bovine serum, 2mm l-glutamine (GIBCO, Grand Island, NY, USA), 100U/ml penicillin and 100 μg/ml streptomycin. Freshly obtained BM aspirates were subjected to Ficoll–Paque gradient separation, and the mononuclear cells were placed in 25mm2 culture flasks in RPMI 1640 media containing 20% fetal bovine serum, 2mm l-glutamine, 100 U/ml penicillin and 100 μg/ml streptomycin. Once the adherent stromal cells (BMSC) were confluent, they were trypsinized and passaged as needed.
Sorafenib (Nexavar)
Sorafenib was provided by Bayer Pharmaceuticals under an agreement with Cancer Therapy Evaluation Program and Bayer. Stock solutions were made in dimethylsulphoxide at a concentration of 20mm, aliquoted and stored at −70°C to avoid repeated freeze thaw. For individual experiments, the drug aliquot was thawed and diluted taking care to avoid final dimethylsulphoxide concentrations of over 0.01%.
Cell proliferation and cytotoxicity assays
Myeloma cells were incubated in 96-well culture plates in media alone, or with varying concentrations of sorafenib for 48 h at 37°C. In the experiments carried out to evaluate the effect of growth factors, recombinant IL-6 (25 ng/ml), or VEGF (50 ng/ml) were added to the MM cells and then incubated with or with out sorafenib. To confirm cytotoxicity of sorafenib, colorimetric assays were performed using 3-(4,5-dimethylthiazol-2-yl)-2,5-diphenyl tetrasodium bromide (MTT; Chemicon International Inc., Temecula, CA, USA) as described earlier (Raje et al., 2004; Kumar et al., 2005a). All experiments were performed in triplicate.
In the experiments using co-culture of myeloma cells with BMSC, cell proliferation was measured using tritiated thymidine uptake (3H-TdR; Perkin Elmer, Boston, MA, USA) as described earlier (Raje et al., 2004; Kumar et al., 2005a). BMSC were plated onto flat-bottomed 96-well plates at a concentration of 5000 cells per well and allowed to adhere overnight. Myeloma cells were added to the wells in medium alone or with sorafenib and incubated for 48 h at 37°C. Cells were pulsed with 3H-TdR during the last 8 h of 48-h cultures, harvested on glass fiber filters using a Combi cell harvester (Molecular Devices, Sunnyvale, CA, USA), and incorporated radioactivity determined using a Beckman LS6000SC scintillation counter. All experiments were performed in triplicate.
Detection of apoptosis in cell lines and patient tumor cells
Apoptosis of tumor cell lines were detected by staining with Annexin fluorescein isothiocyanate and PI as described earlier (Raje et al., 2004; Kumar et al., 2005a). Briefly, cells were cultured in media alone, or with varying concentrations of sorafenib, and harvested every 6 h for 30 h. Cells were washed twice with ice-cold phosphate-buffered saline, resuspended in Annexin binding buffer and incubated with Annexin V-fluorescein isothiocyanate for 15 min at room temperature. Cells were then washed and resuspended in annexin binding buffer with 10 μg/ml propidium iodide added. The apoptotic fraction was identified as Annexin V-positive and PI-negative cells when analysed using a FACSCanto (BD Biosciences, San Jose, CA, USA). Levels of caspase 3, 8 and 9 were indirectly determined by the production of FL1 fluorescence by cleaved substrate using reagents from OncoImmune (Gaithersburg, MD, USA). PhiPhiLux G1D2 was used for the detection of caspase 3, awhereas CaspaLux 8 L1D2 and CaspaLux 9 M1D2 were used for the detection of caspases 8 and 9. All experiments were performed in triplicate.
For evaluation of patient myeloma cells, BM aspirates were subjected to ACK lysis and myeloma cells separated by positive selection using CD138 coated magnetic beads in a Robosep system. The tumor cells were suspended in RPMI 1640 media containing 10% fetal bovine serum, placed in 24-well plates and cultured for 48 h with or with out sorafenib. The cells were harvested, washed twice with phosphate-buffered saline and stained with PE conjugated Apo 2.7 antibody for identification of apoptotic cells. Additional samples were analysed using unsorted marrow mononuclear cells with the myeloma cells identified using a CD38+/CD45+ gating strategy to analyse differential effects on the CD45 positive and negative cells.
Western blotting
Multiple myeloma cells were cultured with 5 μm sorafenib and lysed in buffer (50mm HEPES (pH 7.4), 150mm NaCl, 1% Triton X-100, 30mm sodium pyrophosphate, 5mm EDTA, 2mm Na3VO4, 5mm NaF, 1mm phenylmethyl-sulfonyl-fluoride, 5 μg/ml leupeptin, and 5 μg/ml aprotinin) (Raje et al., 2004; Kumar et al., 2005a). Cell lysates were subjected to sodium dodecyl sulfate–polyacrylamide gel electrophoresis, transferred to nitrocellulose membrane and immunoblotted with the relevant antibody. To characterize growth signaling, immunoblotting was carried out using antibodies against pErk1/2, pStat3, pAkt, Akt, Stat3, Erk1/2, Mcl-1 and β-actin (Cell Signaling Technology, Danvers, MA, USA). To characterize proteins involved in apoptosis immunoblotting was carried out using antibodies against PARP, caspases 3, 8 and 9 (Cell Signaling Technology). Antigen-antibody complexes were detected using enhanced chemiluminescence (Amersham, Arlington Heights, IL, USA). Blots were stripped and re-probed with anti-actin antibody (Santa Cruz Biotechnology, Santa Cruz, CA, USA) to ensure equivalent protein loading. All experiments were repeated on three separate occasions. For cytokine experiments, MM1S cells were treated with sorafenib (5 μm) for 6 h. In the last 30 min of incubation with the drug, cells were treated with either IL-6 (25 ng/ml) or VEGF (50 ng/ml) for 0, 10, 20 or 30 min. Lysates were made as above and immunoblotting was carried out using antibodies against pStat3, pAkt, Mcl-1, Bcl-xl, Stat3, Akt and β-actin (Cell Signaling Technology).
Isobologram analysis
The interaction between sorafenib and other drugs was analysed using the CalcuSyn software program. This program is based upon the Chou–Talalay method, which calculates a CI, and analysis is performed based on the following equation:
where (D)1 and (D)2 are the doses of drug 1 and drug 2 that have x effect when used in combination, and (Dx)1 and (Dx)2 are the doses of drug 1 and drug 2 that have the same x effect when used alone. Data from the MTT viability assay were expressed as the fraction of cells killed by the individual drug or the combination in drug-treated cells compared with untreated cells. A CI of 1.0 indicates an additive effect, whereas CI values below 1.0 indicate synergism.
Gene expression analysis
The effect of treatment with sorafenib on the gene expression profile of myeloma cells was studied using the Affymetrix U133 Plus 2.0 platform (Affymetrix, Santa Clara, CA, USA). RPMI cells were treated with sorafenib (10 μm) and cells were harvested at baseline, and at 4, 8 and 24 h of treatment. Three separate experiments were carried out and samples from corresponding time points combined to reduce inter experiment variability. Total RNA was extracted according to manufacturer’s instructions for the Qiagen RNeasy Mini Kit (Valencia, CA, USA). Double-stranded complementary DNA was synthesized from eight micrograms of total RNA and the purified product was used to create biotin-labeled complementary RNA by in vitro transcription (Enzo, New York, NY, USA). Labeled product was hybridized onto Affymetrix U133 Plus 2.0 GeneChips. The hybridized arrays were scanned using a GeneChip 3000 scanner and Affymetrix GeneChip Operating System software v.1.3 (Santa Clara, CA, USA) were used to quantitatively analyse the scanned image. The CEL files were GCRMA normalized on Genespring 7.2 software and the differential expression of genes across time points were examined.
Angiogenesis assay
We used the in vitro human angiogenesis kit Angiokit for evaluating the anti-angiogenic activity of sorafenib (Kumar et al., 2004b). In the test wells, 10 μl of BM plasma, made cell free by centrifugation was used. Assays were incubated at 37°C with 5% CO2 humidified atmosphere. On day 11, residual medium was aspirated, cultures fixed and stained with antibodies to CD31 to detect vessel formation. The degree of tubule formation was evaluated by light microscopy and quantitated using computerized image analysis (Angiosys, TCS Cellworks). The total tubule length in each test well was expressed as a percent of the NT control wells. Stimulation of angiogenesis in the test wells was defined as total tubule length >125% of NT control and inhibition as <75% of NT control.
Enzyme-linked immunosorbent assay
The effect of sorafenib on cytokine secretion by human BMSCs, co-cultured with MM cells, was studied using enzyme-linked immunosorbent assay for IL-6 and VEGF. BMSCs were harvested and cultured in 96-well plates with varying concentrations of sorafenib with or without MM1.S cells. After 24-h incubation, the supernatants were harvested and stored at −70°C until measurement. Cytokines were measured using Duoset ELISA Development Kits (R&D Systems, Minneapolis, MN, USA). All measurements were carried out in duplicate.
Acknowledgments
We acknowledge Roberta DeGoey and Christy Finke for their assistance with processing of tumor cells and all of the patients who provided us with the tumor samples. This work was supported by Mayo Clinic Hematologic Malignancies Program, CR20 Award from Mayo Foundation and Career Development Award from Lymphoma SPORE. Sorafenib was provided through CTEP drug evaluation program by Bayer Pharmaceuticals.
Footnotes
Conflict of interest The authors declare no conflict of interest
References
- Bezieau S, Devilder MC, Avet-Loiseau H, Mellerin MP, Puthier D, Pennarun E, et al. High incidence of N and K-Ras activating mutations in multiple myeloma and primary plasma cell leukemia at diagnosis. Hum Mutat. 2001;18:212–224. doi: 10.1002/humu.1177. [DOI] [PubMed] [Google Scholar]
- Brown RD, Pope B, Luo XF, Gibson J, Joshua D. The oncoprotein phenotype of plasma cells from patients with multiple myeloma. Leuk Lymphoma. 1994;16:147–156. doi: 10.3109/10428199409114152. [DOI] [PubMed] [Google Scholar]
- Catlett-Falcone R, Dalton WS, Jove R. STAT proteins as novel targets for cancer therapy. Signal transducer an activator of transcription. Curr Opin Oncol. 1999a;11:490–496. doi: 10.1097/00001622-199911000-00010. [DOI] [PubMed] [Google Scholar]
- Catlett-Falcone R, Landowski TH, Oshiro MM, Turkson J, Levitzki A, Savino R, et al. Constitutive activation of Stat3 signaling confers resistance to apoptosis in human U266 myeloma cells. Immunity. 1999b;10:105–115. doi: 10.1016/s1074-7613(00)80011-4. [DOI] [PubMed] [Google Scholar]
- Chatterjee M, Honemann D, Lentzsch S, Bommert K, Sers C, Herrmann P, et al. In the presence of bone marrow stromal cells human multiple myeloma cells become independent of the IL-6/gp130/STAT3 pathway. Blood. 2002;100:3311–3318. doi: 10.1182/blood-2002-01-0102. [DOI] [PubMed] [Google Scholar]
- Chatterjee M, Stuhmer T, Herrmann P, Bommert K, Dorken B, Bargou RC. Combined disruption of both the MEK/ERK and the IL-6R/STAT3 pathways is required to induce apoptosis of multiple myeloma cells in the presence of bone marrow stromal cells. Blood. 2004;104:3712–3721. doi: 10.1182/blood-2004-04-1670. [DOI] [PubMed] [Google Scholar]
- Corradini P, Ferrero D, Voena C, Ladetto M, Boccadoro M, Pileri A. The mutation of N-ras oncogene does not involve myeloid and erythroid lineages in a case of multiple myeloma. Br J Haematol. 1993;83:672–673. doi: 10.1111/j.1365-2141.1993.tb04711.x. [DOI] [PubMed] [Google Scholar]
- Dai Y, Landowski TH, Rosen ST, Dent P, Grant S. Combined treatment with the checkpoint abrogator UCN-01 and MEK1/2 inhibitors potently induces apoptosis in drug-sensitive and -resistant myeloma cells through an IL-6-independent mechanism. Blood. 2002;100:3333–3343. doi: 10.1182/blood-2002-03-0940. [DOI] [PubMed] [Google Scholar]
- Ferlin M, Noraz N, Hertogh C, Brochier J, Taylor N, Klein B. Insulin-like growth factor induces the survival and proliferation of myeloma cells through an interleukin-6-independent transduction pathway. Br J Haematol. 2000;111:626–634. doi: 10.1046/j.1365-2141.2000.02364.x. [DOI] [PubMed] [Google Scholar]
- Frassanito MA, Cusmai A, Piccoli C, Dammacco F. Manumycin inhibits farnesyltransferase and induces apoptosis of drugresistant interleukin 6-producing myeloma cells. Br J Haematol. 2002;118:157–165. doi: 10.1046/j.1365-2141.2002.03559.x. [DOI] [PubMed] [Google Scholar]
- Giuliani N, Lunghi P, Morandi F, Colla S, Bonomini S, Hojden M, et al. Downmodulation of ERK protein kinase activity inhibits VEGF secretion by human myeloma cells and myeloma-induced angiogenesis. Leukemia. 2004;18:628–635. doi: 10.1038/sj.leu.2403269. [DOI] [PubMed] [Google Scholar]
- Gupta D, Treon SP, Shima Y, Hideshima T, Podar K, Tai YT, et al. Adherence of multiple myeloma cells to bone marrow stromal cells upregulates vascular endothelial growth factor secretion: therapeutic applications. Leukemia. 2001;15:1950–1961. doi: 10.1038/sj.leu.2402295. [DOI] [PubMed] [Google Scholar]
- Hideshima T, Catley L, Yasui H, Ishitsuka K, Raje N, Mitsiades C, et al. Perifosine, an oral bioactive novel alkylphospholipid, inhibits Akt and induces in vitro andin vivo cytotoxicity in human multiple myeloma cells. Blood. 2006;107:4053–4062. doi: 10.1182/blood-2005-08-3434. [DOI] [PMC free article] [PubMed] [Google Scholar]
- Hideshima T, Nakamura N, Chauhan D, Anderson KC. Biologic sequelae of interleukin-6 induced PI3-K/Akt signaling in multiple myeloma. Oncogene. 2001;20:5991–6000. doi: 10.1038/sj.onc.1204833. [DOI] [PubMed] [Google Scholar]
- Hsu JH, Shi Y, Frost P, Yan H, Hoang B, Sharma S, et al. Interleukin-6 activates phosphoinositol-3′ kinase in multiple myeloma tumor cells by signaling through RAS-dependent and, separately, through p85-dependent pathways. Oncogene. 2004;23:3368–3375. doi: 10.1038/sj.onc.1207459. [DOI] [PubMed] [Google Scholar]
- Kimlinger T, Kline M, Kumar S, Lust J, Witzig T, Rajkumar SV. Differential expression of vascular endothelial growth factors and their receptors in multiple myeloma. Haematologica. 2006;91:1033–1040. [PubMed] [Google Scholar]
- Kumar S, Gertz MA, Dispenzieri A, Lacy MQ, Wellik LA, Fonseca R, et al. Prognostic value of bone marrow angiogenesis in patients with multiple myeloma undergoing high-dose therapy. Bone Marrow Transplant. 2004a;34:235–239. doi: 10.1038/sj.bmt.1704555. [DOI] [PubMed] [Google Scholar]
- Kumar S, Raje N, Hideshima T, Ishitsuka K, Roccaro A, Shiraishi N, et al. Antimyeloma activity of two novel N-substituted and tetraflourinated thalidomide analogs. Leukemia. 2005a;19:1253–1261. doi: 10.1038/sj.leu.2403776. [DOI] [PubMed] [Google Scholar]
- Kumar S, Rajkumar SV, Kimlinger T, Greipp PR, Witzig TE. CD45 expression by bone marrow plasma cells in multiple myeloma: clinical and biological correlations. Leukemia. 2005b;19:1466–1470. doi: 10.1038/sj.leu.2403823. [DOI] [PubMed] [Google Scholar]
- Kumar S, Witzig TE, Timm M, Haug J, Wellik L, Kimlinger TK, et al. Bone marrow angiogenic ability and expression of angiogenic cytokines in myeloma: evidence favoring loss of marrow angiogenesis inhibitory activity with disease progression. Blood. 2004b;104:1159–1165. doi: 10.1182/blood-2003-11-3811. [DOI] [PubMed] [Google Scholar]
- Le Gouill S, Podar K, Amiot M, Hideshima T, Chauhan D, Ishitsuka K, et al. VEGF induces Mcl-1 up-regulation and protects multiple myeloma cells against apoptosis. Blood. 2004;104:2886–2892. doi: 10.1182/blood-2004-05-1760. [DOI] [PubMed] [Google Scholar]
- Lentzsch S, Gries M, Janz M, Bargou R, Dorken B, Mapara MY. Macrophage inflammatory protein 1-alpha (MIP-1 alpha) triggers migration and signaling cascades mediating survival and proliferation in multiple myeloma (MM) cells. Blood. 2003;101:3568–3573. doi: 10.1182/blood-2002-08-2383. [DOI] [PubMed] [Google Scholar]
- Liu M, Aneja R, Liu C, Sun L, Gao J, Wang H, et al. Inhibition of the mitotic kinesin Eg5 up-regulates Hsp70 through the phosphatidylinositol 3-Kinase/Akt pathway in multiple myeloma cells. J Biol Chem. 2006;281:18090–18097. doi: 10.1074/jbc.M601324200. [DOI] [PubMed] [Google Scholar]
- Liu P, Leong T, Quam L, Billadeau D, Kay NE, Greipp P, et al. Activating mutations of N- and K-ras in multiple myeloma show different clinical associations: analysis of the Eastern Cooperative Oncology Group Phase III Trial. Blood. 1996;88:2699–2706. [PubMed] [Google Scholar]
- Neri A, Murphy JP, Cro L, Ferrero D, Tarella C, Baldini L, et al. Ras oncogene mutation in multiple myeloma. J Exp Med. 1989;170:1715–1725. doi: 10.1084/jem.170.5.1715. [DOI] [PMC free article] [PubMed] [Google Scholar]
- Paquette RL, Berenson J, Lichtenstein A, McCormick F, Koeffler HP. Oncogenes in multiple myeloma: point mutation of N-ras. Oncogene. 1990;5:1659–1663. [PubMed] [Google Scholar]
- Podar K, Tai YT, Davies FE, Lentzsch S, Sattler M, Hideshima T, et al. Vascular endothelial growth factor triggers signaling cascades mediating multiple myeloma cell growth and migration. Blood. 2001;98:428–435. doi: 10.1182/blood.v98.2.428. [DOI] [PubMed] [Google Scholar]
- Pope B, Brown R, Luo XF, Gibson J, Joshua D. Disease progression in patients with multiple myeloma is associated with a concurrent alteration in the expression of both oncogenes and tumour suppressor genes and can be monitored by the oncoprotein phenotype. Leuk Lymphoma. 1997;25:545–554. doi: 10.3109/10428199709039043. [DOI] [PubMed] [Google Scholar]
- Portier M, Moles JP, Mazars GR, Jeanteur P, Bataille R, Klein B, et al. p53 and RAS gene mutations in multiple myeloma. Oncogene. 1992;7:2539–2543. [PubMed] [Google Scholar]
- Puthier D, Bataille R, Amiot M. IL-6 up-regulates mcl-1 in human myeloma cells through JAK / STAT rather than ras/MAP kinase pathway. Eur J Immunol. 1999;29:3945–3950. doi: 10.1002/(SICI)1521-4141(199912)29:12<3945::AID-IMMU3945>3.0.CO;2-O. [DOI] [PubMed] [Google Scholar]
- Rahmani M, Davis EM, Bauer C, Dent P, Grant S. Apoptosis induced by the kinase inhibitor BAY 43-9006 in human leukemia cells involves down-regulation of Mcl-1 through inhibition of translation. J Biol Chem. 2005;280:35217–35227. doi: 10.1074/jbc.M506551200. [DOI] [PubMed] [Google Scholar]
- Raje N, Kumar S, Hideshima T, Ishitsuka K, Chauhan D, Mitsiades C, et al. Combination of the mTOR inhibitor rapamycin and CC-5013 has synergistic activity in multiple myeloma. Blood. 2004;104:4188–4193. doi: 10.1182/blood-2004-06-2281. [DOI] [PubMed] [Google Scholar]
- Rajkumar SV, Mesa RA, Fonseca R, Schroeder G, Plevak MF, Dispenzieri A, et al. Bone marrow angiogenesis in 400 patients with monoclonal gammopathy of undetermined significance, multiple myeloma, and primary amyloidosis. Clin Cancer Res. 2002;8:2210–2216. [PubMed] [Google Scholar]
- Rowley M, Van Ness B. Activation of N-ras and K-ras induced by interleukin-6 in a myeloma cell line: implications for disease progression and therapeutic response. Oncogene. 2002;21:8769–8775. doi: 10.1038/sj.onc.1205387. [DOI] [PubMed] [Google Scholar]
- Shi Y, Hsu JH, Hu L, Gera J, Lichtenstein A. Signal pathways involved in activation of p70S6K and phosphorylation of 4E-BP1 following exposure of multiple myeloma tumor cells to interleukin-6. J Biol Chem. 2002;277:15712–15720. doi: 10.1074/jbc.M200043200. [DOI] [PubMed] [Google Scholar]
- Strumberg D. Preclinical and clinical development of the oral multikinase inhibitor sorafenib in cancer treatment. Drugs Today (Barc) 2005;41:773–784. doi: 10.1358/dot.2005.41.12.937959. [DOI] [PubMed] [Google Scholar]
- Strumberg D, Richly H, Hilger RA, Schleucher N, Korfee S, Tewes M, et al. Phase I clinical and pharmacokinetic study of the novel Raf kinase and vascular endothelial growth factor receptor inhibitor BAY 43-9006 in patients with advanced refractory solid tumors. J Clin Oncol. 2005;23:965–972. doi: 10.1200/JCO.2005.06.124. [DOI] [PubMed] [Google Scholar]
- Strumberg D, Seeber S. Raf kinase inhibitors in oncology. Onkologie. 2005;28:101–107. doi: 10.1159/000083373. [DOI] [PubMed] [Google Scholar]
- Uchiyama H, Barut BA, Mohrbacher AF, Chauhan D, Anderson KC. Adhesion of human myeloma-derived cell lines to bone marrow stromal cells stimulates interleukin-6 secretion. Blood. 1993;82:3712–3720. [PubMed] [Google Scholar]
- Vacca A, Ribatti D, Roncali L, Ranieri G, Serio G, Silvestris F, et al. Bone marrow angiogenesis and progression in multiple myeloma. Br J Haematol. 1994;87:503–508. doi: 10.1111/j.1365-2141.1994.tb08304.x. [DOI] [PubMed] [Google Scholar]
- Wilhelm SM, Carter C, Tang L, Wilkie D, McNabola A, Rong H, et al. BAY 43-9006 exhibits broad spectrum oral antitumor activity and targets the RAF/MEK/ERK pathway and receptor tyrosine kinases involved in tumor progression and angiogenesis. Cancer Res. 2004;64:7099–7109. doi: 10.1158/0008-5472.CAN-04-1443. [DOI] [PubMed] [Google Scholar]
- Yu C, Bruzek LM, Meng XW, Gores GJ, Carter CA, Kaufmann SH, et al. The role of Mcl-1 downregulation in the proapoptotic activity of the multikinase inhibitor BAY 43-9006. Oncogene. 2005;24:6861–6869. doi: 10.1038/sj.onc.1208841. [DOI] [PubMed] [Google Scholar]
- Zhang B, Fenton RG. Proliferation of IL-6-independent multiple myeloma does not require the activity of extracellular signal-regulated kinases (ERK1/2) J Cell Physiol. 2002;193:42–54. doi: 10.1002/jcp.10148. [DOI] [PubMed] [Google Scholar]