Abstract
Loss of large artery compliance is an emerging novel predictor of cardiovascular mortality. Hypoxia-induced pulmonary hypertension (HPH) has been shown to decrease extralobar pulmonary artery (PA) compliance in the absence of smooth muscle cell (SMC) tone and to increase SMC tone in peripheral PAs. We sought to determine the impact of HPH on extralobar PA tone and the impact of SMC activation on extralobar PA biomechanics. To do so, C57BL6 mice were exposed to 0 (CTL) or 10 days (HPH) of hypoxia and isolated vessel tests were performed on extralobar PAs using either a physiological saline solution (PSS), a vasoconstrictor (U46619), two vasodilators (SNP and Y27632), or calcium free medium (relaxant solution; VBRS). The vasodilators and relaxant solution had no effect on extralobar artery diameter suggesting that basal SMC tone is essentially zero in CTL conditions and does not increase with HPH. HPH caused narrowing, decreased circumferential stretch (λ; p<0.0001), decreased local area compliance (CA; p<0.0005), and increased incremental elastic modulus (Einc; p<0.05) in the normal tone state (with PSS). In both CTL and HPH conditions, SMC activation decreased Einc (p<0.0005) but also increased wall thickness (p<0.05) such that changes in CA with SMC constriction were minimal; only in HPH PAs was a significant decrease with SMC constriction observed (p<0.05). Our results demonstrate that 10 days of hypoxia does not increase extralobar PA SMC tone and that HPH-induced decreases in compliance are caused by narrowing, wall thickening and increases in modulus, not persistent vasoconstriction.
Keywords: elastic modulus, chronic hypoxia, compliance
INTRODUCTION
The normal pulmonary circulation is a low resistance, high capacitance vascular bed. Most of the resistance is generated by small, peripheral arteries whereas most of the capacitance is provided by large, extralobar arteries, which act as conduits for blood flow (Nichols and O’Rourke, 1998). Changes in conduit pulmonary artery (PA) compliance, or inverse stiffness, are highly clinically relevant; increased extralobar PA stiffness is an excellent predictor of mortality in pulmonary arterial hypertension (Gan et al., 2007; Mahapatra et al., 2006). In prior work, we have suggested that loss of conduit PA compliance impairs right ventricular function via increased wave reflections (Tuchscherer et al., 2007). Understanding the determinants of extralobar, conduit PA compliance changes may be critical to slowing the progression of right ventricular dysfunction in pulmonary hypertension.
Vascular smooth muscle cell (SMC) activity can significantly affect vascular biomechanical behavior, including elastic modulus and compliance (Bank and Kaiser, 1998; Barra et al., 1993; Cox, 1984; Hudetz, 1979; Wilkinson et al., 2004). Although the normal pulmonary vasculature presents little or no resting tone (Barnes and Liu, 1995), the pulmonary circulation is under active control, which can be relevant in several lung diseases, such as chronic obstructive pulmonary disease (Barbera et al., 2003; Weitzenblum and Chaouat, 2004), cystic fibrosis (Fraser et al., 1999) and obstructive sleep apnea (Hiestand and Phillips, 2008), conditions that are also associated with hypoxia, which is known to increase SMC tone in pulmonary resistance arteries (Jeffery and Wanstall, 2001; Kelly et al., 2005; Preston, 2007; Robertson et al., 2000; Stenmark et al., 2006; Thomas and Wanstall, 2003). Chronic hypoxia-induced pulmonary hypertension (HPH) also has been shown to affect passive mechanics and SMC function in large pulmonary arteries. In particular, HPH increases extralobar PA elastic modulus in the absence of SMC tone (Kobs et al., 2005) and enhances the SMC response to vasoconstrictors (Bailly et al., 2004; Bialecki et al., 1998; Bonnet et al., 2001). However, the direct effects of HPH on SMC tone in large, conduit arteries and the contributions of SMC activation to extralobar PA mechanical properties have not been reported.
The goals of the present study were to determine the effects of SMC tone and activation and chronic HPH on the biomechanical behavior of extralobar pulmonary arteries. To do so, we measured pressure-diameter relationships for extralobar PAs harvested from control mice and those exposed to chronic hypoxia, treated with an isotonic saline solution, one vasoconstrictor, two vasodilators or a relaxant solution. We hypothesized that chronic hypoxia would increase circumferential elastic modulus as well as decrease local area compliance in normal SMC tone, dilated and relaxed states. We also hypothesized that the vessel response to the vasoconstrictor would be heightened after chronic hypoxia.
METHODS AND PROCEDURES
Animal Handling
32 male C57BL6/J mice, 8-10 weeks old at the time of euthanasia with an average weight of 22.9±1.4 g, were obtained from Jackson Laboratory (Bar Harbor, ME). Mice were exposed to zero days (CTL) or 10 days of hypoxia (HPH) in a hypobaric chamber (380 mmHg). The duration of hypoxia exposure was chosen based on previous experiments in which differences in extralobar PA biomechanics in the absence of SMC tone were not significant between 10 and 15 days of hypoxia (Kobs et al., 2005). Mice were euthanized with a lethal interperitoneal injection of 0.33 mg/(g body weight) pentobarbital solution, chosen because it does not affect pulmonary hemodynamics (Benumof, 1985; Kawahara et al., 2005). All protocols and procedures were approved by the University of Wisconsin Institutional Animal Care and Use Committee.
Drugs
The vasodilators used were the nitric oxide donor SNP and the rho-kinase inhibitor Y27632 (Sigma Chemical, St Louis, MO). Only the latter agent eliminates persistent hypoxic vasoconstriction in pulmonary resistance arteries (Nagaoka et al., 2004; Wang et al., 2007; Wojciak-Stothard, 2008). The vasoconstrictor used was U46619, an analog of the endoperoxide prostaglandin H2 (Cayman Chemical, Ann Arbor, MI). Concentrations of drugs (below) are expressed as final molar concentration in the superfusate bath. The stock solution of SNP was freshly prepared the morning of experiments in PSS (NaCl 119, KCl 4.7, MgSO4·7H2O 1.17, CaCl2·2H2O 1.6, NaH2PO4 1.18, NaHCO3 24, EDTA 0.03, Dextrose 5.5 mmol/L and pH 7.68±0.17). The stock solution of Y27632 was dissolved in distilled water and stored at −20°C until the day of the experiment. The stock solution of U46619 was dissolved in ethanol and then freshly diluted the morning of the experiments in PSS. Relaxant solution (Van Breemen’s Relaxant PSS) was prepared by substituting 20 mM MgCl2·6H2O in place of 1.6mM CaCl2·2H2O and adding 2mM EGTA in PSS solution.
Experimental Setup
After euthanasia, the heart and lungs were excised. The left PA, excised between the pulmonary trunk and second pulmonary artery bifurcation and placed in PSS, was always used because it is longer and smaller diameter than the right PA and thus end effects of mounting can more appropriately be ignored. PAs were then mounted in a vessel chamber (LSI; Burlington, VT) on 430 μm outer diameter cannula tubes to the same suture-to-suture, unstretched length (2.4 mm) and stretched 140% to approximate in vivo length based on prior imaging studies and to be consistent with other work (Kobs and Chesler, 2006). The time delay between vessel harvest and vessel mounting was less than 25 min.
Immediately after mounting, vessels equilibrated to 37°C in PSS perfusate and superfusate with a 15 mmHg transmural pressure for 60 minutes to permit recovery. The perfusate was aerated with an air-CO2 mixture to maintain the pH at 7.4 and supplied via a steady flow pump for both protocols. Superfusate was continuously circulated at a rate of 15 mL/min. After equilibrium, wall thickness measurements were made at 10x magnification (resolution = ±1.0 μm) at 5, 15, 30 and 60 mmHg using a video dimension analyzer (Chesler et al., 2004; Kobs et al., 2005). The pressure was then cycled ten times from 5 to 60 mmHg at 1 Hz for mechanical preconditioning. Immediately thereafter, either dose response or mechanical testing was performed. For both protocols, outer diameter was continuously measured at 4x magnification (resolution = ±2.0 μm). At the conclusion of experiments, wall thickness measurements were repeated to confirm accuracy and lack of plastic deformation.
Dose response to Y27632, SNP and U46619
Dose response studies were conducted on arteries from 22 mice (n=11 CTL, n=11 HPH) randomly assigned to vasodilator (n=12) or vasoconstrictor (n=10) groups. Following the equilibrium period and preconditioning, the baseline diameter was determined at a pressure of 15 mmHg. Cumulative U46619, Y27632 and SNP (10−8-10−3M) concentration response curves were created by increasing the drug superfusate concentration every 30 min or when the rate of change of vessel diameter was less than 2 μm/min. For the vasodilator group, the superfusate bath was changed after Y27632 testing, replaced with fresh PSS and equilibrated until the original baseline diameter was obtained. Then, SNP dose response testing was performed. From the concentration response curves, the slope and drug concentrations that induced 50 percent of the maximum effect (EC50) were calculated.
The percent change in diameter was defined relative to the outer diameter (OD) with no drug treatment. The mean logarithmic concentration response curves to drugs were analyzed by fitting a sigmoidal (logistic) equation:
| (1) |
using nonlinear regression to obtain a best fit γ value (Piamsomboon et al., 2007). Contraction time was calculated as the time required for the arteries to reach 50% of the minimum diameter (τ50) after exposure to U46619.
Mechanical Testing Protocol
Mechanical tests were conducted on arteries from 10 mice (n=5 CTL, n=5 HPH). Following the equilibrium period and preconditioning, normal SMC tone state testing was performed; seven, 45-second steps were used with pressures of 10, 20, 30, 40, 50, 60, and 10 mmHg. The measurements during the final step to 10 mmHg were performed to verify the absence of plastic deformation. Each step was followed by a return to 5 mmHg for 10 times the pressure step duration (450 seconds) to eliminate viscoelastic effects (Lakes, 1998). Upstream and downstream luminal pressure, inner diameter, and left and right wall thickness were recorded. Then, U46619 was added to the superfusate to a concentration of 4.5 × 10⁻⁷ M (EC50). After vessel contraction reached a plateau (~30 min), five pressure steps of 10, 30, 40, 60 and 10 mmHg were used. The entire seven step sequence was not used to shorten the duration of constricted state testing. In preliminary studies at a constant pressure, mouse extralobar PAs treated with U46619 remained contracted for 120 minutes. Constricted state testing was completed within 65 minutes.
The superfusate was then replaced with fresh PSS (15 min) and circulated (at least 15 min). Once the vessels returned to baseline, Y27632 was added to the superfusate [1 × 10⁻⁵ M] and after a subsequent 30 min equilibrium period, vessels were tested in the dilated state using the same five steps as in the constricted state. Thereafter, the superfusate was replaced with fresh PSS again and circulated. Once the vessels returned to the baseline diameter, a relaxant solution (Van Breemen’s Relaxant PSS) was circulated for a minimum of 45 min before static testing with the full seven step sequence was performed.
Circumferential stretch (λ) was calculated as the ratio of pressure-dependent, deformed circumference (π OD) to baseline circumference in the normal tone state at a pressure of 5 mmHg (π OD5). Since PAs are prone to collapse at zero transmural pressure, which can damage the endothelium, we used a small but non-zero baseline pressure (5 mmHg) as the reference pressure.
Wall thickness (h) was calculated as a function of pressure assuming conservation of mass as in (Faury et al., 1999). We used h measured at 60 mmHg as the reference because curvature effects reduce the precision of the transillumination-based measurement at low pressures.
Midwall stress and strain were calculated using the thin-walled assumption and Green’s formulation for finite deformation, respectively:
| (2) |
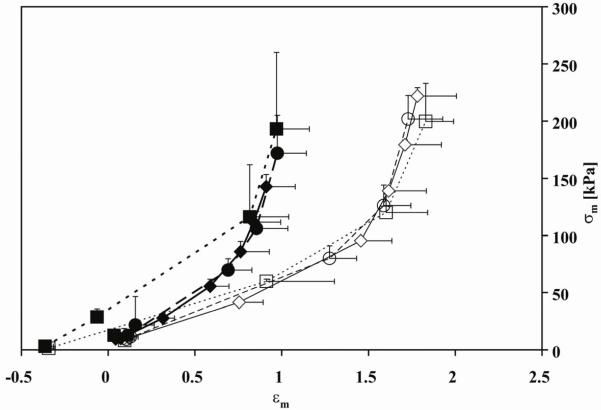
where Rm is the midwall radius at pressure P and Rm5 is the midwall radius at P=5 mmHg in the normal tone state. The advantage of choosing the midwall stress and strain is that the no-load state can be used as the reference state instead of the zero-stress state (Zhao et al., 2002). The low and high strain moduli were determined from the slopes of best fit straight line segments to the low and high strain regions following established methods (Orr et al., 1982); the strain at the intersection point of these lines was used to approximate the transition strain from the low strain region to the high strain region, which also represents the transition from elastin-dominant behavior to collagen-dominant behavior (Lammers et al., 2008).
Circumferential incremental elastic modulus (Einc) was calculated from the pressure-diameter relationship using Hudetz’s modification (Hudetz, 1979) of Love’s formulation of Young’s modulus (Bergel, 1961) for an orthotropic vessel having a non-linear stress-strain relation:
| (3) |
where ID is the inner diameter, P is the pressure at the beginning of the change in pressure, ΔP is the change in pressure between 10 and 30 mmHg, a physiologically relevant range for the mouse pulmonary vasculature (Schwenke et al., 2006), and ΔOD is the corresponding change in outer diameter. Finally, local area compliance (CA) was calculated as the ratio of the cross-sectional area change to pressure change (Westerhof et al., 2005) between 10 and 30 mmHg.
Statistics
Tukey multiple comparisons were used to compare circumferential vessel stretch in constricted, dilated and relaxed states to the normal state. The significance of differences in Einc and CA in response to SMC activation and HPH were assessed using a repeated measures analysis of variance (ANOVA). Values of p<0.05 were considered significant. All statistical analyses were performed using R software (Foundation for Statistical Computing, USA, version 2.6.2). Data are presented in terms of means ± standard deviation. In addition, we quantified the accuracy of the measured variables (P, OD, and h) through total uncertainty. The total uncertainties in P, OD, and h for all the groups were less than the standard deviations (11, 14 and 16% respectively)
RESULTS
Dose response to Y27632, SNP and U46619
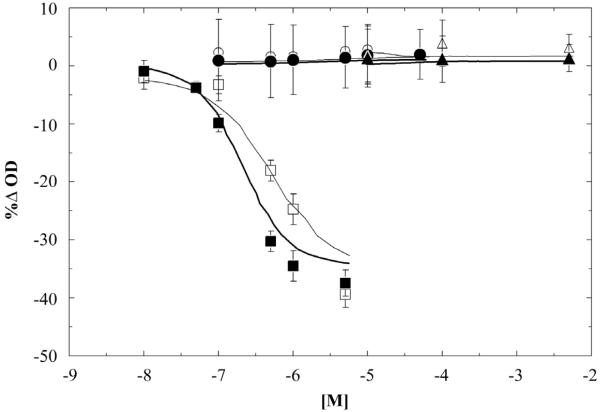
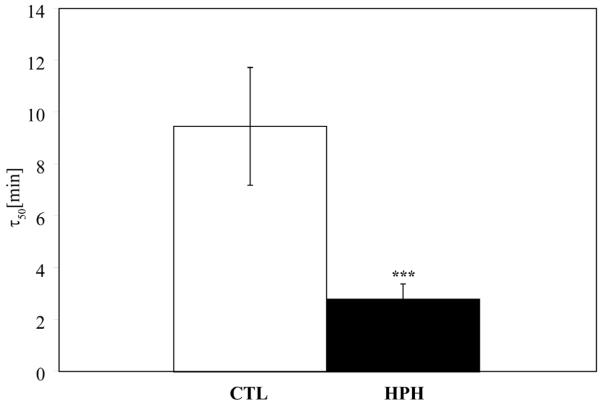
The Rho kinase inhibitor Y27632 and the nitric oxide donor SNP produced no significant change in PA diameter for the range of concentration studied in either the CTL or HPH groups (Figure 1). In contrast, the thromboxane A2 analog U46619 caused a significant and reversible reduction in lumen diameter (Figure 1). The magnitude of the response was similar in CTL and HPH arteries (Figure 1) but HPH arteries contracted significantly more rapidly than control arteries (p<0.0001, Figure 2).
Figure 1.
Dose response-curve for contraction to U46619 (squares) and dilation to Y27632 and SNP (circle and triangle, respectively) in CTL (□,○,△) and HPH (■,●,▲) extralobar PAs. No significant differences were evident between CTL and HPH for any drug or concentrations.
Figure 2.
Time at which the extralobar PAs reach 50% of the minimum diameter (τ50) after exposure to U46619. Bars represent mean± standard deviation. *** P<0.0005 vs. CTL. The time to contraction was dramatically shorter in HPH vessels.
Geometric changes
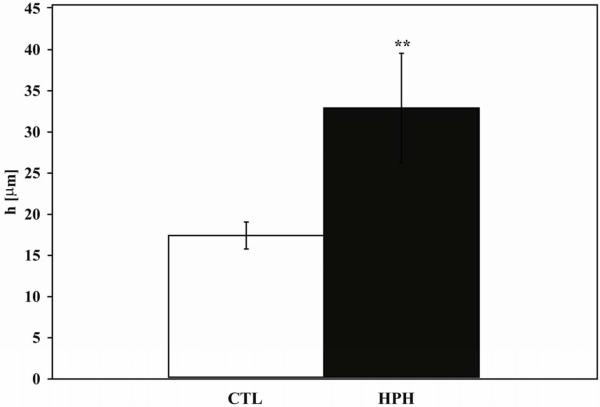
As measured in the normal tone state, HPH caused a significant increase in h (p<0.005; Figure 3) and reduction in size: both outer and inner diameter measured at 60 mmHg decreased with HPH (OD: 1079 ± 24 μm CTL vs. 938 ± 38 μm HPH, p<0.005 and ID: 1047 ± 28 μm CTL vs. 872 ± 27 μm HPH, p<0.001). Consequently, wall thickness to lumen ratio increased significantly with HPH (0.016 ± 0.002 CTL vs. 0.038 ± 0.008 HPH, p<0.05).
Figure 3.
Wall thickness measured at 60 mmHg in the normal tone state. ** P<0.005 vs. CTL condition. The increase of wall thickness is an important contributor to HPH-induced loss of compliance.
Mechanical Tests
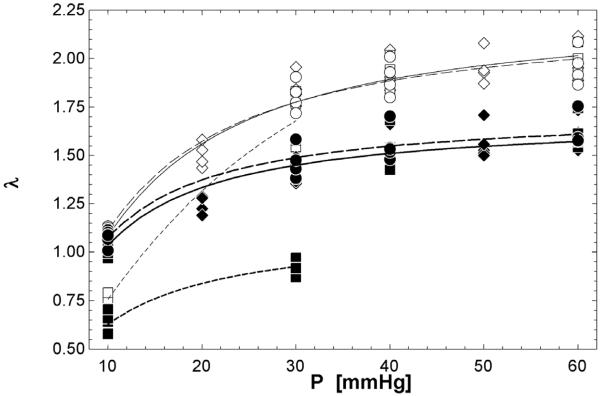
With increasing pressure, circumferential stretch increased as expected for all conditions and groups (Figure 4). In CTL conditions, PAs stretched more in the normal tone state than in the constricted state at low pressure (10 mmHg, p<0.005) but there was no difference for the rest of the pressure range (30-60 mmHg). After exposure to hypoxia, PAs stretched more in the normal state than the constricted state at 10 (p<0.05) and 30 mmHg (p<0.0005).
Figure 4.
Pressure-stretch data. Normal tone (diamonds), constricted (squares) and dilated (circles) states in CTL (◇,□,○) and HPH (◆,■,●) extralobar PAs. Curve fits were based on a modification of Langewouters equation (Langewouters et al., 1984): λ = a1 · tan −1(P · a2) [solid (Normal), dash (Constricted), dash-dot (Dilated)]. For CTL and HPH conditions, the largest difference in circumferential stretch between normal and constricted states occurred within a normal, physiological range of pressure of 10-30 mmHg.
No significant differences in stretch were evident between the normal and relaxed states for either CTL or HPH conditions (Table 1).
Table 1.
Circumferential stretch (λ) as a function of pressure for CTL and HPH extralobar PAs in normal tone (Normal) and relaxed (Relaxed) states. No significant differences were evident between normal and relaxed states
| CTL | HPH | |||
|---|---|---|---|---|
| Normal | Relaxed | Normal | Relaxed | |
| 10 mmHg | 1.11 ± 0.02 | 1.10 ± 0.02 | 1.07 ± 0.02 * | 1.10 ± 0.01 |
| 30 mmHg | 1.84 ± 0.08 | 1.81 ± 0.09 | 1.43 ± 0.06 *** | 1.48 ± 0.07 |
| 40 mmHg | 1.92 ± 0.09 | 1.90 ± 0.09 | 1.53 ± 0.09 *** | 1.56 ± 0.08 |
| 60 mmHg | 1.98 ± 0.10 | 1.96 ± 0.10 | 1.60 ± 0.08 *** | 1.62 ± 0.08 |
| 10 mmHg | 1.07 ± 0.03 | 1.08 ± 0.04 | 1.05 ± 0.03 | 1.07 ± 0.05 |
P<0.05 vs. CTL
P<0.0005 vs. CTL
For all conditions and groups, the typical “J”-shaped strain-stiffening behavior was evident (Figure 5). As each vessel was referenced to the same initial diameter in the normal tone state regardless of its actual state, negative strains occurred in the constricted state. No significant differences in either low or high strain moduli between the normal and dilated states were evident for either CTL or HPH conditions (Table 2). HPH increased low strain modulus in the normal tone state (p<0.05) and tended to increase the high strain modulus. Constriction decreased both low and high strain moduli for both CTL and HPH groups (Table 2). HPH also decreased the strain at which the stress-strain curve transitioned to a steeper slope (0.69± 0.20 HPH vs. 1.48±0.24 CTL in a normal tone state, p<0.005).
Figure 5.
Midwall circumferential stress (σm)-strain (εm) data. Normal tone (diamonds; solid line), constricted (squares; dashed line) and dilated (circles; dotted line) states in CTL (◇,□,○) and HPH (◆,■,●) extralobar PAs. Note the decrease in strain with HPH over the same stress range.
Table 2.
Low and high strain tangent moduli (Elow and Ehigh, respectively) of the midwall circumferential stress-strain curves for normal, constricted and dilated states of CTL and HPH extralobar PAs
| CTL | HPH | |||||
|---|---|---|---|---|---|---|
| Normal | Constricted | Dilated | Normal | Constricted | Dilated | |
| Elow [kPa] | 64 ± 4 | 46 ± 6† | 60 ± 12 | 92 ± 18* | 68 ± 14† | 77 ± 26 |
| Ehigh [kPa] | 517 ± 30 | 358 ± 41† | 581 ± 188 | 543 ± 113 | 317 ± 45†† | 597 ± 47 |
P<0.05 vs. CTL condition
P<0.05 vs. Normal
P<0.0005 vs. Normal
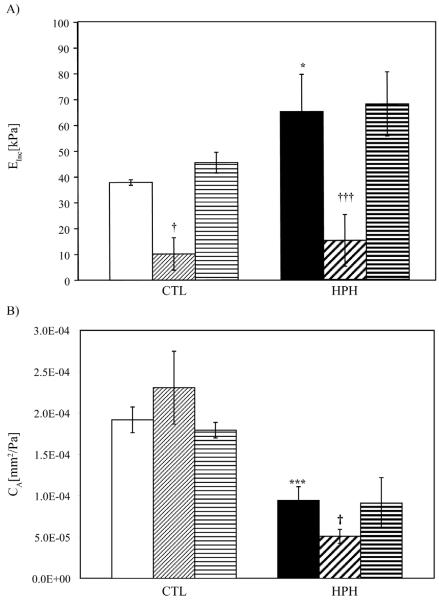
Einc increased significantly with HPH (p<0.05) and decreased with constriction (Figure 6A) following the same pattern as the low and high strain midwall stress-strain moduli. No changes between normal, dilated and relaxed states were observed. CA decreased with HPH (p<0.0005); in CTL PAs, CA was not affected by SMC tone or activation but in the HPH PAs, CA decreased with SMC constriction (p<0.05) (Fig. 6B).
Figure 6.
A) Circumferential incremental elastic modulus (Einc) and B) Local area compliance (CA) from 10 – 30 mmHg for CTL and HPH extralobar PAs. □ (CTL-Normal),  (CTL-Constricted),
  (CTL-Dilated), ■ (HPH-Normal),
  (HPH-Constricted),
  (HPH-Dilated). * P<0.05 vs. CTL condition; *** P<0.0005 vs. CTL condition; † P<0.05 vs. Normal state; ††† P<0.0005 vs. Normal state. SMC constriction decreased Einc, but also decreased diameter and increased wall thickness, such that CA changes were only significant in HPH PAs.
DISCUSSION
The goals of this study were to determine the effects of SMC tone and activation and HPH on changes in biomechanical properties of mouse extralobar pulmonary arteries. Changes in response to flow, hormonal stimuli and neural stimuli were not considered. Our major findings were (1) that extralobar PAs have no appreciable SMC tone, even after 10 days of chronic hypoxia; (2) that the reduction in diameter of large, extralobar PAs caused by U46619 is significant in a physiological pressure range (10-30 mmHg) but not at higher pressures (40-60 mmHg); and (3) that PA biomechanics are significantly altered by HPH and vasoconstriction but not vasodilation or vasorelaxation. An important consequence of these findings is that HPH-induced loss of compliance is the result of arterial narrowing, increased wall thickness and increased elastic modulus, not persistent vasoconstriction.
Y27632 is one of a few vasodilators able to eliminate persistent hypoxic vasoconstriction in small pulmonary arteries (Barman, 2007; Fagan et al., 2004; Nagaoka et al., 2004). In rats exposed to 3-4 weeks of hypoxia, Y27632 caused rings of large pulmonary arteries to dilate, which suggests that HPH increased SMC tone (Nagaoka et al., 2004). The shorter duration of hypoxia used in our study may explain the discrepancy. Interestingly, this would have to occur after other remodelling events such as wall thickening and changes in material properties.
The loss of efficacy of U46619 at higher pressures found here is consistent with results from Ozaki et al. (Ozaki et al., 1998), who found that intrapulmonary artery rings only increased wall tension with SMC activation for pressures of 30 mmHg or less. This is unlikely to be a time-dependent loss of efficacy since our dose response results agree with prior work showing a stable and reproducible constriction for 120 minutes at a constant load (Piamsomboon et al., 2007).
HPH has previously been shown to increase either the maximum response to U46619 or its potency (e.g., EC50) in pulmonary arteries (Jeffery and Wanstall, 2001; Kelly et al., 2005), neither of which were found here. Jeffery and Wanstall found that the effect of U46619 was dependent on hypoxia duration and that adaptation can occur: the contractile response was increased after 1 week of hypoxia but returned to control levels after 4 weeks of hypoxia (Jeffery and Wanstall, 2001). The time to contraction, which was dramatically shorter in HPH vessels compared to CTL vessels (Figure 2), may reflect another aspect of hypoxia duration-dependence. That is, the early effects of HPH on PA SMCs may produce a quicker response to vasoactive agents whereas the later effects result in an increased magnitude of the response.
The third main finding of this study is that HPH and vasoonstriction significantly alter PA biomechanics but vasodilation and vasorelaxation do not (Figure 6, Table 1 and Table 2). In both CTL and HPH arteries, vasoconstriction decreased the incremental elastic modulus (Figure 6) and the low and high strain moduli (Table 2). These decreases are likely due to reduced collagen fiber participation (Barra et al., 1993; Zanchi et al., 1998). The effect of vasoconstriction on local area compliance was modulated by HPH.
Certain limitations are present in this study. It has been previously reported that in vitro measurements may differ considerably from in situ and in vivo measurements of internal diameter (Zanchi et al., 1998). However, the difference we found between CTL and HPH diameter should be unaffected. In addition, residual stresses have been found to exist in rat main PAs (Fung and Liu, 1991); future investigations into the effects of HPH on residual stresses in mouse extralobar PAs are warranted. Finally, we cannot discern which changes in arterial mechanics and SMC reactivity were caused by chronic hypoxia itself and which were caused by the chronic hypoxia-induced hypertension.
In summary, independent of SMC tone, 10 days of chronic hypoxia caused narrowing and stiffening of large, extrapulmonary, conduit arteries, which may be important factors in the development of right ventricular failure in pulmonary hypertension.
ACKNOWLEDGEMENTS
The present study was supported in part by DNP-Fulbright-Colciencias program and Universidad de los Andes-Colombia (DMT), the Belgium-Luxembourg Fulbright Scholar Program (NCC) and National Institutes of Heath grants R01HL086939 (NCC) and 1UL1RR025011 (from the Clinical and Translational Science Award program of the National Center for Research Resources).
Footnotes
Publisher's Disclaimer: This is a PDF file of an unedited manuscript that has been accepted for publication. As a service to our customers we are providing this early version of the manuscript. The manuscript will undergo copyediting, typesetting, and review of the resulting proof before it is published in its final citable form. Please note that during the production process errors may be discovered which could affect the content, and all legal disclaimers that apply to the journal pertain.
DISCLOSURES
None
REFERENCES
- Bailly K, Ridley AJ, Hall SM, Haworth SG. RhoA activation by hypoxia in pulmonary arterial smooth muscle cells is age and site specific. Circulation Research. 2004;10:1383–1391. doi: 10.1161/01.RES.0000128405.83582.2e. [DOI] [PubMed] [Google Scholar]
- Bank AJ, Kaiser DR. Smooth muscle relaxation: effects on arterial compliance, distensibility, elastic modulus, and pulse wave velocity. Hypertension. 1998;2:356–359. doi: 10.1161/01.hyp.32.2.356. [DOI] [PubMed] [Google Scholar]
- Barbera JA, Peinado VI, Santos S. Pulmonary hypertension in chronic obstructive pulmonary disease. The European Respiratory Journal: Official Journal of the European Society for Clinical Respiratory Physiology. 2003;5:892–905. doi: 10.1183/09031936.03.00115402. [DOI] [PubMed] [Google Scholar]
- Barman SA. Vasoconstrictor effect of endothelin-1 on hypertensive pulmonary arterial smooth muscle involves Rho-kinase and protein kinase C. American Journal of Physiology.Lung Cellular and Molecular Physiology. 2007;2:L472–9. doi: 10.1152/ajplung.00101.2006. [DOI] [PubMed] [Google Scholar]
- Barnes PJ, Liu SF. Regulation of pulmonary vascular tone. Pharmacological Reviews. 1995;1:87–131. [PubMed] [Google Scholar]
- Barra JG, Armentano RL, Levenson J, Fischer EI, Pichel RH, Simon A. Assessment of smooth muscle contribution to descending thoracic aortic elastic mechanics in conscious dogs. Circulation Research. 1993;6:1040–1050. doi: 10.1161/01.res.73.6.1040. [DOI] [PubMed] [Google Scholar]
- Benumof JL. One-lung ventilation and hypoxic pulmonary vasoconstriction: implications for anesthetic management. Anesthesia and Analgesia. 1985;8:821–833. [PubMed] [Google Scholar]
- Bergel DH. The static elastic properties of the arterial wall. The Journal of Physiology. 1961;3:445–457. doi: 10.1113/jphysiol.1961.sp006686. [DOI] [PMC free article] [PubMed] [Google Scholar]
- Bialecki RA, Fisher CS, Murdoch WW, Barthlow HG, Stow RB, Mallamaci M, Rumsey W. Hypoxic exposure time dependently modulates endothelin-induced contraction of pulmonary artery smooth muscle. The American Journal of Physiology. 1998;4(Pt 1):L552–9. doi: 10.1152/ajplung.1998.274.4.L552. [DOI] [PubMed] [Google Scholar]
- Bonnet S, Belus A, Hyvelin JM, Roux E, Marthan R, Savineau JP. Effect of chronic hypoxia on agonist-induced tone and calcium signaling in rat pulmonary artery. American Journal of Physiology.Lung Cellular and Molecular Physiology. 2001;1:L193–201. doi: 10.1152/ajplung.2001.281.1.L193. [DOI] [PubMed] [Google Scholar]
- Chesler NC, Thompson-Figueroa J, Millburne K. Measurements of mouse pulmonary artery biomechanics. Journal of Biomechanical Engineering. 2004;2:309–314. doi: 10.1115/1.1695578. [DOI] [PubMed] [Google Scholar]
- Cox RH. Viscoelastic properties of canine pulmonary arteries. The American Journal of Physiology. 1984;1(Pt 2):H90–6. doi: 10.1152/ajpheart.1984.246.1.H90. [DOI] [PubMed] [Google Scholar]
- Fagan KA, Oka M, Bauer NR, Gebb SA, Ivy DD, Morris KG, McMurtry IF. Attenuation of acute hypoxic pulmonary vasoconstriction and hypoxic pulmonary hypertension in mice by inhibition of Rho-kinase. American Journal of Physiology.Lung Cellular and Molecular Physiology. 2004;4:L656–64. doi: 10.1152/ajplung.00090.2003. [DOI] [PubMed] [Google Scholar]
- Faury G, Maher GM, Li DY, Keating MT, Mecham RP, Boyle WA. Relation between outer and luminal diameter in cannulated arteries. The American Journal of Physiology. 1999;5(Pt 2):H1745–53. doi: 10.1152/ajpheart.1999.277.5.H1745. [DOI] [PubMed] [Google Scholar]
- Fraser KL, Tullis DE, Sasson Z, Hyland RH, Thornley KS, Hanly PJ. Pulmonary hypertension and cardiac function in adult cystic fibrosis: role of hypoxemia. Chest. 1999;5:1321–1328. doi: 10.1378/chest.115.5.1321. [DOI] [PubMed] [Google Scholar]
- Fung YC, Liu SQ. Changes of zero-stress state of rat pulmonary arteries in hypoxic hypertension. Journal of Applied Physiology (Bethesda, Md.: 1985) 1991;6:2455–2470. doi: 10.1152/jappl.1991.70.6.2455. [DOI] [PubMed] [Google Scholar]
- Gan CT, Lankhaar JW, Westerhof N, Marcus JT, Becker A, Twisk JW, Boonstra A, Postmus PE, Vonk-Noordegraaf A. Noninvasively assessed pulmonary artery stiffness predicts mortality in pulmonary arterial hypertension. Chest. 2007;6:1906–1912. doi: 10.1378/chest.07-1246. [DOI] [PubMed] [Google Scholar]
- Hiestand D, Phillips B. The overlap syndrome: chronic obstructive pulmonary disease and obstructive sleep apnea. Critical Care Clinics. 2008;3:551–63. vii. doi: 10.1016/j.ccc.2008.02.005. [DOI] [PubMed] [Google Scholar]
- Hudetz AG. Incremental elastic modulus for orthotropic incompressible arteries. Journal of Biomechanics. 1979;9:651–655. doi: 10.1016/0021-9290(79)90015-0. [DOI] [PubMed] [Google Scholar]
- Jeffery TK, Wanstall JC. Comparison of pulmonary vascular function and structure in early and established hypoxic pulmonary hypertension in rats. Canadian Journal of Physiology and Pharmacology. 2001;3:227–237. [PubMed] [Google Scholar]
- Kawahara Y, Tanonaka K, Daicho T, Nawa M, Oikawa R, Nasa Y, Takeo S. Preferable anesthetic conditions for echocardiographic determination of murine cardiac function. Journal of Pharmacological Sciences. 2005;1:95–104. doi: 10.1254/jphs.fp0050343. [DOI] [PubMed] [Google Scholar]
- Kelly DA, Hislop AA, Hall SM, Haworth SG. Relationship between structural remodeling and reactivity in pulmonary resistance arteries from hypertensive piglets. Pediatric Research. 2005;3:525–530. doi: 10.1203/01.pdr.0000176928.54471.07. [DOI] [PubMed] [Google Scholar]
- Kobs RW, Chesler NC. The mechanobiology of pulmonary vascular remodeling in the congenital absence of eNOS. Biomechanics and Modeling in Mechanobiology. 2006;4:217–225. doi: 10.1007/s10237-006-0018-1. [DOI] [PubMed] [Google Scholar]
- Kobs RW, Muvarak NE, Eickhoff JC, Chesler NC. Linked mechanical and biological aspects of remodeling in mouse pulmonary arteries with hypoxia-induced hypertension. American Journal of Physiology.Heart and Circulatory Physiology. 2005;3:H1209–17. doi: 10.1152/ajpheart.01129.2003. [DOI] [PubMed] [Google Scholar]
- Lakes RS. Viscoelastic solids. CRC Press; Boca Raton: 1998. [Google Scholar]
- Lammers SR, Kao PH, Qi HJ, Hunter K, Lanning C, Albietz J, Hofmeister S, Mecham R, Stenmark KR, Shandas R. Changes in the structure-function relationship of elastin and its impact on the proximal pulmonary arterial mechanics of hypertensive calves. American Journal of Physiology.Heart and Circulatory Physiology. 2008;4:H1451–9. doi: 10.1152/ajpheart.00127.2008. [DOI] [PMC free article] [PubMed] [Google Scholar]
- Langewouters GJ, Wesseling KH, Goedhard WJ. The static elastic properties of 45 human thoracic and 20 abdominal aortas in vitro and the parameters of a new model. Journal of Biomechanics. 1984;6:425–435. doi: 10.1016/0021-9290(84)90034-4. [DOI] [PubMed] [Google Scholar]
- Mahapatra S, Nishimura RA, Oh JK, McGoon MD. The prognostic value of pulmonary vascular capacitance determined by Doppler echocardiography in patients with pulmonary arterial hypertension. Journal of the American Society of Echocardiography : Official Publication of the American Society of Echocardiography. 2006;8:1045–1050. doi: 10.1016/j.echo.2006.03.008. [DOI] [PubMed] [Google Scholar]
- Nagaoka T, Morio Y, Casanova N, Bauer N, Gebb S, McMurtry I, Oka M. Rho/Rho kinase signaling mediates increased basal pulmonary vascular tone in chronically hypoxic rats. American Journal of Physiology.Lung Cellular and Molecular Physiology. 2004;4:L665–72. doi: 10.1152/ajplung.00050.2003. [DOI] [PubMed] [Google Scholar]
- Nichols WW, O’Rourke M. McDonald’s Blood Flow in Arteries: Theoretical, Experimental and Clinical Principles. 1998. [Google Scholar]
- Orr GW, Green HJ, Hughson RL, Bennett GW. A computer linear regression model to determine ventilatory anaerobic threshold. Journal of Applied Physiology: Respiratory, Environmental and Exercise Physiology. 1982;5:1349–1352. doi: 10.1152/jappl.1982.52.5.1349. [DOI] [PubMed] [Google Scholar]
- Ozaki M, Marshall C, Amaki Y, Marshall BE. Role of wall tension in hypoxic responses of isolated rat pulmonary arteries. The American Journal of Physiology. 1998;6(Pt 1):L1069–77. doi: 10.1152/ajplung.1998.275.6.L1069. [DOI] [PubMed] [Google Scholar]
- Piamsomboon C, Tanaka KA, Szlam F, Makita T, Huraux C, Levy JH. Comparison of relaxation responses to multiple vasodilators in TxA(2)-analog and endothelin-1-precontracted pulmonary arteries. Acta Anaesthesiologica Scandinavica. 2007;6:714–721. doi: 10.1111/j.1399-6576.2007.01328.x. [DOI] [PubMed] [Google Scholar]
- Preston IR. Clinical perspective of hypoxia-mediated pulmonary hypertension. Antioxidants & Redox Signaling. 2007;6:711–721. doi: 10.1089/ars.2007.1587. [DOI] [PubMed] [Google Scholar]
- Robertson TP, Dipp M, Ward JP, Aaronson PI, Evans AM. Inhibition of sustained hypoxic vasoconstriction by Y-27632 in isolated intrapulmonary arteries and perfused lung of the rat. British Journal of Pharmacology. 2000;1:5–9. doi: 10.1038/sj.bjp.0703537. [DOI] [PMC free article] [PubMed] [Google Scholar]
- Schwenke DO, Pearson JT, Mori H, Shirai M. Long-term monitoring of pulmonary arterial pressure in conscious, unrestrained mice. Journal of Pharmacological and Toxicological Methods. 2006;3:277–283. doi: 10.1016/j.vascn.2005.11.003. [DOI] [PubMed] [Google Scholar]
- Stenmark KR, Fagan KA, Frid MG. Hypoxia-induced pulmonary vascular remodeling: cellular and molecular mechanisms. Circulation Research. 2006;7:675–691. doi: 10.1161/01.RES.0000243584.45145.3f. [DOI] [PubMed] [Google Scholar]
- Thomas BJ, Wanstall JC. Alterations in pulmonary vascular function in rats exposed to intermittent hypoxia. European Journal of Pharmacology. 2003;2:153–161. doi: 10.1016/j.ejphar.2003.08.015. [DOI] [PubMed] [Google Scholar]
- Tuchscherer HA, Vanderpool RR, Chesler NC. Pulmonary vascular remodeling in isolated mouse lungs: effects on pulsatile pressure-flow relationships. Journal of Biomechanics. 2007;5:993–1001. doi: 10.1016/j.jbiomech.2006.03.023. [DOI] [PubMed] [Google Scholar]
- Wang J, Weigand L, Foxson J, Shimoda LA, Sylvester JT. Ca2+ signaling in hypoxic pulmonary vasoconstriction: effects of myosin light chain and Rho kinase antagonists. American Journal of Physiology.Lung Cellular and Molecular Physiology. 2007;3:L674–85. doi: 10.1152/ajplung.00141.2007. [DOI] [PubMed] [Google Scholar]
- Weitzenblum E, Chaouat A. Sleep and chronic obstructive pulmonary disease. Sleep Medicine Reviews. 2004;4:281–294. doi: 10.1016/j.smrv.2004.03.006. [DOI] [PubMed] [Google Scholar]
- Westerhof N, Stergiopulos N, Noble M. Snapshots of Hemodynamics: An aid for clinical research and graduate education. 2005. [Google Scholar]
- Wilkinson IB, Franklin SS, Cockcroft JR. Nitric oxide and the regulation of large artery stiffness: from physiology to pharmacology. Hypertension. 2004;2:112–116. doi: 10.1161/01.HYP.0000138068.03893.40. [DOI] [PubMed] [Google Scholar]
- Wojciak-Stothard B. New drug targets for pulmonary hypertension: Rho GTPases in pulmonary vascular remodelling. Postgraduate Medical Journal. 2008;993:348–353. doi: 10.1136/pgmj.2007.066555. [DOI] [PubMed] [Google Scholar]
- Zanchi A, Stergiopulos N, Brunner HR, Hayoz D. Differences in the mechanical properties of the rat carotid artery in vivo, in situ, and in vitro. Hypertension. 1998;1:180–185. doi: 10.1161/01.hyp.32.1.180. [DOI] [PubMed] [Google Scholar]
- Zhao J, Day J, Yuan ZF, Gregersen H. Regional arterial stress-strain distributions referenced to the zero-stress state in the rat. American Journal of Physiology.Heart and Circulatory Physiology. 2002;2:H622–9. doi: 10.1152/ajpheart.00620.2000. [DOI] [PubMed] [Google Scholar]


