

Abstract
Merkel cell polyomavirus (MCPyV) was recently discovered in Merkel cell carcinoma (MCC), a clinically and pathologically heterogeneous malignancy of dermal neuroendocrine cells. To investigate this heterogeneity, we developed a tissue microarray (TMA) to characterize immunohistochemical staining of candidate tumor cell proteins and a quantitative PCR assay to detect MCPyV and measure viral loads. MCPyV was detected in 19 of 23 (74%) primary MCC tumors, but 8 of these had less than 1 viral copy per 300 cells. Viral abundance of 0.06–1.2viral copies/cell was directly related to presence of retinoblastoma gene product (pRb) and terminal deoxyribonucleotidyl transferase (TdT) by immunohistochemical staining (P≤0.003). Higher viral abundance tumors tended to be associated with less p53 expression, younger age at diagnosis, and longer survival (P≤0.08). These data suggest that MCC may arise through different oncogenic pathways, including ones independent of pRb and MCPyV.
Keywords: Merkel cell carcinoma, polyomavirus, skin cancer, etiology
Introduction
In 2008, Feng et al. (1) reported a polyoma virus associated with ~80% of Merkel cell carcinoma (MCC) tissues. This virus, provisionally designated Merkel cell polyomavirus (MCPyV), may be the etiological agent of MCC (2–6). Like the prototypic polyomavirus simian virus 40 (SV40) (7, 8), the oncogenic potential of MCPyV may reside in expression and interaction of its T antigen with the cellular retinoblastoma tumor suppressor protein (pRb) (6). Links between human cancers, SV40 and four other established human polyoma viruses (BK, JC, WU and KI), that all encode homologous T antigens, remain controversial (7–10). MCPyV DNA is found in 2–10% of diverse non-MCC tissues, suggesting that MCPyV is neither rare nor restricted to tumor cells and may have a natural reservoir in skin (1, 4–6). Initial evidence, particularly clonally integrated MCPyV DNA in MCC, as well as tumor-specific mutations in large T antigen (1, 6), make a convincing case for its role in human cancer. Integrated viral genome in most tumor cells in the majority of MCC cases supports a broad etiological link between MCPyV and MCC.
However, MCC is heterogeneous clinically, morphologically and in expression of neuroendocrine, epithelial and oncogenic markers (11–13). MCC cell lines point to at least two biologically discrete MCC subgroups (14). “Classic” MCC cell lines grown in vitro manifest a non-adherent, clustered morphology; variant MCC lines lose expression of neuroendocrine markers and grow as adherent cells. Gene expression analyses illustrate heterogeneity in protein expression (15). Classic subtypes have higher levels of transcripts for genes with kinase activity and signal transduction receptors; variant MCC cell lines have higher expression of cell cycle genes (c-myc and cyclin D1). The association of MCPyV with “classic” but not variant MCC cell lines (6) suggests differences in oncogenesis.
We conducted a pilot study to determine if association of MCPyV in MCC correlates with MCC biomarker profile or with protein markers including pRb (postulated relevance to MCC oncogenesis) and p53 expression distribution. Archival formalin-fixed paraffin-embedded tissue (FFPET) specimens were tested for the presence and amount of MCPyV DNA. The same tissue samples were independently and blindly stained for panels of antibody markers using immunohistochemistry (IHC), and data from these two set of analyses were correlated with patient characteristics.
Materials and Methods
Study Population
Twenty three patients with MCC and sufficient retained FFPET blocks were identified from the tissue archives of The Ohio State University Medical Center (1994–2007) by the Pathology Archive Service. Patient characteristics at time of diagnosis were mean age 77 (range 57–90) years; 17 were male and 6 were female. Controls included DNA from 12 colon carcinomas, 20 breast cancers and 20 peripheral blood lymphocyte samples from an unrelated set of patients. The Ohio State University Cancer Institutional Review Board and the National Institutes of Health, Office of Human Subjects Research approved the use of these de-identified specimens.
Tissue Study Set
Twenty-five MCC FFPET blocks along with masked interspersed MCC case duplicates (9 synchronous, metachronous or recurrent tumors from four patients) were assembled for a panel of 34 tumors. Separately assembled were tissue blocks with 26 non-tumor skin samples from 13 cases. Three consecutive 10uM sections for DNA isolation for the viral abundance assay were harvested from these blocks. Tissue morphology (H&E) in cut sections immediately before and after tissue harvest confirmed largely tumor tissue with little necrosis (pathologist LWA).
DNA extraction
Ten micron thick sections (3 each) were de-paraffinized for 30 min followed by washing with acetone for 10 min. After drying, samples were treated with proteinase K overnight at 55 C. DNA was precipitated using isopropanol and pelleted using centrifugation. Dried DNA pellet was dissolved in 50ul of TE.
Real Time PCR assay for MCPyV
Taqman PCR primers and dual-labeled (FAM/VIC/TET and TAMRA) probes were designed using the published MCPyV sequence EU375804 of the genome of MCC339. PrimerExpressÔ software from Applied Biosystems was used to define the optimal targeted amplicon from the small T antigen (nucleotides 606 to 702). Probes were selected that have a predicted Tm near 68°C, with the polymorphic base near the center. Flanking PCR primers were selected based on a calculated penalty score, Tm, length, and amplimer size. The MCPYV forward primer used in the reaction was GCAAAAAAACTGTCTGACGTGG and the reverse primer was CCACCAGTCAAAACTTTCCCA. The probe sequence was TATCAGTGCTTTATTCTTTGGTTTGGATTTCCTCCT.
Each reaction (10µl) contained 10ng of genomic DNA, 1× TaqMan™ Master Mix, dual-labeled probe (100nM each), and PCR primers (900nM each). Reactions were performed in 96-well MicroAmp® Optical reaction plates and caps (PE Biosystems). Plates were incubated at 50°C for 15 minutes, 95°C for 10 minutes, followed by 40 cycles of 95°C for 15 seconds and 60°C for 1 minute. Data were analyzed with Sequence Detection System version 1.6.3. Laboratory personnel were blinded to case and control status of the samples. Samples were analyzed at two different concentrations and in duplicate. Quantification of MCPYV in the samples was performed using a known quantity of positive control sample (Genomic DNA from MCC sample from which MCPyV 350 was originally isolated- kindly provided by Dr Moore, University of Pittsburgh, USA). A ten-fold dilution of this sample was used to generate a standard curve to determine the quantity of MCPYV in each sample. The amounts used were 100ng, 10ng, 1ng and 0.1ng. The MCPYV quantity was normalized among all the samples for concentration of human DNA by using a probe to detect single copy human gene RNAse P. A standard curve using a ten-fold dilution series of human DNA samples was generated. The amounts used were 100ng, 10ng, 1ng and 0.1ng. All the reactions were performed in duplex to detect MCPYV and RNAse P. The primer and probe sequences for Rnase P are as follows; forward primer sequence: AGATTTGGACCTGCGAGCG; reverse primer sequence: GAGCGGCTGTCTCCACAAGT; labeled probe sequence: 5’ FAM-TTCTGACCTGAAGGCTCTGCGCG. All data were analyzed by SDS software developed by Applied BioSystems, Foster City, CA.
Biomarker Analyses of MCC tissues
A tissue microarray (TMA) was constructed from the tissue study and appropriate tissue controls. TMA cut sections were stained for tissue morphology quality by H&E, MCC common diagnostic biomarkers, and cell cycle proteins of potential interest. Detailed information regarding the antibodies used and their source is provided in Table 1. Biomarkers were: neuron-specific enolase (NSE), synaptophysin, chromogranin, cytokeratin markers [CAM 5.2, AE 1/3, MAK6, CK 20, CK7(13)], epithelial membrane antigens (EMA, Ber-EP4) and a second antibody (IHC) panel selected for relevance to MCPyV pathogenesis or to previously demonstrated heterogeneity in expression in MCC. Included in this latter group were retinoblastoma protein (pRb) (6); TdT reported to be aberrantly expressed in 8/15 cases (16), CD44 suggested to correlate with risk of metastases (17) and p53 previously reported to range in positivity from 5–25% (18). The expression patterns of these markers were correlated with the presence and the relative abundance of MCPyV DNA. Thyroid-transcription factor (TTF-1) and glycoprotein CD99-013 and CD 99-mic 2 were included to exclude malignancies with similar morphology. The IHC grades for tumor cell staining were: negative (−) with no or <5% light staining of tumor cells, weakly positive (+) where 50% tumor cells show light staining intensity, positive (++) where >50% tumor cells show moderate staining intensity, strongly positive (+++) where >50% tumor cells show strong staining intensity.
Table 1.
Antibodies used for immunochemical detection of cell proteins.
| Antibody to: | Manufacturer* | Dilution 1: | Antigen retrieval method |
|
|---|---|---|---|---|
| B-cell CLL/lymphoma 2 (BCL-2) gene | Dako | 5 | Dako TRS | |
| Chromogranin | Dako | 200 | Dako TRS | |
| Cytokeratin | AE1/AE3 | Dako | 100 | Dako TRS |
| CAM 5.2 | Becton Dickinson |
10 | Dako TRS | |
| CK20 | Dako | 250 | Dako TRS | |
| CK7 | Dako | 150 | Dako TRS | |
| MAK 6 | Zymed | 2 | Dako TRS | |
| Epithelial membrane antigen (EMA) | Dako | 200 | Dako TRS | |
| Glycoprotein | CD99 013 | Signet | 300 | Dako TRS |
| CD99-mic2 | Dako | 200 | Dako TRS | |
| BER EP4 | Dako | 400 | Dako TRS | |
| CD44 | Dako | 10 | Dako TRS | |
| Neuron cell adhesion molecule (NCAM) CD56 |
Novocastra | 50 | Dako TRS | |
| Neuron-specific enolase (NSE) | Dako | 200 | Dako TRS | |
| Proliferation protein Ki-67 (MIB1) | Dako | 150 | Dako TRS | |
| Cell cycle proteins |
p21waf1/cip1 | Dako | 50 | Dako pH 9.0 |
| p27kip1 | Dako | 50 | Dako TRS | |
| Retinoblastoma protein (pRb) | Novocastra | 25 | Dako TRS | |
| Synaptophysin | Dako | 150 | Dako TRS | |
| Terminal Deoxynucleotidyl Transferase (TdT) |
Dako | 25 | Dako TRS | |
| Thyroid transcription factor-1 (TTF-1) | Dako | 40 | Dako TRS | |
| Tumor suppressor gene p53 | Dako | 50 | Dako TRS | |
Dako, Carpinteria, CA USA; Becton Dickinson, San Jose, California, USA; Zymed Laboratories, San Francisco, USA.; Signet, Emeryville, California, USA. and Novocastra, Newcastle upon Tyne, UK..
The PCR and IHC laboratories were masked to each other’s data. Appropriate positive and negative controls were included for each antibody. All IHC results were interpreted and analyzed by a single pathologist (LWA).
Results and Discussion
Real Time PCR analyses for MCPyV
Serial dilutions of genomic DNA from a fresh frozen MCC tissue sample associated with the MCV350 strain were employed to calibrate the real time PCR method. The reference curve, ranging 0.1–10 ng genomic DNA, corresponded to 10–1000 cells (as determined by simultaneous amplification of the human RNaseP gene). MCPyV (confirmed by sequencing) was readily detected by this assay in fresh frozen MCC tissue but in only 1/52 non-MCC controls (DNA samples from 12 colon cancers, 20 breast cancers, and 20 normal peripheral blood lymphocytes).
MCPyV DNA was detected in 28/35 MCC samples, including 17 (74%) of 23 MCC individual cases. The range of viral abundance (amount of viral DNA/amount of cellular DNA) in these samples was 0– 1.2 with a mean and median viral abundance of 0.1275 and 0.001, respectively. (Table 2)
Table 2.
Viral abundance of Merkel cell polyoma virus (MCPyV) and expression of selected tumor proteins in 23 Merkel cell carcinoma cases.
| Identifier | MCPyV DNA viral copies/cell |
CK20 | BER EP4 |
CD56 | Chromo- granin |
CD44 | pRb | TdT | CK7 | p53 |
|---|---|---|---|---|---|---|---|---|---|---|
| 23 | 1.2 | ++ | ++ | ++ | +++ | ++ | ++ | ++ | − | ++ |
| 28 | 1 | ++ | ++ | ++ | + | − | ++ | ++ | − | + |
| 7 | 0.33 | ++ | ++ | − | +++ | ++ | ++ | − | − | ++ |
| 4 | 0.2 | ++ | − | ++ | + | ++ | ++ | ++ | − | + |
| 24 | 0.145 | ++ | ++ | ++ | ++ | ++ | ++ | * | − | ++ |
| 21 | 0.09 | ++ | ++ | ++ | +++ | ++ | ++ | − | − | + |
| 32 | 0.08 | ++ | − | ++ | + | + | ++ | ++ | − | + |
| 5 | 0.07 | ++ | ++ | ++ | ++ | ++ | ++ | − | − | + |
| 34 | 0.06 | ++ | ++ | + | + | ++ | ++ | ++ | − | + |
| 30 | 0.0035 | − | + | ++ | − | − | − | − | − | ++ |
| 29 | 0.0025 | ++ | + | ++ | + | − | − | − | − | +++ |
| 17 | 0.001 | − | + | ++ | + | ++ | − | − | − | − |
| 15 | 0.001 | + | + | ++ | + | − | − | − | ++ | +++ |
| 22 | 0.001 | ++ | ++ | ++ | + | ++ | − | − | − | − |
| 25 | 0.0005 | + | + | − | − | ++ | − | − | − | +++ |
| 1 | 0.0005 | + | ++ | − | + | − | − | − | ++ | ++ |
| 20 | 0.0005 | + | ++ | ++ | + | − | − | − | ++ | +++ |
| 10 | 0 | + | − | ++ | − | + | − | − | − | ++ |
| 11 | 0 | ++ | ++ | − | − | ++ | − | − | − | ++ |
| 13 | 0 | ++ | ++ | ++ | + | − | − | − | − | ++ |
| 19 | 0 | ++ | ++ | ++ | + | − | − | − | − | − |
| 8 | 0 | ++ | ++ | ++ | ++ | + | − | − | ++ | +++ |
| 26 | 0 | ++ | ++ | ++ | − | − | − | − | ++ | +++ |
missing data
MCPyV DNA in the positive samples presented a discontinuous association of MCPyV abundance (Fig 1). Two distinct sub-groups of MCPyV positive tumors were discerned. Nine MCC samples had higher levels of MCPyV DNA (median 0.145 copy/cell) than 8 samples with very low levels of MCPyV DNA (median 0.001). No MCPyV DNA was detected in the remaining 6 MCC samples.
Figure 1.
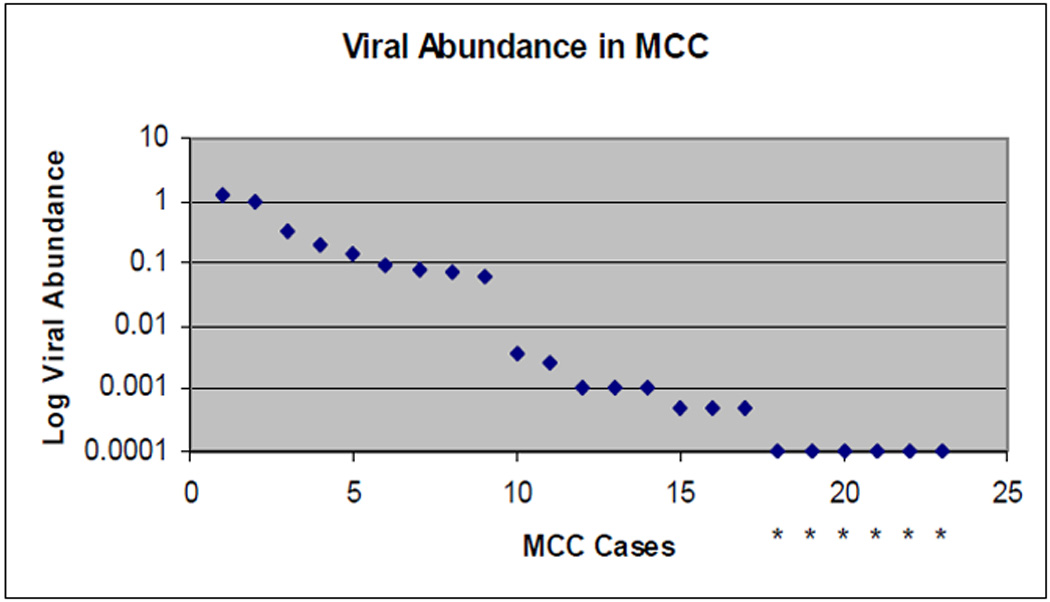
Distribution of MCPyV DNA level in virus positive MCC tumors. Copies of MCPyV DNA, standardized to copies of a cellular gene (RNAse P) are plotted on a logarithmic scale. Analytic sensitivity was 0.0005 viral copies/cell. Six MCC tumors were below this level and are identified by an asterisk.
Concordance of viral-abundance was very high (coefficient of variation 0.11–0.26) in blinded duplicate samples from four patients (Table 3). MCPyV DNA was also detected in 1/26 uninvolved skin samples from MCC patients, with very low viral abundance (0.0003 copy/cell) (data not shown).
Table 3.
Concordance of viral copy number in same patients
| Patient | Identifier | MCPyV DNA viral copies/cell |
Tissue |
|---|---|---|---|
| A | 1 | 0.0005 | hand |
| 2 | 0.00025 | ||
| B | 6 | 0.34 | eyelid |
| 7 | 0.33 | ||
| C | 27 | 0.9 | forearm |
| 28 | 1 | ||
| D | 31 | 0.07 | arm |
| 32 | 0.08 | ||
| 33 | 0.07 |
Tissue Biomarkers (IHC)
All tumor tissues in this study met criteria for MCC diagnosis. Classic morphologic types were represented, and all were TTF-1 and CD99-013/CD 99-mic 2 negative. Staining for neuron-specific enolase, synaptophysin and most cytokeratins (CAM 5.2, MAK-6 and AE 1/3) were positive in all samples. Some biomarkers were associated with variable positive and negative results; these are shown in Table 2 arranged by decreasing viral abundance. Chromogranin expression was positive or strongly positive in all tumors with higher viral abundance, including 18/23 positive overall. Epithelial markers EMA/BER EP4 stained positive in 20/23 cases. Similarly, the neural cell adhesion molecule CD56 stained positively in 19/23. CK 20 was uniformly positive for perinuclear punctuate staining in all but two cases with lower viral abundance. CK7 was positive only in some of the low/no viral abundance tumors.
Two MCC subgroups were readily distinguished by pRb expression; 9 positive, 14 negative (Table 2 and Figure 2). pRb-positive MCC tumors had relatively high levels of MCPyV DNA (median 0.145 copy/cell); MCPyV DNA was detected at very low levels (n=8, median 0.001) or not detected (n=6) in the pRb-negative tumors. TdT expression was observed in 5 of 8 pRb-positive tumors but in none of the pRb negative tumors. MCPyV viral-abundance was significantly associated with pRb and TdT expression (P<0.0001 and P=0.003, respectively, by Kruskal-Wallis). Higher viral abundance, pRb-expressing tumors were associated with higher CD44 expression (Wilcoxon P=0.02), absent CK7 expression (P=0.05), and lower p53 expression (P=0.06). Viral copy number was not related to the quantity (size) of tumor tissue in the DNA/PCR sample (Spearman R=−0.20, P=0.24).
Figure 2.
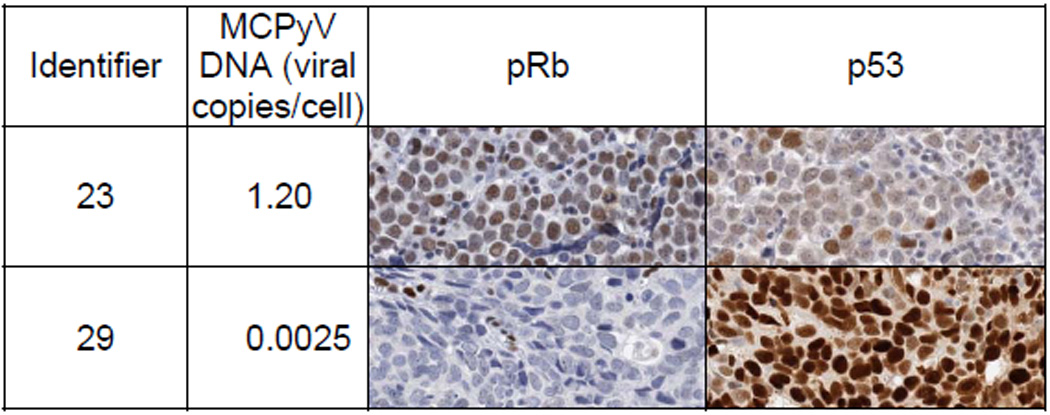
Illustrative examples of correlation between immunohistochemical expression of pRb and p53 in MCC with high and low viral abundance.
Clinical associations
We investigated whether selected MCC clinical characteristics differed between the two MCC subgroups (Table 4). The higher viral abundance, pRb-expressing subgroup tended to be younger (P=0.07) but did not differ by sex (P=0.64). MCC primary site, cell type, and presence of positive lymph nodes (either sentinel nodes or nodes in regional lymph node dissections) also did not differ by subgroup. Distant metastases occurred in 22% of patients with higher abundance, pRb-expressing tumors, compared to 43% of the other patients (P=0.4). Corresponding median survival times were 86 months and 20 months, respectively (Kaplan-Meier log-rank P=0.015). Adjusted for age, the relative hazard for death was 0.15 (95% confidence interval 0.02–1.24, P=0.08) with higher abundance, pRb-expressing tumors.
Table 4.
Viral abundance of Merkel cell polyoma virus (MCPyV) and patient and clinical characteristics
| Identifier | MCPyV DNA viral copies/cell |
Patient and clinical characteristics | ||||||||
|---|---|---|---|---|---|---|---|---|---|---|
| Age | Gender | Primary | Cell type | Sentinal LN |
Regional LNs (+ / #) |
Mets | Living (months) |
|||
| 23 | 1.2 | 70 | F | unknown | large | ND | 3 / 39 | neck | 41 | |
| 28 | 1 | 71 | M | forearm | intermediate | + | − | − | 33 | |
| 7 | 0.33 | 77 | F | eyelid | small | ND | ND | − | 2 | d |
| 4 | 0.2 | 68 | M | buttock | intermediate | − | 5 / 14 | − | 110 | d |
| 24 | 0.145 | 79 | M | leg | intermediate | − | ND | − | 41 | |
| 21 | 0.09 | 63 | M | leg | intermediate | + | − | − | 57 | |
| 32 | 0.08 | 62 | M | arm | small | − | ND | − | 15 | |
| 5 | 0.07 | 81 | F | unknown | intermediate | + | ND | groin | 86 | d |
| 34 | 0.06 | 80 | M | forearm | intermediate | + | − | − | 11 | |
| 30 | 0.0035 | 86 | F | chin | small | + | − | − | 10 | d |
| 29 | 0.0025 | 86 | M | forearm | intermediate | + | − | − | 24 | |
| 17 | 0.001 | 58 | M | temple | intermediate | − | + | − | 63 | |
| 15 | 0.001 | 77 | M | parotid | small | + | − | aorta chest |
42 | d |
| 22 | 0.001 | 82 | M | forehead | intermediate | − | ND | scalp | 36 | d |
| 25 | 0.0005 | 77 | M | scalp | small | − | ND | − | 35 | |
| 1 | 0.0005 | 57 | M | hand | small | ND | 3 / 14 | spine brain |
11 | d |
| 20 | 0.0005 | 90 | M | forehead | intermediate | + | 8−Feb | − | 4 | d |
| 10 | 0 | 77 | F | thigh | intermediate | + | 4 / 6 | pelvis | 45 | d |
| 11 | 0 | 77 | F | finger | large | + | 2 / 14 | axilla | 14 | d |
| 13 | 0 | 84 | M | parotid | intermediate | ND | ND | − | 20 | d |
| 19 | 0 | 90 | M | temple | intermediate | ND | 4 / 35 | brain | 27 | d |
| 8 | 0 | 89 | M | temple | small | − | − | − | 15 | d |
| 26 | 0 | 80 | M | parotid | intermediate | ND | ND | − | 4 | d |
ND = not done
d = deceased (before 11/2008)
LN = lymph node
These data confirm that MCPyV is associated with most, but probably not obligatory for, MCC (1–6). Like others (1–5), we found that 24% of MCC had no detectable MCPyV DNA. An additional 40% had <1 viral copy/300 cells. Did MCC tumors with no or low viral abundance lose the MCPyV genome, as would occur with “hit and run” carcinogenesis? We think not, because such loss would result in uniform distribution of viral abundance, whereas our samples had either ≥1 viral copy per 16 cells or <1 viral copy per 300 cells. One should also consider whether the viral abundance in the higher category (0.06 – 1.2 viral copies per cell) would be sufficient to contribute to neoplasia. The true number of infected cells in a tumor cannot be determined with our methods. However, viral levels were highly concordant in our blinded duplicates of metachronous and recurrent tumors, suggesting that admixture by variable numbers of non-MCC cells in the tissue specimens played little role in the observed variation in viral abundance. Malignant transformation certainly could arise from clonal integration of the MCPyV genome and expression of its large T antigen in MCC tumors, events for which there is good evidence (1,6). In addition, it is plausible that an infected cell could contribute to transformation of uninfected neighboring cells by paracrine mechanisms, as suggested for Kaposi sarcoma-associated herpes virus (19–22).
Finally, we could identify no differences in the clinical characteristics or protein expression patterns between MCC with low-abundance virus and MCC with undetectable virus (Tables 2 and 4). This similarity was our rationale for considering these low/no virus MCC to be one subgroup. It also suggests that MCPyV may be detected in bystander cells, in which case the virus may be incidental to the malignancy.
Thus, our data support two virologically distinct MCC subgroups. Higher viral abundance is characterized by immunohistochemical detection of pRb and TdT, as well as a tendency for improved patient survival. MCC tumors with very low or undetectable levels of MCPyV DNA lack detectable pRb and TdT expression, and they have a tendency for poorer survival. These observations suggest that higher viral-abundance MCC may depend upon a pRb-mediated oncogenic pathway. In contrast other MCC, with few or no detectable copies of MCPyV, may depend on alternate oncogenic pathways such as p53. Future, larger studies are needed to corroborate our findings and should also consider the effects of immune deficiencies, ultraviolet radiation exposure (23, 24), tumor stage, and therapeutic interventions and responses.
Acknowledgements
Grant support: NCI Intramural Research funding and OSU Comprehensive Cancer Center Research Enhancement and Assistance Program (REAP 200925).
We acknowledge Dr. Eric Engels (IIB, DCEG, NCI) and Dr Allen Hildesheim (IIB, DCEG, NCI) for useful discussions. We thank Dr Moore (University of Pittsburgh) for providing valuable advice and reagents for this study.
References
- 1.Feng H, Shuda M, Chang Y, Moore PS. Clonal integration of a polyomavirus in human Merkel cell carcinoma. Science. 2008 Feb 22;319(5866):1096–1100. doi: 10.1126/science.1152586. Epub 2008 Jan 17. [DOI] [PMC free article] [PubMed] [Google Scholar]
- 2.Foulongne V, Kluger N, Dereure O, Brieu N, Guillot B, Segondy M. Merkel cell polyomavirus and Merkel cell carcinoma, France. Emerg Infect Dis. 2008 Sep;14(9):1491–1493. doi: 10.3201/eid1409.080651. [DOI] [PMC free article] [PubMed] [Google Scholar]
- 3.Kassem A, Schöpflin A, Diaz C, et al. Frequent detection of Merkel cell polyomavirus in human Merkel cell carcinomas and identification of a unique deletion in the VP1 gene. In: Kassem A, Schöpflin A, Diaz C, Weyers W, Stickeler E, Werner M, Zur Hausen A, editors. Cancer Res. 13. Vol. 68. 2008. Jul 1, pp. 5009–5013. [DOI] [PubMed] [Google Scholar]
- 4.Garneski KM, Warcola AH, Feng Q, Kiviat NB, Leonard JH, Nghiem P. Merkel Cell Polyomavirus Is More Frequently Present in North American than Australian Merkel Cell Carcinoma Tumors. J Invest Dermatol. 2008 Jul 24; doi: 10.1038/jid.2008.229. [Epub ahead of print] [DOI] [PMC free article] [PubMed] [Google Scholar]
- 5.Becker JC, Houben R, Ugurel S, Trefzer U, Pföhler C, Schrama D. MC Polyomavirus Is Frequently Present in Merkel Cell Carcinoma of European Patients. J Invest Dermatol. 2008 Jul 17; doi: 10.1038/jid.2008.198. [Epub ahead of print] [DOI] [PubMed] [Google Scholar]
- 6.Shuda M, Feng H, Kwun HJ, Rosen ST, Gjoerup O, Moore PS, Chang Y. T antigen mutations are a human tumor-specific signature for Merkel cell polyomavirus. Proc Natl Acad Sci U S A. 2008 Oct 21;105(42):16272–16277. doi: 10.1073/pnas.0806526105. Epub 2008 Sep 23. [DOI] [PMC free article] [PubMed] [Google Scholar]
- 7.Diamandopoulos GT. Induction of lymphocytic leukemia, lymphosarcoma, reticulum cell sarcoma, and osteogenic sarcoma in the Syrian golden hamster by oncogenic DNA simian virus 40. J Natl Cancer Inst. 1973 May;50(5):1347–1365. doi: 10.1093/jnci/50.5.1347. No abstract available. PMID: 4351397. [DOI] [PubMed] [Google Scholar]
- 8.Ali SH, DeCaprio JA. Cellular transformation by SV40 large T antigen: interaction with host proteins. Semin Cancer Biol. 2001 Feb;11(1):15–23. doi: 10.1006/scbi.2000.0342. Review. [DOI] [PubMed] [Google Scholar]
- 9.Shah KV. SV40 and human cancer: a review of recent data. Int J Cancer. 2007 Jan 15;120(2):215–223. doi: 10.1002/ijc.22425. Review. [DOI] [PubMed] [Google Scholar]
- 10.Poulin DL, DeCaprio JA. Is there a role for SV40 in human cancer? J Clin Oncol. 2006 Sep 10;24(26):4356–4365. doi: 10.1200/JCO.2005.03.7101. Review. [DOI] [PubMed] [Google Scholar]
- 11.Pilotti S, Rilke F, Bartoli C, Grisotti A. Clinicopathologic correlations of cutaneous neuroendocrine Merkel cell carcinoma. J Clin Oncol. 1988 Dec;6(12):1863–1873. doi: 10.1200/JCO.1988.6.12.1863. [DOI] [PubMed] [Google Scholar]
- 12.Buresh CJ, Oliai BR, Miller RT. Reactivity with TdT in Merkel cell carcinoma: a potential diagnostic pitfall. Am J Clin Pathol. 2008 Jun;129(6):894–898. doi: 10.1309/R494HQ9VRDJWDY30. [DOI] [PubMed] [Google Scholar]
- 13.Calder KB, Coplowitz S, Schlauder S, Morgan MB. A case series and immunophenotypic analysis of CK20−/CK7+ primary neuroendocrine carcinoma of the skin. J Cutan Pathol. 2007 Dec;34(12):918–923. doi: 10.1111/j.1600-0560.2007.00759.x. [DOI] [PubMed] [Google Scholar]
- 14.Leonard JH, Bell JR, Kearsley JH. Characterization of cell lines established from Merkel-cell ("small-cell") carcinoma of the skin. Int J Cancer. 1993 Nov 11;55(5):803–810. doi: 10.1002/ijc.2910550519. [DOI] [PubMed] [Google Scholar]
- 15.Van Gele M, Boyle GM, Cook AL, Vandesompele J, Boonefaes T, Rottiers P, Van Roy N, De Paepe A, Parsons PG, Leonard JH, Speleman F. Gene-expression profiling reveals distinct expression patterns for Classic versus Variant Merkel cell phenotypes and new classifier genes to distinguish Merkel cell from small-cell lung carcinoma. Oncogene. 2004 Apr 8;23(15):2732–2742. doi: 10.1038/sj.onc.1207421. [DOI] [PubMed] [Google Scholar]
- 16.Sur M, AlArdati H, Ross C, Alowami S. TdT expression in Merkel cell carcinoma: potential diagnostic pitfall with blastic hematological malignancies and expanded immunohistochemical analysis. Mod Pathol. 2007 Nov;20(11):1113–1120. doi: 10.1038/modpathol.3800936. Epub 2007 Sep 21. [DOI] [PubMed] [Google Scholar]
- 17.Penneys NS, Shapiro S. CD44 expression in Merkel cell carcinoma may correlate with risk of metastasis. J Cutan Pathol. 1994 Feb;21(1):22–26. doi: 10.1111/j.1600-0560.1994.tb00686.x. [DOI] [PubMed] [Google Scholar]
- 18.Feinmesser M, Halpern M, Fenig E, Tsabari C, Hodak E, Sulkes J, Brenner B, Okon E. Expression of the apoptosis-related oncogenes bcl-2, bax, and p53 in Merkel cell carcinoma: can they predict treatment response and clinical outcome? Hum Pathol. 1999;30:1367–1372. doi: 10.1016/s0046-8177(99)90070-9. [DOI] [PubMed] [Google Scholar]
- 19.Wang L, Wakisaka N, Tomlinson CC, DeWire SM, Krall S, Pagano JS, Damania B. The Kaposi’s sarcoma-associated herpesvirus (KSHV/HHV-8) K1 protein induces expression of angiogenic and invasion factors. Cancer Res. 2004;64(8):2774–2781. doi: 10.1158/0008-5472.can-03-3653. [DOI] [PubMed] [Google Scholar]
- 20.Vart RJ, Nikitenko LL, Lagos D, Trotter MW, Cannon M, Bourboulia D, Gratrix F, Takeuchi Y, Boshoff C. Kaposi’s sarcoma-associated herpesvirus-encoded interleukin-6 and G-protein-coupled receptor regulate angiopoietin-2 expression in lymphatic endothelial cells. Cancer Res. 2007;67(9):4042–4051. doi: 10.1158/0008-5472.CAN-06-3321. [DOI] [PubMed] [Google Scholar]
- 21.Sivakumar R, Sharma-Walia N, Raghu H, Veettil MV, Sadagopan S, Bottero V, Varga L, Levine R, Chandran B. Kaposi’s sarcoma-associated herpesvirus induces sustained levels of vascular endothelial growth factors A and C early during in vitro infection of human microvascular dermal endothelial cells: biological implications. J Virol. 2008;82(4):1759–1776. doi: 10.1128/JVI.00873-07. [DOI] [PMC free article] [PubMed] [Google Scholar]
- 22.Choi YB, Nicholas J. Autocrine and paracrine promotion of cell survival and virus replication by human herpesvirus 8 chemokines. J Virol. 2008;82(13):6501–6513. doi: 10.1128/JVI.02396-07. [DOI] [PMC free article] [PubMed] [Google Scholar]
- 23.Urbatsch A, Sams WM, Jr, Urist MM, Sturdivant R. Merkel cell carcinoma occurring in renal transplant patients. J Am Acad Dermatol. 1999 Aug;41(2 Pt 2):289–291. doi: 10.1016/s0190-9622(99)70366-x. [DOI] [PubMed] [Google Scholar]
- 24.Engels EA, Frisch M, Goedert JJ, Biggar RJ, Miller RW. Merkel cell carcinoma and HIV infection. Lancet. 2002 Feb 9;359(9305):497–498. doi: 10.1016/S0140-6736(02)07668-7. [DOI] [PubMed] [Google Scholar]