Abstract
To investigate cardiac physiology at the onset of heart beating in embryonic mouse hearts, we performed optical imaging of membrane potential (Vm) and/or intracellular calcium (Cai). Action potentials and Cai transients were detected in ~50% of mouse embryo hearts at E8.5, but in all hearts at E9.0, indicating that beating typically starts between E8–E9. Beating was eliminated by Ca channel blocker nifedipine and the If blocker ZD7288, unaffected by tetrodotoxin and only mildly depressed by disabling sarcoplasmic (SR) and endoplasmic (ER) reticulum Ca cycling. From E8.5 to E10, conduction velocity increased from 0.2–1 mm/s to >5 mm/s in first ventricular and then atrial tissue, while remaining slow in other areas. Arrhythmias included atrioventricular reentry induced by adenosine. In summary, at the onset of beating, If dependent pacemaking drives both AP propagation and Cai transient generation through activation of voltage-dependent Ca channels. Na channels and intracellular Ca cycling have minor roles.
Keywords: mouse embryo, cardiac development, action potential, AV conduction, calcium transient, optical mapping, arrhythmias
INTRODUCTION
Coordinated contraction of the heart requires a well-controlled and finely tuned activation sequence (Efimov et al., 2004). In the adult heart, the impulse originates in the sinoatrial node. Following activation of the atria, the activation wave is slowed down in the atrioventricular (AV) node, and then the wave spreads rapidly into the left and right ventricles via the His-Purkinje system (HPS). This results in ventricular activation from the apex of the heart toward the base (Rothenberg et al., 2005). On the other hand, hearts from primitive species resemble chamberless tubes, which circulate blood by a peristaltic contractile wave originating from a primordial pacemaker region at one or both ends (Moorman and Christoffels, 2003) . For example, in tubular heart of the tunicate Boltenia ovifera (phylogenetically near the invertebrate-vertebrate interface), the propagation speed of the peristaltic wave averages 5–10 mm/s and is relatively constant from one end to the other(Weiss et al., 1976; Moorman and Christoffels, 2003).
Previous studies have shown that in chick (Chuck et al., 1997), mouse (Rentschler et al., 2001; Valderrabano et al., 2006), and rabbit embryos (Rothenberg et al., 2005), the conduction pattern transforms from a peristaltic or suction pump mechanism (Forouhar et al., 2006) to mature apex-to-base conduction (Mikawa and Hurtado, 2007). In this study, our goal was to define the time course of this developmental transition in intact embryonic mouse hearts. We sought to answer the following questions: 1) Is the contractile wave in the primitive heart tube mediated by a propagating action potential (AP), or by Ca-induced Ca waves which propagate from cell-to-cell without an AP? 2) In what sequence does rapid conduction appear as the heart makes the transition from contractile waves to the mature pattern, and what role do Ca and Na currents play? 3) Does cardiac pacemaking depend on a voltage clock, Ca clock or both at the earliest stage? 4) What arrhythmias occur during this developmental process? To address these questions, we used optical mapping techniques (Chen et al., 2006; Valderrabano et al., 2006) to record Cai transients and membrane voltage (Vm) in embryonic mouse hearts from the earliest stage at which the heart beat could be detected. This occurred at embryonic day E8.5, a stage at which we detected Cai transients in about 50% of embryo hearts.
RESULTS
Activation patterns at the earliest stage of heart beating, E8.5–E9.0
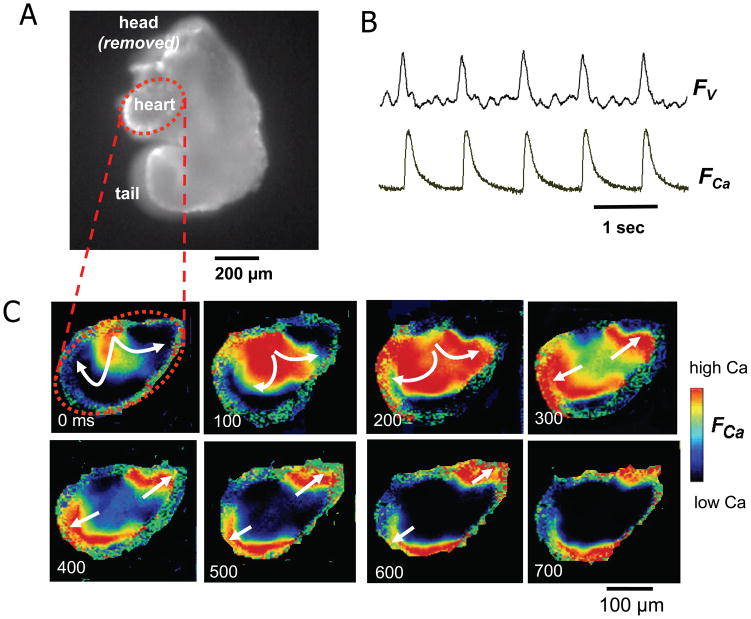
Between E8–E9, the embryonic mouse heart undergoes a morphological transition from a crescent to a heart tube (Moorman and Christoffels, 2003) (Fig. 1). At E8.2 to E8.5, the earliest stage at which we could image, hearts were very oval-shaped with average dimensions of 300 x 250 μm. Based on previous studies (Moorman et al., 1998), we consider this stage as the “primitive heart tube” in which the cardiac crescent has folded around the fusing endocardial vesicles. At E8.5, we detected Cai transients in 16 of 31 hearts examined (~50%), whereas by E9.0, Cai transients were recorded from almost all hearts (n=68), indicating that the heart typically starts beating around E8.5. The measured heart rate ranged from 36–86 beats per min (n=16), and could originate at either end or the middle of the primitive heart tube (Fig. 2). Cai transient propagation was slow throughout, at ~0.2 mm/sec. Dual mapping of voltage and Cai revealed that whenever Cai transients were detected in E8.5 hearts, they were accompanied by propagating APs (n=6) (Fig. 2B). Therefore, it seems that propagation was electrically mediated, rather than due to intercellular Ca-induced Cai release waves without associated APs.
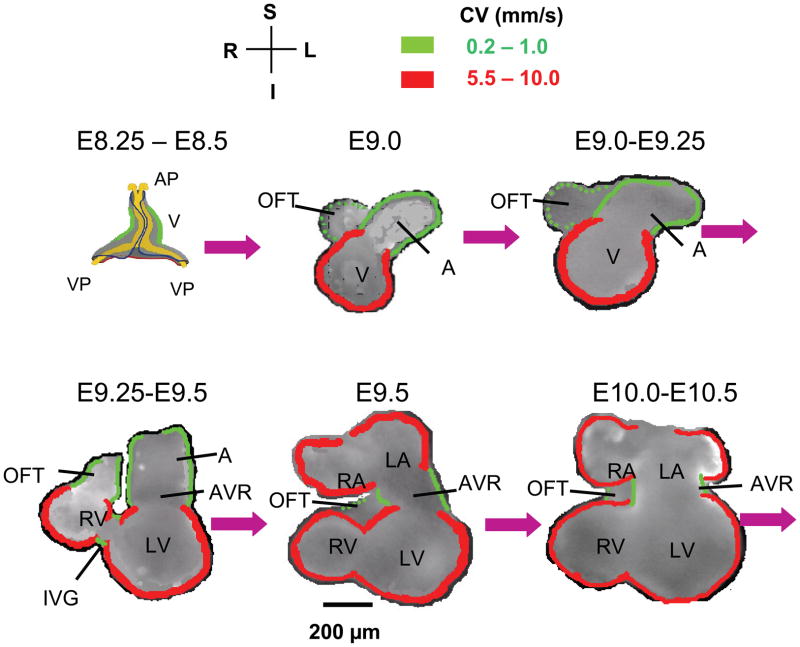
Figure 1. Schematic illustration of mouse embryonic heart chamber development from cardiac crescent to four chamber heart.
Except for E8.25 to E8.5, modified from (Moorman et al., 1998), all other stages are based our recorded video images. AP, anterior pole; VP, venous pole; A, atrium; V, Ventricle; IFT, inflow tract; OFT, outflow tract; AVR, AV ring; IVG, inter-ventricular groove; CV, conduction velocity. Compass labels are S, superior; I, inferior; L, left; R, right. Green borders indicate slow CV (0.2–1.0 mm/s) and red borders indicate fast CV (5.5–10 mm/s) at different stages.
Figure 2. Voltage and Cai transients at E8.5.
A. Image of an E8.5 mouse embryo, with the heart presented as an oval-shape region outlined by the red dashed line. B. Simultaneous recording of voltage (FV) and Ca fluorescence (FCa) at E8.5, documenting that propagation is AP-mediated. C. Pseudo-colored snapshots of Ca fluorescence from the oval cardiac regions at the times indicated, illustrating slow Cai transient propagation (arrows) from the upper middle to both ends of this pre-tube oval shaped heart.
A few hours later, between E8.5 to E9.0, hearts progressed to a well-defined tubular shape expanded at the ventricular end (Fig 1). The venous poles had fused and formed a discrete atrial segment of the heart tube, although right and left atrial chambers were not yet morphologically demarcated. APs and Cai transients originated from the atrial segment (Fig. 3), and Cai transients propagated with uniform speed through the atrium and AV ring, averaging 0.9 ± 0.2 mm/sec (n=19). Once the Cai transient passed the AV ring into the ventricular segment of the heart tube, conduction velocity increased many-fold, to >7.5 ± 0.2 mm/s (n=10). Thus, from the earliest stage that we could detect organized AV conduction, the ventricular segment always had much more rapid conduction velocity.
Figure 3. Organized AV conduction at E9.0 (A) and E9.0–9.5 (B).
A1. Image of an E9.0 mouse embryonic heart tube. A2. Upper traces show Cai fluorescence (FCa) from atrial (A) and ventricular (V) sites. Below is a space-time plot of FCa intensity along the red line in A (vertical axis) versus time (horizontal axis), showing AV propagation. The slope of the FCa upstroke measures conduction velocity, which is slower (shallow slope) in the atrial-AV ring segment than in the ventricular segment (steeper slope). A3. Isochronal map (dotted square area of panel A) constructed from the timing of FCa upstroke, showing slower propagation (crowded isochrones) in the atria-AV ring segment compared to the ventricular segment. B1-3. Corresponding data from an E9.0–9.5 heart tube. Traces in B2 show simultaneously recorded voltage (FV) and Cai fluorescence (FCa) from A, AVR and V sites. The space-time plot now shows fast propagation in the atria as well as ventricles.
Pharmacological responses of the heart beat at E8.5–9.0
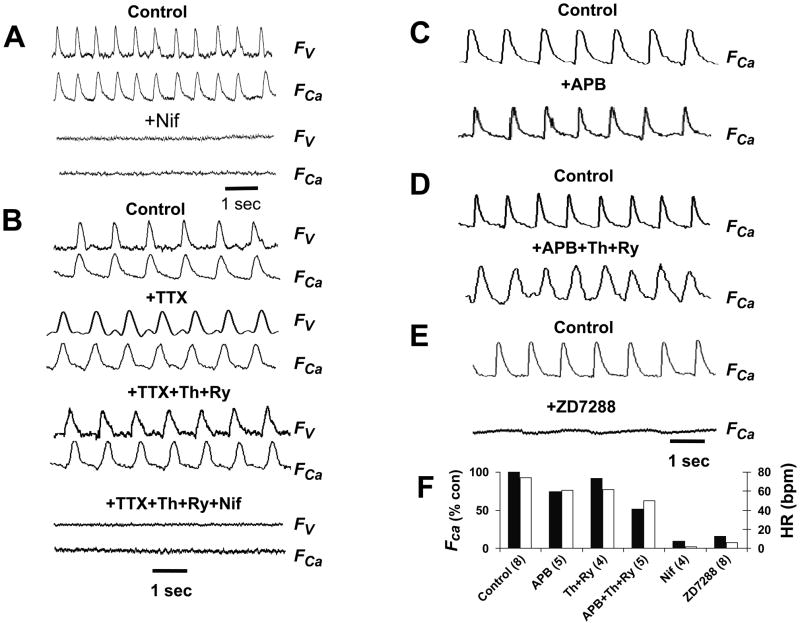
At E8.5–9.0, APs and Cai transients were consistently abolished by superfusion with the L-type Ca channel blocker nifedipine (10 μM), but not by the Na channel blocker tetrodotoxin (TTX, 10 μM) (Fig. 4A). TTX also had no significant effect on heart rate at this stage of development (Fig. 4B). Disabling Ca uptake by the SR and ER with SERCA inhibitor thapsigargin (0.2–2 μM) only modestly suppressed Cai transient amplitude, even when ryanodine (10–20 μM), an SR Ca release channel blocker, or 2-aminoethyl diphenyl borate (2–APB, 100 μM), an IP3 receptor blocker, were also added (Fig. 4B–D). These agents modestly slowed heart rate, from 74 ± 3 beat per min (bpm) under control conditions (n=15) to 62 ± 5 bpm with APB alone (p<0.05, n=7), 63 ± 4 bpm with thapsigargin + ryanodine (p<0.05, n=4), and 52 ± 6 bpm with thapsigargin + ryanodine + ABP (p<0.01, n=6). On the other hand, the If blocker ZD7288 (100 μM) abolished Cai transients in 11 of 13 (85%) hearts at the E8.5 to E9.0 stage (Fig. 4E). These findings suggest that the pacemaker current If plays the dominant role in pacemaking at this stage, with the SR/ER-dependent “Cai clock” playing a modest modulatory role (Sasse et al., 2007) .
Figure 4. Pharmacology of the heart beat at E8.5–E9.0.
A. Representative voltage (FV) and Cai (FCa) fluorescence traces in 1.8 mM Ca Tyrode’s solution before (control0 and after addition of nifedipine (Nif, 10 μM) in an E9.0 heart. B. Same as in A, but with successive additions of tetrodotoxin (TTX, 10 μM), thapsigargin (Th, 2 μM) and ryanodine (Ry, 20 μM), and nifedipine, as labeled, in an E9.0 heart. C–D. The effects of the IP3 receptor blocker 2-aminoethyl diphenyl borate (2-APB, 100 μM) alone (C) and with thapsigargin (Th, 2 μM) and ryanodine (Ry, 20 μM, D) on Ca transients at E9.0. E. The effects of the If blocker ZD7288 (100 μM) on voltage and Ca transients at E9.0. F. Bar graphs summarizing the effects of the various interventions on heart rate (open bars) and Ca transient amplitude relative to control (solid bars). Data are averaged from the number of E8.5 hearts indicated in parentheses. Standard errors are too small to be visible.
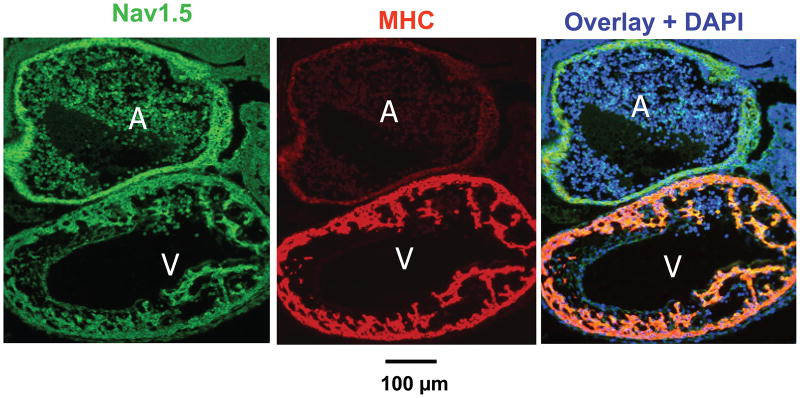
At E9.0, the faster conduction velocity in the ventricular segment of the heart tube corresponded to strong positive immunostaining for cardiac myosin heavy chain, with much less intensity in the atrial segment and AV ring segments (Fig. 5, middle panel). In contrast, all three ventricular segments all expressed Nav1.5, an earlier primary heart tube marker (Fig. 5, left panel). However, the lack of effect of TTX on propagation at this stage suggests that Na channels were either inactivated by a low resting membrane potential or not yet functional.
Fig. 5. Nav1.5 and myosin heavy chain (MHC) immunofluorescence labeling at E9.0.
Nav1.5 (green), cardiac myosin heavy chain (MHC, red), and their overlay with nuclei (DAPI, blue). Nav1.5 staining is similar in atrial (A) and ventricular (V) segments, whereas MHC is selectively increased in the ventricle.
Activation patterns at E9.0–E10.0
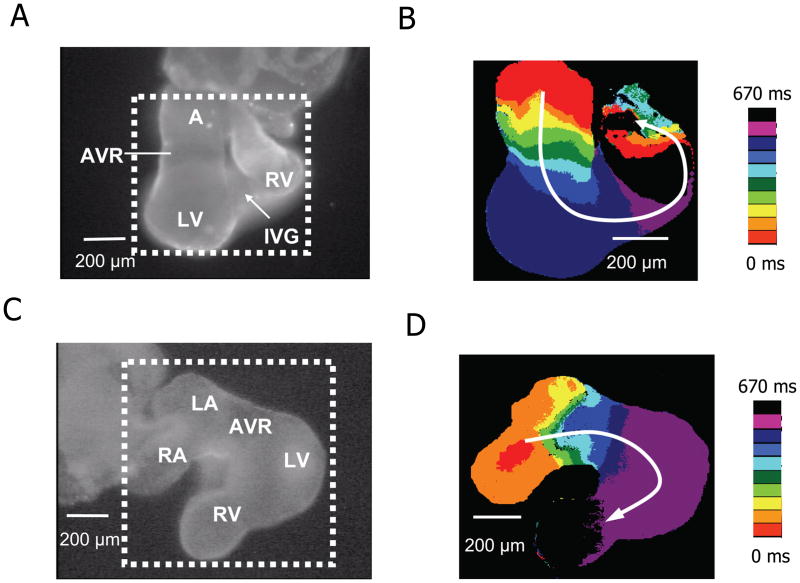
Between E9.0 to E10.0, the ventricles segregated into right and left chambers (RV and LV), followed shortly thereafter by separation of the atrium into right and left chambers (RA and LA). Unlike the heart shown in Fig. 3, atrial conduction velocity was now faster, approaching to the ventricle, with slow conduction remaining only in the AV ring and outflow tract. Shortly thereafter, a distinct interventricular groove (IVG) began to delineate the RV and LV (Fig. 6A–B). Fig. 6C–D shows a heart at a slightly later stage (E9.5 E10.0), in which the atrium of primary heart tube has formed discrete right and left chambers. The Cai transient appears first in the RA and then activates the LA (Fig. 6C–D) before propagating through the AV ring to the ventricles. At the E9.5 stage, propagation speed in the atria was >6.2 ± 0.1 mm/s (n=29), while remaining slow (1.0 ± 0.1 mm/s, n=13) only in the AV ring and outflow tract. This pattern of atrial and AV ring propagation remained similar from E9.5 onwards.
Figure 6. Cai transient propagation at E9.5 and E10.0.
A. Image of a E9.5 embryonic mouse heart (viewed from the posterior aspect) showing the atrium (A), AV ring (AVR) and forming left (LV) and right ventricles (RV) separated by an interventricular groove (IVG). B. Isochrone map of embryonic heart in dotted square area of panel A, constructed from the timing of the FCa upstroke, showing slower propagation (crowded isochrones) in the AVR segment compared to the A and V segments. C–D. Same for an E9.5–E10.0 heart, viewed from the anterior aspect, now showing discrete right (RA) and left (LA) atria. Left color bars show time scales.
Arrhythmias in E8.5–E9.5 hearts
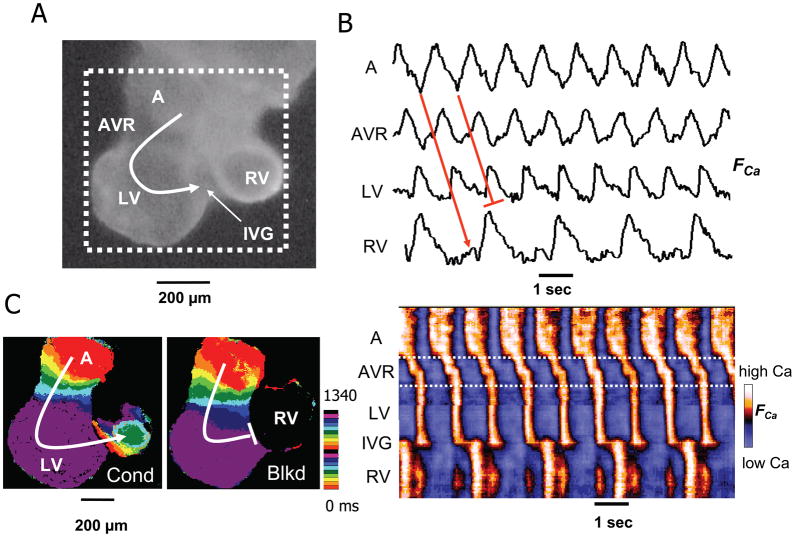
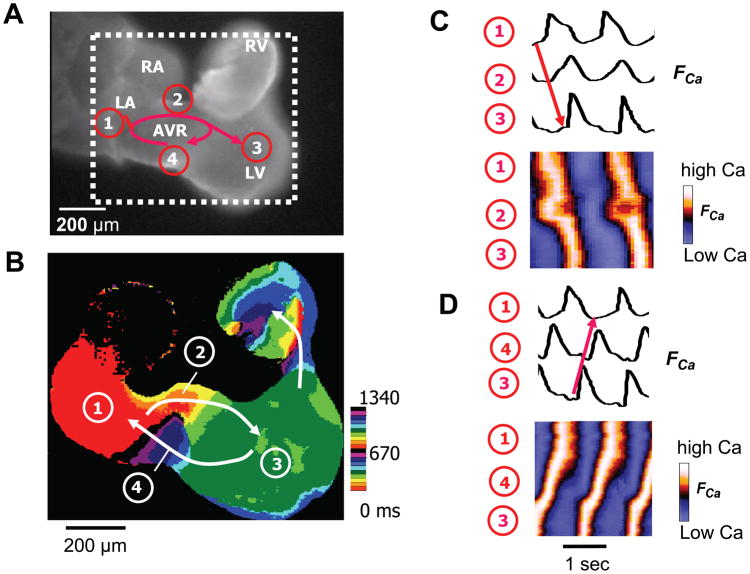
At E8.5–9.0, AV conduction was irregular and several types of arrhythmias were observed. Although we cannot completely exclude artifacts from the dissection procedure, transient hypoxia or other factors (Raddatz et al., 2006), the most commonly observed arrhythmia was AV conduction block (5/62). In one E9.5 heart, we also observed conduction block at the IVG separating the LV and RV segments of the heart tube (Fig. 7). During superfusion with adenosine, we recorded 2 cases of AV ring reentry (Fig. 8, supplemental video 1 and 2). During AV ring reentry, the Cai transient propagated antegradely from the LA through the right side of the AV ring to the LV and then RV. The impulse then traveled retrogradely from the LV through left side of the AV ring back to the RA, and so forth. However, we never observed AV ring reentry in E9.5 hearts under control conditions in the absence of adenosine, consistent with our previous report (Valderrabano et al., 2006).
Figure 7. Interventricular block in an E9.5 heart.
A.) Image of an E9.5 embryonic mouse heart (viewed from the posterior aspect) showing the atria (A), AV ring (AVR) and forming left (LV) and right ventricles (RV) delineated by an interventricular groove (IVG). B. Upper traces show Cai fluorescence (FCa) from A, AVR, LV and RV sites, illustrating 2:1 block interventricular block at the IVG. Below is a space-time plot of FCa intensity along the red line in A (vertical axis) versus time (horizontal axis), showing AV propagation and 2:1 interventricular block. C. Isochrone map (from dotted area of panel A), constructed from the timing of FCa upstroke, showing two successive beats which conducted (cond) and blocked (blkd), respectively, at the IVG. Color time scale indicated is beside the isochrone maps.
Figure 8. AV ring reentry in an E9.5 heart.
A. A Fluo-4 loaded E9.5 mouse embryo heart originally with normal AV conduction (movie 1) developed AVR reentry 5 min after addition of 50 μMadenosine into the bath solution (movie 2). Red arrows show the reentry conduction pattern. B. Isochrone map form the dotted square area of panel A, showing reentry conduction pathway (white arrows), with the location indicated the same as on panel A. Color time scale is the same as in Figure 7 C. Cai fluorescence traces (FCa, above) and space-time plots of FCa intensity (below) along the antegrade AV conduction pathway from the LA (1) to the right side of the AVR (2), to the LV (3) (red arrow). D. Same for the retrograde VA pathway from the LV (3), to left side of the AVR (4), to the LA (1). See supplemental video 2 for normal Cai transient conduction, and video 3 for Cai transient reentry dynamics.
DISCUSSION
The present study delineates the anatomical and functional development of the heart beat, from its onset in the primary heart tube at E8.5, to a four-chambered heart at E10. The earliest stage investigated here is earlier than has been reported in previous studies using optical mapping techniques (Rentschler et al., 2001; Rentschler et al., 2002; Rothenberg et al., 2005). Our finding that heart beating begins around E8.5 in the mouse is consistent with previous studies using high-frequency echocardiography (Srinivasan et al., 1998; Phoon, 2001 ).
We find that from the onset of detectable heart beating at E8.5, propagation of the Cai transient is mediated electrically by APs. We did not find evidence of propagating Cai waves due to Ca-induced Ca release (CICR) from ER or SR in the absence of APs, even though the observed propagation speed (0.2–5 mm/s) is compatible with CICR Cai wave propagation measured in intact cardiac muscle (0.3–5.5 mm/s) (Miura et al., 1998). Thus, if Cai waves are more primitive in evolutionary terms than AP-mediated propagation, we do not find evidence that they play a critical role in mediating propagation at the earliest stages of mammalian heart beating in the primitive heart tube. This is supported by the observation that depleting ER/SR Ca stores with thapsigargin and blocking ryanodine or IP3 receptors (to prevent Ca-induced Ca release from internal Ca stores) did not slow propagation. In addition, these agents only modestly depressed the amplitude of the Cai transient at E8.5~E9.0, consistent with the traditional view (Klitzner et al., 1991) that functional coupling of L-type Ca channels to SR Ca release channels in the mammalian heart occurs postnatally. Therefore, our findings support the view that excitation-contraction coupling in the embryonic mammalian heart is mediated predominantly by transarcolemmal Cai fluxes, similar to excitation-contraction coupling in more primitive species such as amphibians. The abolition of the AP and Cai transient by the L-type Ca channel blocker nifedipine supports this conclusion. The slow propagation speed and lack of effect of the Na channel blocker TTX at this stage is consistent with L-type Ca current-mediated propagation. Thus, our findings suggest that at the earliest stage of heart beating, the L-type Ca current is the primary mediator supporting both AP propagation and excitation-contraction coupling.
Suppression of ER/SR function only modestly slowed the heart rate at E8.5–E9.5, suggesting that a “Ca clock” (Maltsev and Lakatta, 2008) plays a modulatory, rather than primary role, in pacemaking at the earliest stage of the heart beat, as might be expected if ER/SR Cai cycling is not yet fully developed. In contrast, the If blocker ZD7288 abolished the heart beat in 85% of E9.0 hearts, consistent with a “voltage clock” as the primary mechanism at this stage. This result agrees with embryonic lethality at E9.5–11.5 in the HCN4 knockout mouse, in which If is reduced by 85% (Stieber et al., 2003). In contrast, conditional knockout of HCN4 after birth produces only sinus bradycardia and pauses, but not complete sinus arrest (Herrmann et al., 2007). These findings suggest that the “Ca clock” develops primarily after birth as the SR matures, adding robustness to the already present voltage clock to enhance the reliability and dynamic range of cardiac pacemaking. However, our results contrast with those reported for embryonic mouse myocytes isolated from E8.5–E11 hearts, in which the “Ca clock” mechanism predominated (Sarre et al., 2006). In the latter study, however, the spontaneously beating myocytes were not specifically isolated from sinoatrial tissue, and most of the experiments were performed after isolated myocytes had been cultured for 48–72 hrs, which promotes rapid development of functional SR Ca cycling in neonatal rodent ventricular myocytes (Husse and Wussling, 1996; Zimmermann et al., 2002) . However, these authors did comment that freshly isolated embryonic myocytes behaved similarly, so that the reason for this difference is unclear. Finally, we cannot exclude that other currents, such as Na-Ca exchange (NCX), are important in embryonic pacing at these early stages. Global NCX knockout is embryonically lethal by E10–E11 and preceded by absent or slow and weak heart beating (Wakimoto et al., 2000; Koushik et al., 2001; Reuter et al., 2003; Wakimoto et al., 2003). However, whether this is a primary effect on the pacemaker mechanism or secondary to other consequences of the lack of NCX such as myofibrillar disarray, swollen mitochondria and apoptosis observed in these mice is unclear.
Between E8.0 and E9.0, the embryonic heart transitions morphologically from a crescent to a primitive heart tube. The heart beat in the primitive tube arises inconsistently from the middle or one end, and propagates slowly (0.2 mm/s) throughout, resembling the uniform speed of contraction in primitive species such as the tunicate (Weiss et al., 1976). By E9.0 to E9.5, however, consistent regional differences in propagation speed are present, with propagation speed in the ventricular segment many-fold faster than in the atrial or AV ring segments. These findings are consistent with previous findings in chick heart that, in contrast to primary myocardium, the ventricular (and later atrial) segments develop as more rapidly conducting (10-fold) “working” myocardium (de Jong et al., 1992). Indeed, we found that the faster propagation speed correlated with the stronger expression of MHC in the ventricular segment than in other segments at E9.0 (Fig. 5). In contrast, expression of the cardiac Na channel Nav1.5 appeared similar in all segments of the heart tube by E9.0, even though the lack of effect of TTX indicates that Na channels were either inactivated by a low resting membrane potential or not yet functional. Previous findings in developing chick hearts indicated that the AV ring tissue had much slower AP upstroke velocity (dv/dt) than atrial or ventricular tissue (de Jong et al., 1992). If also true in the mouse embryonic heart, then given the absence of functional Na channels, the slower propagation speed in the AVR and outflow tract is likely to be due to lower Ca current density, although regional differences in gap junction expression may also contribute. Previously, Sedmera et al. (Sedmera et al., 2003) reported in developing embryonic mouse heart that cellular zones permanently exiting the cell cycle can be found as early as E8.5 13.5, and that the areas of slow proliferation correlate both spatially and temporally with the differentiating conduction system. In addition, hemodynamic factors have also been shown to influence the timing with which rapid conduction appears (Reckova et al., 2003). Further studies will be required to pinpoint the precise molecular basis for the faster propagation speed in the ventricular segment at this stage.
Consistent with previous reports, we find that the first distinct cardiac chamber to develop morphologically is the LV, which appears as an expansion in the ventricular segment of the heart tube at E9.0 (Fig. 3). Between E9.0 and E9.5, an IVG forms to separate the LV from RV, followed by the atrial segment dividing into the RA (contiguous with the venous inflow tract) and the LA (interposed between the RA and AV ring) (Fig. 6A). By E9.5, all four cardiac chambers are clearly visible between the venous inflow tract and the arterial outflow tract (Fig. 6C). Propagation is rapid throughout both atria and ventricles, remaining slow only in the AV ring and outflow tract (Fig. 1). This progression is consistent with the concept that the atrial and ventricular chambers may “balloon” out from the primary heart tube (Moorman and Christoffels, 2003).
Arrhythmias were also occasionally observed at E9.0–E9.5. In addition to AV block, we observed interventricular block at the IVG in an E9.0 heart (Fig. 7), supporting the concept that the IVG, like the AV ring, is originally derived from the primary heart tube. In addition, we also documented AV ring reentry in E9.5 hearts during superfusion with adenosine (Fig. 8). Previously we observed AV ring reentry in E10.5–E11.5 hearts after exposure to isoproterenol and carbachol (Valderrabano et al., 2006), but not in E9.5 hearts. We speculated that in E9.5 hearts, the AV ring may still be physically too small to support reentry. However, our present findings show that in the presence of adenosine, this is not the case. The AV ring measured approximately 180 x 240 microns in size, and to our knowledge, this represents the smallest micro-reentry circuit so far recorded in native cardiac tissue.
Several important limitations of this study should be mentioned. Our measurements of AP and Cai transient propagation speed are only crude, since they were estimated from a 2D projection of 3D tissue at limited time resolution. The temporal resolution was sufficient to estimate propagation velocity through slowly conducting regions like the AV ring. However, only a lower limit of propagation velocity could be estimated in more rapidly conducting regions like the ventricles, which often activated within one frame at the slowest acquisition speed of 30 frames per second. However, this limited temporal resolution is still adequate to detect many-fold changes in propagation velocity, which was our main goal. Faster cameras may reveal more subtle regional differences. For our purposes, we also documented that Cai transient and AP propagation speed are roughly equivalent, since similar velocities were obtained using the upstroke of the Cai transient or AP upstroke when both voltage and Cai fluorescence were recorded simultaneously (Valderrabano et al., 2006). Heart rates, AP and Cai transients may also be different in vivo than in isolated embryonic hearts, and maternal anesthesia may also have affected the results. Despite these limitations, this characterization of cardiac impulse formation and conduction in the embryonic mouse heart should provide a useful baseline for studying how genetic factors alter the normal development of this process, which may lead to insights the evolution of clinically relevant arrhythmias in humans.
EXPERIMENTAL PROCEDURES
Preparation and solutions
CD-1 mice were time-mated, and the day on which copulation plugs were observed was designated day 0.5 of pregnancy. On the desired gestational day, pregnant female mice were first sedated by inhalation of isoflurane and then killed by cervical dislocation (Chen et al., 2006; Valderrabano et al., 2006) . The uterus was dissected and whole embryos were exposed. Entire embryonic mouse hearts were then carefully excised from explanted embryos using a dissecting microscope. During the dissection procedure, the embryonic mice were bathed in modified oxygenated Tyrode’s solution containing (in mM/L) 136 NaCl, 5.4 KCl, 0.1 CaCl2, 0.33 NaH2PO4, 1 MgCl2, 10 HEPES, 10 Glucose, (pH 7.3). The same solution with 1.8 mM CaCl2 was used as the standard (control) bath solution to perfuse embryonic hearts at 37oC in the experimental chamber. Chemicals were obtained from Sigma Chemical Co. (St. Louis, MO).
Optical mapping
The experimental setup and methods for simultaneous optical imaging of voltage and Ca have been described in detail previously(Valderrabano et al., 2006). In brief, for dual voltage and Ca mapping, isolated embryonic mouse hearts were incubated with 5 μM Rhod-2-acetoxymethyl ester (Rhod-2-AM) dissolved in dimethyl sulfoxide and pluronic F-127 (0.1%) for 40 minutes to image Ca, followed by a 5-minute incubation with 5 μM RH-237 to image membrane voltage. Fluorophores were obtained from Invitrogen Molecular Probes (Eugene, OR). Hearts were then washed in Tyrode's solution before transfer to an experimental chamber (T=37°C) on a modified inverted microscope. Cai and voltage signals were simultaneously recorded using two electron-multiplier CCD cameras operating at 200 to 500 frames per second (Photometrics Cascade 128+, Arizona) with a spatial resolution of 128 x128 pixels. Tracings of voltage and Ca fluorescence measured from different regions of the heart are displayed as the relative increase in fluorescence, normalized relative to the average resting fluorescence from that region. In some experiments, Ca imaging alone was performed with a resolution of 320x240 pixels using a different CCD camera (Model LCL 811K, Watec America, Las Vegas, NV, 30 frames/second) (Chen et al., 2006).
Conduction velocity was estimated from the time delay between the AP or Cai transient upstroke at two or more sites in the region of interest in the atrial, AV ring or ventricles, divided by the distance separating the sites. Measurements using the voltage and Cai signals gave equivalent results, with excellent correlation (r=0.92, p<0.01) in dual mapping experiments (n=23).
Immunofluorescence
Immunostaining for cardiac myosin and the Na+ channel Nav1.5 were performed as described previously (Chen et al., 2006) using the anti-cardiac myosin heavy chain antibody (MF20, anti-myosin heavy chain, DSHB, University of Iowa, Iowa City, IA) to detect myocardium, and a rabbit polyclonal anti-Nav1.5 (Santa Cruz Biotechnologies, Inc; Santa Cruz, CA) to identify cardiac primary tube tissue. Tissue sections were also treated with DAPI (Sigma, St Louis, MO) for 2 min to stain nuclei, and then mounted on slides. All slides were viewed on an epifluorescence microscope and digitally photographed for later analysis.
Data analysis
Values are expressed as the mean ± standard error of the mean. An unpaired student t test was used to assess statistical significance, with a p value of < 0.05 considered significant.
Supplementary Material
Normal AV conduction in an E 9.0 mouse embryo heart. The video shows the same heart as in Fig 8 in control condition. The dynamic excitation in the sequence of RA, LA, AVR, LV and RV is clearly show, with OFT cut. Please refer to Fig 8 legends for structural details.
Micro-reentry induced by adenosine (50 μm) in the same heart as in Video 1. The video shows one RA and LA excited, the Ca transients conduct antegradly on right side (upside on the movie profile) of AVR from A to LV, while retrogradely conduct from LV to A on left side (lower side on movie profile) of AVR. See figure legend of Fig 8 for structural and conduction illustration.
Acknowledgments
We thank Lingqin Pan and Tan Duong for technical assistance.
Funded by: NIH/NHLBI P01 HL078931 (J.N.W.); American Heart Association Western States Affiliate grants 0755043Y (F.C) and 0625048Y (C. D.); the UCLA Laubisch Fund (F.C. and J.N.W.); and Kawata Endowment (J.N.W.).
Abbreviations used
- Vm
membrane voltage
- AV
atrio-ventricular
- CCS
cardiac conduction system
- CV
conduction velocity
- SAN
sinoatrial node
- E
embryo day age
- SR
sarcoplasmic reticulum
- ER
endoplasmic reticulum
- SERCA
sarco/endoplasmic reticulum Ca2+-ATPase
- CICR
Ca-induced Ca release
- RA
right atrium
- LA
left atrium
- LV
left ventricle
- RV
right ventricle
- IVG
inter-ventricular groove
- IFT
inflow tract
- OFT
outflow tract
- RVOT
RV outflow tract
- PV
pulmonary vein
- AVR
AV ring
- AP
action potential
- Cai
intracellular (Ca2+)
- TTX, tetrodotoxin
2-APB, 2-aminoethyl diphenyl borate
References
- Chen F, Klitzner TS, Weiss JN. Autonomic regulation of calcium cycling in developing embryonic mouse hearts. Cell Calcium. 2006;39:375–385. doi: 10.1016/j.ceca.2005.12.004. [DOI] [PubMed] [Google Scholar]
- Chuck ET, Freeman DM, Watanabe M, Rosenbaum DS. Changing activation sequence in the embryonic chick heart. Implications for the development of the His-Purkinje system. Circ Res. 1997;81:470–476. doi: 10.1161/01.res.81.4.470. [DOI] [PubMed] [Google Scholar]
- de Jong F, Opthof T, Wilde AA, Janse MJ, Charles R, Lamers WH, Moorman AF. Persisting zones of slow impulse conduction in developing chicken hearts. Circ Res. 1992;71:240–250. doi: 10.1161/01.res.71.2.240. [DOI] [PubMed] [Google Scholar]
- Efimov IR, Nikolski VP, Rothenberg F, Greener ID, Li J, Dobrzynski H, Boyett M. Structure-function relationship in the AV junction. Anat Rec A Discov Mol Cell Evol Biol. 2004;280:952–965. doi: 10.1002/ar.a.20108. [DOI] [PubMed] [Google Scholar]
- Forouhar AS, Liebling M, Hickerson A, Nasiraei-Moghaddam A, Tsai HJ, Hove JR, Fraser SE, Dickinson ME, Gharib M. The embryonic vertebrate heart tube is a dynamic suction pump. Science. 2006;312:751–753. doi: 10.1126/science.1123775. [DOI] [PubMed] [Google Scholar]
- Herrmann S, Stieber J, Stockl G, Hofmann F, Ludwig A. HCN4 provides a 'depolarization reserve' and is not required for heart rate acceleration in mice. Embo J. 2007;26:4423–4432. doi: 10.1038/sj.emboj.7601868. [DOI] [PMC free article] [PubMed] [Google Scholar]
- Husse B, Wussling M. Developmental changes of calcium transients and contractility during the cultivation of rat neonatal cardiomyocytes. Mol Cell Biochem. 1996;163–164:13–21. doi: 10.1007/BF00408636. [DOI] [PubMed] [Google Scholar]
- Klitzner TS, Chen FH, Raven RR, Wetzel GT, Friedman WF. Calcium current and tension generation in immature mammalian myocardium: effects of diltiazem. J Mol Cell Cardiol. 1991;23:807–815. doi: 10.1016/0022-2828(91)90214-7. [DOI] [PubMed] [Google Scholar]
- Koushik SV, Wang J, Rogers R, Moskophidis D, Lambert NA, Creazzo TL, Conway SJ. Targeted inactivation of the sodium-calcium exchanger (Ncx1) results in the lack of a heartbeat and abnormal myofibrillar organization. Faseb J. 2001;15:1209–1211. doi: 10.1096/fj.00-0696fje. [DOI] [PubMed] [Google Scholar]
- Maltsev VA, Lakatta EG. Dynamic interactions of an intracellular Ca2+ clock and membrane ion channel clock underlie robust initiation and regulation of cardiac pacemaker function. Cardiovasc Res. 2008;77:274–284. doi: 10.1093/cvr/cvm058. [DOI] [PubMed] [Google Scholar]
- Mikawa T, Hurtado R. Development of the cardiac conduction system. Semin Cell Dev Biol. 2007;18:90–100. doi: 10.1016/j.semcdb.2006.12.008. [DOI] [PubMed] [Google Scholar]
- Miura M, Boyden PA, ter Keurs HE. Ca2+ waves during triggered propagated contractions in intact trabeculae. Am J Physiol. 1998;274:H266–276. doi: 10.1152/ajpheart.1998.274.1.H266. [DOI] [PubMed] [Google Scholar]
- Moorman AF, Christoffels VM. Cardiac chamber formation: development, genes, and evolution. Physiol Rev. 2003;83:1223–1267. doi: 10.1152/physrev.00006.2003. [DOI] [PubMed] [Google Scholar]
- Moorman AF, de Jong F, Denyn MM, Lamers WH. Development of the cardiac conduction system. Circ Res. 1998;82:629–644. doi: 10.1161/01.res.82.6.629. [DOI] [PubMed] [Google Scholar]
- Phoon CK. Circulatory physiology in the developing embryo. Curr Opin Pediatr. 2001;13:456–464. doi: 10.1097/00008480-200110000-00013. [DOI] [PubMed] [Google Scholar]
- Raddatz E, Gardier S, Sarre A. Physiopathology of the embryonic heart (with special emphasis on hypoxia and reoxygenation) Ann Cardiol Angeiol (Paris) 2006;55:79–89. doi: 10.1016/j.ancard.2006.02.007. [DOI] [PubMed] [Google Scholar]
- Reckova M, Rosengarten C, deAlmeida A, Stanley CP, Wessels A, Gourdie RG, Thompson RP, Sedmera D. Hemodynamics is a key epigenetic factor in development of the cardiac conduction system. Circ Res. 2003;93:77–85. doi: 10.1161/01.RES.0000079488.91342.B7. [DOI] [PubMed] [Google Scholar]
- Rentschler S, Vaidya DM, Tamaddon H, Degenhardt K, Sassoon D, Morley GE, Jalife J, Fishman GI. Visualization and functional characterization of the developing murine cardiac conduction system. Development. 2001;128:1785–1792. doi: 10.1242/dev.128.10.1785. [DOI] [PMC free article] [PubMed] [Google Scholar]
- Rentschler S, Zander J, Meyers K, France D, Levine R, Porter G, Rivkees SA, Morley GE, Fishman GI. Neuregulin-1 promotes formation of the murine cardiac conduction system. Proc Natl Acad Sci U S A. 2002;99:10464–10469. doi: 10.1073/pnas.162301699. [DOI] [PMC free article] [PubMed] [Google Scholar]
- Reuter H, Henderson SA, Han T, Mottino GA, Frank JS, Ross RS, Goldhaber JI, Philipson KD. Cardiac excitation–contraction coupling in the absence of Na(+) - Ca2+ exchange. Cell Calcium. 2003;34:19–26. doi: 10.1016/s0143-4160(03)00018-6. [DOI] [PubMed] [Google Scholar]
- Rothenberg F, Nikolski VP, Watanabe M, Efimov IR. Electrophysiology and anatomy of embryonic rabbit hearts before and after septation. Am J Physiol Heart Circ Physiol. 2005;288:H344–351. doi: 10.1152/ajpheart.00770.2004. [DOI] [PubMed] [Google Scholar]
- Sarre A, Maury P, Kucera P, Kappenberger L, Raddatz E. Arrhythmogenesis in the developing heart during anoxia-reoxygenation and hypothermia-rewarming: an in vitro model. J Cardiovasc Electrophysiol. 2006;17:1350–1359. doi: 10.1111/j.1540-8167.2006.00637.x. [DOI] [PubMed] [Google Scholar]
- Sasse P, Zhang J, Cleemann L, Morad M, Hescheler J, Fleischmann BK. Intracellular Ca2+ oscillations, a potential pacemaking mechanism in early embryonic heart cells. J Gen Physiol. 2007;130:133–144. doi: 10.1085/jgp.200609575. [DOI] [PMC free article] [PubMed] [Google Scholar]
- Sedmera D, Reckova M, DeAlmeida A, Coppen SR, Kubalak SW, Gourdie RG, Thompson RP. Spatiotemporal pattern of commitment to slowed proliferation in the embryonic mouse heart indicates progressive differentiation of the cardiac conduction system. Anat Rec A Discov Mol Cell Evol Biol. 2003;274:773–777. doi: 10.1002/ar.a.10085. [DOI] [PubMed] [Google Scholar]
- Srinivasan S, Baldwin HS, Aristizabal O, Kwee L, Labow M, Artman M, Turnbull DH. Noninvasive, in utero imaging of mouse embryonic heart development with 40-MHz echocardiography. Circulation. 1998;98:912–918. doi: 10.1161/01.cir.98.9.912. [DOI] [PubMed] [Google Scholar]
- Stieber J, Herrmann S, Feil S, Loster J, Feil R, Biel M, Hofmann F, Ludwig A. The hyperpolarization-activated channel HCN4 is required for the generation of pacemaker action potentials in the embryonic heart. Proc Natl Acad Sci U S A. 2003;100:15235–15240. doi: 10.1073/pnas.2434235100. [DOI] [PMC free article] [PubMed] [Google Scholar]
- Valderrabano M, Chen F, Dave AS, Lamp ST, Klitzner TS, Weiss JN. Atrioventricular ring reentry in embryonic mouse hearts. Circulation. 2006;114:543–549. doi: 10.1161/CIRCULATIONAHA.106.633727. [DOI] [PubMed] [Google Scholar]
- Wakimoto K, Fujimura H, Iwamoto T, Oka T, Kobayashi K, Kita S, Kudoh S, Kuro-o M, Nabeshima Y, Shigekawa M, Imai Y, Komuro I. Na+/Ca2+ exchanger-deficient mice have disorganized myofibrils and swollen mitochondria in cardiomyocytes. Comp Biochem Physiol B Biochem Mol Biol. 2003;135:9–15. doi: 10.1016/s1096-4959(03)00057-5. [DOI] [PubMed] [Google Scholar]
- Wakimoto K, Kobayashi K, Kuro OM, Yao A, Iwamoto T, Yanaka N, Kita S, Nishida A, Azuma S, Toyoda Y, Omori K, Imahie H, Oka T, Kudoh S, Kohmoto O, Yazaki Y, Shigekawa M, Imai Y, Nabeshima Y, Komuro I. Targeted disruption of Na+/Ca2+ exchanger gene leads to cardiomyocyte apoptosis and defects in heartbeat. J Biol Chem. 2000;275:36991–36998. doi: 10.1074/jbc.M004035200. [DOI] [PubMed] [Google Scholar]
- Weiss J, Goldman Y, Morad M. Electromechanical properties of the single cell-layered heart of tunicate Boltenia ovifera (sea potato) J Gen Physiol. 1976;68:503–518. doi: 10.1085/jgp.68.5.503. [DOI] [PMC free article] [PubMed] [Google Scholar]
- Zimmermann WH, Schneiderbanger K, Schubert P, Didie M, Munzel F, Heubach JF, Kostin S, Neuhuber WL, Eschenhagen T. Tissue engineering of a differentiated cardiac muscle construct. Circ Res. 2002;90:223–230. doi: 10.1161/hh0202.103644. [DOI] [PubMed] [Google Scholar]
Associated Data
This section collects any data citations, data availability statements, or supplementary materials included in this article.
Supplementary Materials
Normal AV conduction in an E 9.0 mouse embryo heart. The video shows the same heart as in Fig 8 in control condition. The dynamic excitation in the sequence of RA, LA, AVR, LV and RV is clearly show, with OFT cut. Please refer to Fig 8 legends for structural details.
Micro-reentry induced by adenosine (50 μm) in the same heart as in Video 1. The video shows one RA and LA excited, the Ca transients conduct antegradly on right side (upside on the movie profile) of AVR from A to LV, while retrogradely conduct from LV to A on left side (lower side on movie profile) of AVR. See figure legend of Fig 8 for structural and conduction illustration.


