

Abstract

Recent studies show that an array of β-sheet peptides, including N-terminally truncated Aβ peptides (Aβ11−42/17−42), K3 (a β2-microglobulin fragment), and protegrin-1 (PG-1) peptides form ion channel-like structures and elicit single channel ion conductance when reconstituted in lipid bilayers and induce cell damage through cell calcium overload. Striking similarities are observed in the dimensions of these toxic channels irrespective of their amino acid sequences. However, the intriguing question of preferred channel sizes is still unresolved. Here, exploiting ssNMR-based, U-shaped, β-strand-turn-β-strand coordinates, we modeled truncated Aβ peptide (p3) channels with different sizes (12- to 36-mer). Molecular dynamics (MD) simulations show that optimal channel sizes of the ion channels presenting toxic ionic flux range between 16- and 24-mer. This observation is in good agreement with channel dimensions imaged by AFM for Aβ9−42, K3 fragment, and PG-1 channels and highlights the bilayer-supported preferred toxic β-channel sizes and organization, regardless of the peptide sequence.
Introduction
An increasing body of evidence indicates that in Alzheimer’s disease (AD), the full-length amyloid-β (Aβ1−40/42) peptides assemble to form ion channels in the cell membrane, inducing cellular toxicity.1−18 The pathological conversion of normal Aβ peptides to oligomers is believed to underlie the disease.(19) Although it was unclear whether it is the small Aβ oligomers that form toxic channels1−18 or the large oligomers inducing nonselective ion leakage through the low dielectric barrier,20,21 there is a general agreement that these oligomeric amyloids are the toxic species, rather than the full-grown mature fibrils.22,23
In the amyloidogenic pathway, Aβ1−40/42 is produced via cleavage by β- (at position 1) and γ- (position 40 or 42) secretases from the transmembrane amyloid precursor protein (APP) (Figure 1a). Although Aβ1−42 is more toxic to neurons than Aβ1−40, the production of Aβ1−40 is energetically more favorable than the Aβ1−42 formation.(24) In the nonamyloidogenic pathway, APP is processed by β′ and α-secretases to produce Aβ11−40/42 and Aβ17−40/42 (also known as p3), respectively. Due to their putative nonamyloidogenic nature, they are currently pursued as a therapeutic avenue for AD treatment. Current AD drugs targeting the Aβ peptides are designed to block production of the full-length peptides. Those that block the γ-secretase generally lead to side effects, since the γ-secretase also cleaves the transmembrane segment of the Notch protein.(25) Thus, increasingly, drug development efforts target the β-secretase (commonly called BACE) pathway. Yet, drugs that block the β-secretase lead to enhanced production of the N-terminal truncated peptides, such as the Aβ11−42 and similar drugs that stimulate α secretase produce p3 (Figure 1b).(26) Until recently, these truncated Aβ peptides were thought to be nontoxic to neurons. However, recent studies using complementary techniques of molecular dynamics (MD) simulations, atomic force microscopy (AFM), planar lipid bilayer recordings, cell calcium imaging, neuritic degeneration, and cell death assays suggested that nonamyloidogenic p3 and N9 (Aβ9−42) peptides form toxic ion channels.(27) Remarkably, the channel morphology, conductance, and cellular toxicity produced by these truncated Aβ peptides are very similar to those obtained by the full-length Aβ1−40/42 channels.1,14 In addition, since p3 peptides are the major constituent of preamyloid and neuritic plaques in the brain of Down syndrome (DS) patients, p3 channels may also occur in DS.(28)
Figure 1.

Cartoons representing the cleavage process by α-, β-, and γ-secretases of the amyloid precursor protein (APP). Various Aβ fragments are processed by different secretase combinations. (a) Amyloidogenic fragments of Aβ1−40/42 are produced by β- and γ-secretase cleavage, and (b) nonamyloidogenic fragments p3 (Aβ17−40/42) are cleaved by α- and γ-secretases.
Motivated by the AFM images of full-length Aβ1−40/42 channels,1,14 our computational efforts27,29−33 attempted to capture the detailed features of their structure and function at atomic resolution. However, our simulations were for the N-terminal truncated Aβ peptides. Because the N-terminal is disordered, experiment-based coordinate sets are available only for p3 and Aβ9−42. p3 (Aβ17−42) (26 residues; ∼2.6 kDa/monomer) is extracted from a small protofibril coordinate set(34) based on two-dimentional NMR in combination with solid state NMR (ssNMR), mutational data and electron microscopy. N9 (Aβ9−42) (34 residues; ∼3.6 kDa/monomer; adding Ile41 and Ala42 to Aβ9−40 coordinates) is taken from ssNMR-based coordinates.(35) In both coordinate sets, the Aβ peptides adopted the U-shaped, β-strand-turn-β-strand motif, which was first predicted by the modeling of Aβ16−35.(36) This motif was subsequently observed in other amyloids, in the ssNMR structure of the K3,(37) and in the CA150 WW domain.(38) It is a general feature of amyloid organization,39−44 and no amyloid oligomers were observed experimentally with other conformations. We explicitly simulated the channels in the zwitterionic bilayer containing 1,2-dioleoyl-sn-glycero-3-phosphocholine (DOPC), which is the lipid used in the AFM experiments,1,14,27 or in the anionic bilayer containing palmitoyl-oleyl-phosphatidylcholine (POPC) and palmitoyl-oleyl-phosphatidylglycerol (POPG) (POPC/POPG = 4:1, molar ratio).
To obtain the optimal channel sizes and apparent molecular mass, we used our previous protocols27,29−33 to comprehensively test, at the atomic scale, a range of p3 channel sizes similar to those tested for the N9 channels.(31) We investigated p3 channels with five different sizes: 12-, 16-, 20-, 24-, and 36-mer. Our experimental data showed that the p3 channels exhibit subunits morphology, conduct currents, induce cellular calcium uptake (an effect that is inhibited by Zn2+), and mediate neurite degeneration.(27) We compared the computed preferred channel sizes with those of toxic β-sheet channels derived from other peptides, including K3 and PG-1.32,45 We observed that toxic β-sheet channels typically consist of loosely associated mobile subunits, and the bilayer does not support channels that are too large (36-mers) or too small (12-mers). We conclude that they all display the same preferred size range of 16−24 mers. This has important implications for drug design for blocking toxic β-sheet channels.
Materials and Methods
The Aβ17−42 monomer conformation was used to construct channels with annular shapes (Figure 2). The initial monomer coordinates were taken from the three-dimensional structure of Alzheimer’s Aβ1−42 fibrils (PDB code: 2BEG; presented as pentamers; residues 1−16 are missing due to disorder).(34) Annular shapes were obtained through rotations of monomer 12, 16, 20, 24, and 36 times with respect to the pore axis (Figure 2). The channel is then minimized with a rigid body motion for the peptides to enhance the formation of backbone hydrogen bonds (H-bonds) within a β-sheet and then embedded in the DOPC bilayer. The 24-mer channels are also simulated in the anionic bilayer containing POPC and POPG with a molar ratio of 4:1. A unit cell containing two layers of lipids with 90 000−200 000 atoms, depending on the channel size, is constructed. In the bilayer construction, our method closely follows previous β-sheet channel simulations.27,29−33 For the lipid bilayer, 200−500 lipids constitute the unit cell with TIP3P waters added at both sides. The system contains MgCl2, KCl, CaCl2, and ZnCl2 at the same concentration of 25 mM to satisfy a total cation concentration near 100 mM.
Figure 2.

The p3 (Aβ17−42) monomer extracted from the NMR pentamer(34) shown by the peptide backbone in a ribbon representation (left). Building an annular channel structure with the CNpNC topology embedded in the lipid bilayers using the NMR-based p3 monomer (right). In the peptide, hydrophobic residues are shown in white, two polar residues (Ser26 and Asn27) and five Gly residues (at locations 25, 29, 33, 37, and 38) are shown in green, a positively charged residue (Lys28) is shown in blue, and two negatively charged residues (Glu22 and Asp23) are shown in red. Key residues (Phe19, Glu22, Asp23, Lys28, and Met35) are marked.
The CHARMM program(46) was used to construct the set of starting points and to relax the systems to a production-ready stage. In the pre-equilibrium stages, the initial configurations were gradually relaxed with the channels held rigid. A series of dynamic cycles were performed with the harmonically restrained peptides in the channels, and then the harmonic restraints were gradually diminished with the full Ewald electrostatics calculation and constant temperature (Nosé−Hoover) thermostat/barostat at 300 K. The entire pre-equilibration cycle took 5 ns to yield the starting point. Simulations for the initial construction and the preequilibration were performed on the NPAT (constant number of atoms, pressure, surface area, and temperature) ensemble. For production runs to 30 ns for the 12- to 24-mer channels and to 50 ns for the 36-mer channels, the NAMD code(47) on a Biowulf cluster at the National Institutes of Health, Bethesda, MD (http://biowulf.nih.gov) was used for the starting point. Averages were taken after 10 ns discarding initial transients.
Results
Conformational Evolution of the p3 Channel in the Lipid Bilayers
For convenience, we classify the channels into three groups: small (12-mer), intermediate (16-, 20-, 24-mer), and large (36-mer). We selected 36-mer to be the upper limit, since size exclusion chromatography indicated that medium-to-large globulomers of (at least) 90−110 kDa lead to increased membrane permeability,(20) and no channels were observed for these particles. The molecular weight of the 36-mer p3 (94 kDa) channel is >90 kDa. We focus only on the pore-preserving CNpNC topology (where C and N represent C- and N-terminal respectively, and p denotes the pore) with the hydrophobic C-terminal β-strands interacting with the membrane bilayer and the N-terminal β-strands, containing polar and charged residues, facing and forming the solvated pore.29,30 The hydrophobic match between the peptide and lipid maintains the stability of the β-sheet channels.
The designed channels have a perfectly annular shape in a void (Figure 2). In the initial annular structure, the pore-lining N-terminal strands form a β-sheet with intermolecular backbone H-bonds, which is not the case for the lipid-contacting outer C-terminal β-strands because of the larger curvature at the channel periphery (except the large 36-mer). The channels gradually relax in the lipid bilayer (Figure 3), and their optimized subunits can be observed after 5 ns (Figure 3c). The averaged peptide interaction energies for the peptide interactions with their surrounding environments, including other peptides, lipids, and water, reach equilibration at t > 10 ns (Figure S1), suggesting that the channels are fully relaxed in the lipid bilayers after the initial transient state. In our previous simulations for the same peptides in solution, double-layered U-shaped peptide interactions with matching the C-terminal hydrophobic sheet−sheet association produced the stable structures of linear(43) and annular(44) fibrils.
Figure 3.

(a) Conceptual design of annular structure for the 20-mer p3 (Aβ17−42) channel and (b) the starting point of production run in the DOPC bilayer. Snapshots of the p3 channel taken at the simulation times of t = (c) 5, (d) 10, (e) 15, (f) 20, (g) 25, and (h) t = 30 ns. The cartoons representing the channel are in angle view with the same color representations described in Figure 2.
The p3 channels increase their outer and inner pore diameters during the simulations. Figure 4 shows the averaged channel structures for all simulated sizes. The averaged pore structures are calculated by the HOLE program.(48) For the intermediate 16-, 20-, and 24-mer channels, the outer diameter of the simulated channels range between ∼6.9 and 8.0 nm, and the pore diameter ranges between ∼1.7 and 2.5 nm. Recent AFM images(27) show that for both p3 and N9 channels, the outer and inner diameter of the channels are ∼6−10 nm and ∼1−2 nm, respectively, consistent with the simulations. However, the 12-mer pore diameter is smaller (∼0.8 nm), and the 36-mer pore diameter (∼3.9 nm) is too large compared with experimental channels, although their outer dimensions are in the experimental range. The morphological features of the various p3 channels structures are similar to those of the N9 channels, although the details differ.(31)
Figure 4.

Averaged pore structures calculated by the HOLE program(48) embedded in the averaged channel conformations during the simulations for the 12-, 16-, 20-, 24-, and 36-mer p3 (Aβ17−42) channels. The 12-, 16-, 20-, and 36-mer structures were obtained from the simulations in the zwitterionic DOPC bilayer. The 24-mer structure was obtained from the anionic bilayer containing POPC and POPG with a molar ratio of 4:1. In the angle views of the pore structure (upper row), whole channel structures are shown with the ribbon representation with the same color representations described in Figure 2. In the lateral views of the pore structure (lower row), cross-sectioned channels are given in the surface representation with the same color representations used in Figure 2. For the pore structures in the surface representation, the degree of the pore diameter is indicated by the color codes in the order of red < green < blue, but the scale of these colors is relative to each channel.
Subunit Organization Morphology of the p3 Channels
The p3 channels gradually relax during the simulations. For the small and intermediate p3 channels, as the simulations progress, the inner β-sheet that is initially circular breaks into several small pieces. This inner β-sheet optimization induces β-sheet formation at the outer rim, leading to the observed “subunits”. In the 36-mer channel with smaller curvature, an outer β-sheet was initially present; however, the β-sheet optimization still favors subunit formation. The discontinuous β-sheet network can determine the boundary between the ordered subunits in the channels. Here, the ordered subunits are defined by several criteria: mapping of x, y coordinates of the β-strands of each peptide onto the x−y plane (Figure 5a); description of secondary structure by STRIDE(49) (Figure 5b); “straightness” of the strands by the β-strand order parameters using Sβ = (1/Nv) ∑k = 1Nv((3 cos 2 θα − 1)/2), where θα is the angle between the positional vectors connecting two Cα atoms and Nv is the total number of vector pairs (Figure 5c); the averaged β-strand B-factor or temperature factor is calculated from the rms fluctuations(50) relative to the starting point during the simulations with a simple correlation of B = 8π2(⟨RMSF2⟩/3) (Figure 5d); and the percent of β-sheet content is based on the intermolecular backbone H-bonds between β-strands (Figure 5e). β-Strand mapping reveals the heterogeneous channel shapes, where the 20-mer p3 channel exhibits a pentagonal shape. In the subunits, the β-strands retain the β-sheet secondary structure with a large value of Sβ and a small value of the β-strand B-factor.
Figure 5.

Parameters to define the subunits for the 20-mer p3 (Aβ17−42) channel: (a) mapping of x, y coordinates of the β-strands of each peptide onto the x−y plane, (b) the description of secondary structure by STRIDE,(49) (c) the β-strand order parameter Sβ-strand, (d) the averaged β-strand B-factor, and (e) percent of β-sheet content. In the β-strands mapping, the contour lines enclose the high-frequency regions in the order of red < orange < yellow < green < blue. The secondary structure by STRIDE was calculated for the averaged structure. The β-strand order parameter, the averaged β-strand B-factor from the β-strand RMSF, and the β-sheet content based on the intermolecular backbone H-bonds are calculated for the N-terminal (blue area) and C-terminal (green area) β-strands separately as a function of peptide number. Peaks in the Sβ-strand and percent of β-sheet content curves indicate a well-ordered β-strand, whereas troughs in the β-strands B-factor curves denote the ordered β-strand.
The subunit appearance in the channel structure is caused by the β-strands optimization, which depends on the lipid dynamics during the simulation. We obtain four subunits in the 16-mer channel and five subunits in the 20- and 24-mer channels (Figure 6a). Our previous 16-mer simulations obtained four or five subunits,(27) and previous 24-mer simulations obtained three or five subunits29,30 in the DOPC bilayer, suggesting that subunit formations result from the fluidic lipid bilayer dynamics, even for the same channels. We note that the 24-mer simulation obtained five subunits in the anionic bilayer (POPC/POPG = 4:1), the same number of subunits as obtained in the DOPC bilayer.(30) However, we are unable to determine the subunits in the small 12-mer channel because of the collapsed pore. The 36-mer p3 channel forms six subunits, but the channel is fissile, which is similar to the 36-mer N9 channel.(31) The fluidic lipid bilayer does not support such a large pore (almost ∼4 nm diameter) and induces a spontaneous reduction of the channel via subunits association−dissociation dynamics. The morphology of p3 channels is consistent with the subunit organization observed with AFM.(27) High-resolution AFM images of individual p3 channels show porelike structures with four to five subunits (Figure 6b), consistent with the intermediate p3 channels obtained by MD simulations. The different number of subunits observed in the AFM channel images suggests that the channels are dynamic associations with mobile subunits.
Figure 6.
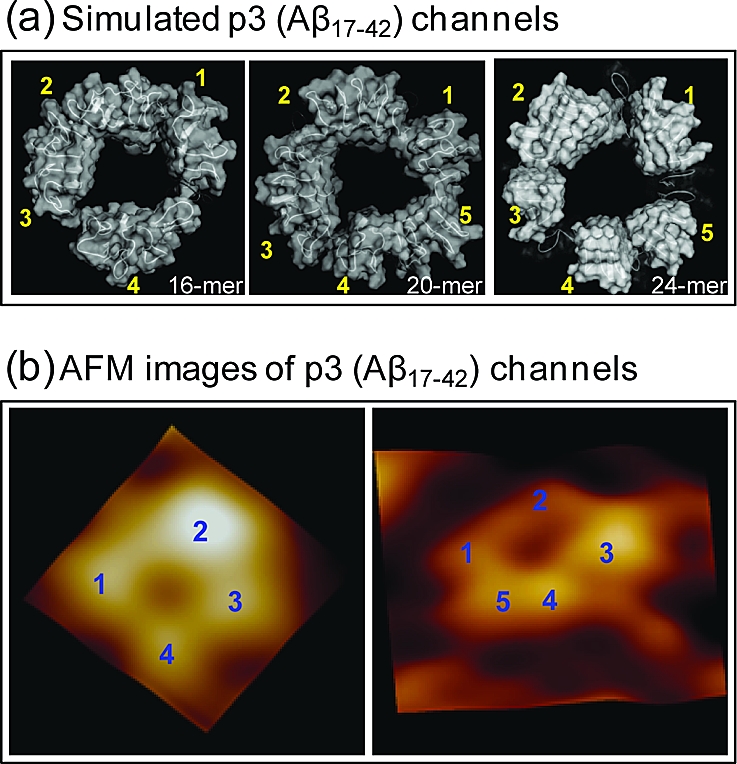
A side-by-side comparison between the computational and the experimental channels. (a) The simulated channel structures with highlighted subunits for the 16-, 20-, and 24-mer p3 (Aβ17−42) channels. The 16- and 20-mer structures were obtained from the simulations in the zwitterionic DOPC bilayer. The 24-mer structure was obtained from the anionic bilayer containing POPC and POPG at a molar ratio of 4:1. The averaged channels in the surface representation are shown in the view along the membrane normal. (b) AFM images of p3 (Aβ17−42) channels show four or five subunits consistent with the simulated channels. Image sizes are 15 × 15 nm2 and 23 × 23 nm2, respectively (Jang et al.,(27) Permission will be obtained.)
Cation-Permeable p3 Channels
Electrophysiological studies showed heterogeneous single channel conductance for truncated Aβ channels.(27) The heterogeneous channel currents suggest that multiple arrangements of oligomeric subunits with various sizes of the inner pore lead to multiple conductances. In previous studies,27,29−31 we suggested that the negatively charged Glu22 side chains serve as cation binding sites, attracting cations into the pore. The ions’ behavior in the pore can be observed through calculations of the potential of mean force (PMF) representing the relative free energy profile for each ion across the bilayer. In addition to the cation binding sites in the pore, cations can also interact with the phosphate headgroups at the lipid/water interface in both bilayer leaflets and the Aβ C-termini. Thus, the radical cation interactions may lead to PMF curves with three minima. In the simulations, the channel systems contain four cations, Mg2+, Ca2+, K+, and Zn2+, at the same concentration (25 mM), and an anion, Cl− (Figure 7).
Figure 7.
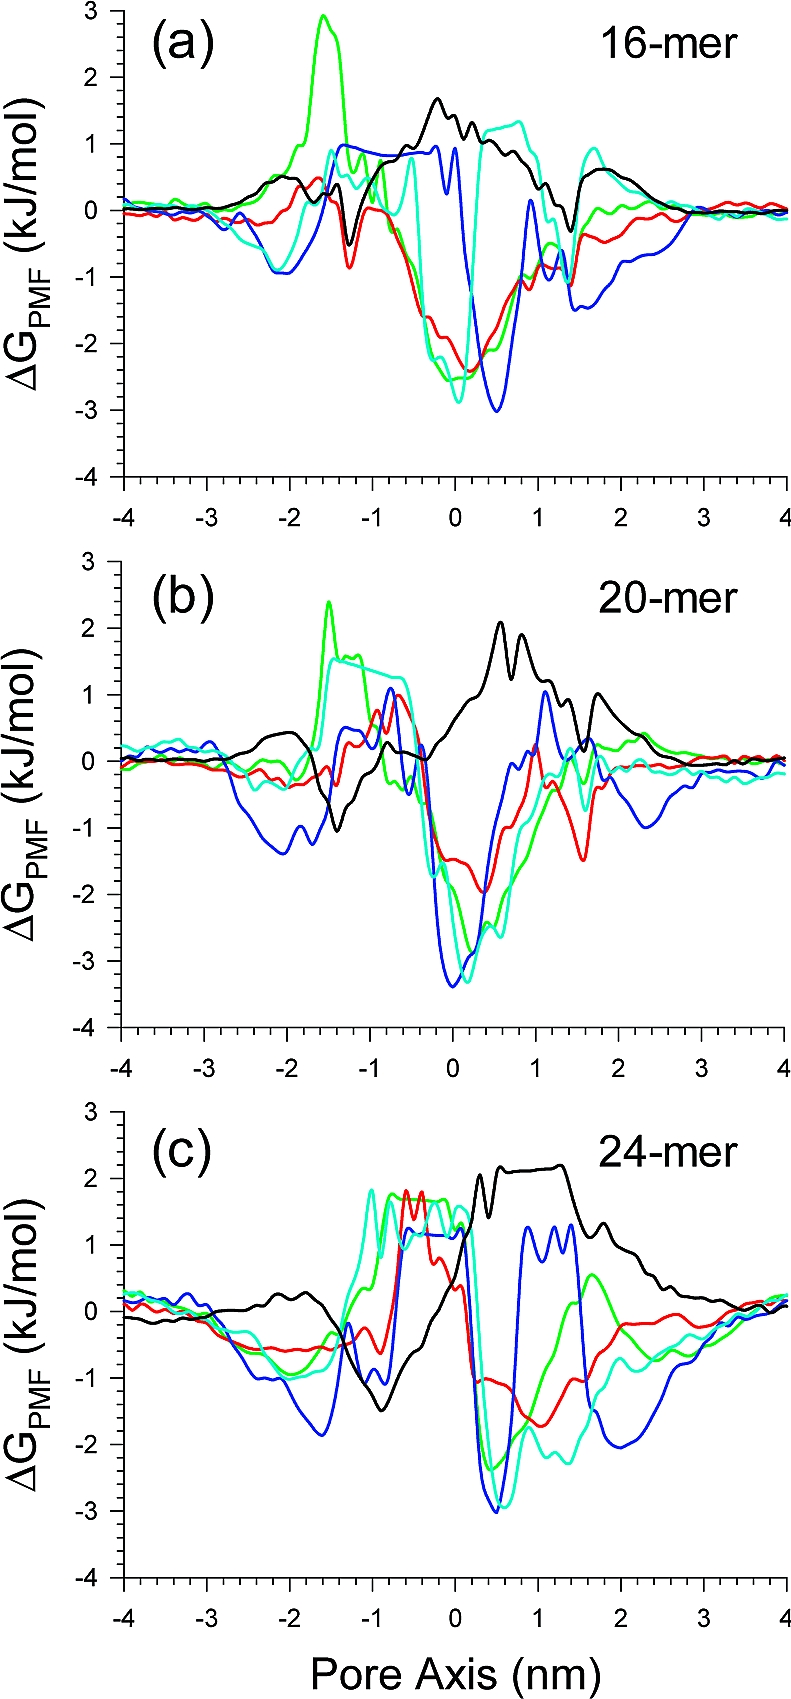
Potential of mean force (PMF), ΔGPMF, calculated using the equation ΔGPMF = −kBT ln(ρz/ρbulk), where kB is the Boltzmann constant, T is the simulation temperature, ρz is the ion density at the position z along the pore axis, and ρbulk is the ion density in the bulk region, representing the relative free energy profile for Mg2+ (green lines), K+ (red lines), Ca2+ (blue lines), Zn2+ (cyan lines), and Cl− (black lines) as a function of the distance along the pore center axis for the (a) 16-, (b) 20-, and (c) 24-mer p3 (Aβ17−42) channels. The PMF results for the 16- and 20-mers were obtained from the simulations in the zwitterionic DOPC bilayer. The PMF result for the 24-mer was obtained from the anionic bilayer containing POPC and POPG at a molar ratio of 4:1.
As observed in previous simulations, both Ca2+ and Zn2+ exhibit a low mobility at the binding sites, unlike Mg2+ and K+. In the pore, Ca2+ are dominantly trapped by the side chains without Zn2+,(29) but the binding probability of Ca2+ at the side chains is reduced in the presence of Zn2+. The intermediate (16-, 20-, and 24-mer) p3 channels lead to a relatively low free energy profile at the cation binding sites in the pore. However, in the pore of the 12-mer channel, the cation binding sites are buried in the collapsed pore (Figure S2). The monotonic PMF curves for each cation in the 36-mer channel suggest nonselective ion leakiness due to the large pore (Figure S2). The p3 channels prevent Cl− from entering the pore, presenting a high free energy barrier, which indicates a distinct pore as compared to the N9 channels.(31)
The interactions of the peptides with ions may suggest different binding affinities for ions in the pore. We calculated the interaction energy for each peptide with ions and then averaged the peptide interaction energy over time and the number of peptides in the channel (Figure 8). The peptide interaction energies suggest that, as expected, peptide interactions with K+ and Cl− are weak since both K+ and Cl− have a single charge. For double-charged ions Mg2+, Ca2+, and Zn2+, relatively strong peptide interactions with those ions can be observed due to the strong electrostatic attraction. The p3 peptides favor interaction with the ions in the order of Zn2+ > Ca2+ > Mg2+ > K+ ≈ Cl−. Strong peptide interaction with Zn2+ indicates that Zn2+ blocks the binding sites, preventing the other cations getting into the pore. It has been noted that Zn2+ inhibits Aβ toxicity, serving as channel blocker by reducing calcium transport.1−17,27
Figure 8.

Averaged peptide interaction energy with ions in the simulations for the 16-, 20-, and 24-mer p3 (Aβ17−42) channels. The interaction energies for the 16- and 20-mer were obtained from the simulations in the zwitterionic DOPC bilayer. The interaction energy for the 24-mer was obtained from the anionic bilayer containing POPC and POPG at a molar ratio of 4:1.
Discussion
Here, we performed explicit molecular dynamics simulations of p3 channels. Using NMR-based Aβ oligomer coordinates,(34) we conceptually designed the initial channels as perfectly annular structures in lipid bilayers. We simulated different sizes of the channels (12-, 16-, 20-, 24-, and 36-mer channels) to obtain the preferred channel range. Consistent with the N9 channels,(31) the 16-, 20-, and 24-mer simulations obtain channels with similar subunit organization and dimensions as imaged by AFM,(27) allowing us to derive the apparent molecular mass of the AFM-imaged channels. We observe that the channels have a lower molecular mass than that of the large Aβ oligomers.(20) This range also holds for N9 channels: the smaller (12-mer) p3 channel collapses and the larger (36-mer) p3 channel is not supported by the bilayer. Moreover, although we did not test a range of channel sizes for the K3 fragment (also presenting the U-shaped motif of β-strand-turn-β-strand by ssNMR(37)), the 24-mer also presented consistency with AFM(33) leading us to conclude that for the U-shaped β-structure organization, these ranges are determined by the bilayer, regardless of the truncated peptide sequence and length. We further note that in our simulations of the cytolytic PG-1, we observed that 8−10 monomers form channels.32,45 Since the PG-1 monomers have a β-hairpin conformation and the hairpins are organized side-to-side, effectively, the channel size is similar, consisting of 16−20 β-strands.
The p3 channels preserve the distinct amyloid channel structures with shapes varying from rectangular with four subunits to hexagonal with six. The channels are formed by loosely attached mobile subunits with shapes, morphologies and dimensions similar to those imaged by AFM.1,14,27 One possible scenario is that preassembled small Aβ oligomers insert into the cell membranes from the extracellular side, dynamically assembling to form the channels. The dynamics of subunit association/dissociation may relate to the cellular ionic leakiness: Toxic amyloid channels differ from functional gated channels that fold into specific and stable native structures optimized by evolution. Amyloid channels are nonphysiological, representing a diseased misfolded state. The Aβ amyloid channel features are shared by the cytolytic PG-1 and the K3 β-sheet channels,32,33 which are also cytotoxic.(51)
The p3 channels show cation permeability. The cation binding sites in the optimal 16-, 20-, and 24-mer channels provide relatively low free-energy profiles, especially for Ca2+ or Zn2+ compared with other cations, indicating selective affinity for calcium as observed experimentally.1−17,27 The p3 peptides favor interaction with Zn2+ more strongly than with Ca2+. This may account for the pore inhibition by Zn2+,1−17,27 leading us to speculate that Zn2+ can cover the cation binding sites, blocking Ca2+ from entering the pore.
Conclusions
To conclude, our MD simulations of ion-permeable channels of the nonamyloidogenic p3 (Aβ17−42) peptides provide a preferred size range, between 16 and 24 β-strands lining the pores. Comparison with the previously tested Aβ9−42 presents a similar range. This size is consistent with AFM images and with size-exclusion chromatography and provides an estimate of the channel molecular mass observed with AFM. Comparison with the K3 channels(33) shows a similar preference, which is also consistent with the PG-1 β-hairpin channels,32,45 presenting a similar number of pore-lining β-strands. This suggests that the β-structure-based channel size is independent of the sequence. In channels that are too large, the loosely associated subunits would drift away in the fluidic bilayer. This is clearly different from the physiological gated ion channels that have a particular size and subunit organization optimized by evolution to robustly regulate the ionic flux via conformational changes associated with opening and closing the gates.52−54 We emphasize, however, that although these results are consistent with previous modeling and experimental data,27,29−31 other candidates for the structural models can also be consistent with current experimental data. Aβ is highly polymorphic; as such we can expect a range of structures in the rugged oligomeric energy landscape.(55) Among these, a β-barrel is a possible variant (unpublished data). It would be interesting to see how the fluidic membrane supports an intact β-barrel structure, which is an evolutionarily optimized β-sheet structure.
Acknowledgments
This project has been funded in whole or in part with Federal funds from the National Cancer Institute, National Institutes of Health, under Contract no. HHSN261200800001E. The content of this publication does not necessarily reflect the views or policies of the Department of Health and Human Services, nor does mention of trade names, commercial products, or organizations imply endorsement by the U.S. Government. This research was supported (in part) by the Intramural Research Program of the NIH, National Cancer Institute, Center for Cancer Research. This project has been funded by the NIH (NIA) extramural program (RL). All simulations had been performed using the high-performance computational facilities of the Biowulf PC/Linux cluster at the National Institutes of Health, Bethesda, MD (http://biowulf.nih.gov).
Supporting Information Available
Two online figures, Figure S1 and S2. This material is available free of charge via the Internet at http://pubs.acs.org.
Funding Statement
National Institutes of Health, United States
Supplementary Material
References
- Quist A.; Doudevski I.; Lin H.; Azimova R.; Ng D.; Frangione B.; Kagan B.; Ghiso J.; Lal R. Proc. Natl. Acad. Sci. U.S.A. 2005, 102, 10427–10432. [DOI] [PMC free article] [PubMed] [Google Scholar]
- Arispe N.; Pollard H. B.; Rojas E. Proc. Natl. Acad. Sci. U.S.A. 1993, 90, 10573–10577. [DOI] [PMC free article] [PubMed] [Google Scholar]
- Arispe N.; Pollard H. B.; Rojas E. Mol. Cell. Biochem. 1994, 140, 119–125. [DOI] [PubMed] [Google Scholar]
- Arispe N.; Pollard H. B.; Rojas E. Proc. Natl. Acad. Sci. U.S.A. 1996, 93, 1710–1715. [DOI] [PMC free article] [PubMed] [Google Scholar]
- Arispe N.; Diaz J. C.; Flora M. Biophys. J. 2008, 95, 4879–4889. [DOI] [PMC free article] [PubMed] [Google Scholar]
- Capone R.; Quiroz F. G.; Prangkio P.; Saluja I.; Sauer A. M.; Bautista M. R.; Turner R. S.; Yang J.; Mayer M. Neurotox. Res. 2009, 16, 1–13. [DOI] [PMC free article] [PubMed] [Google Scholar]
- Hirakura Y.; Lin M. C.; Kagan B. L. J. Neurosci. Res. 1999, 57, 458–466. [DOI] [PubMed] [Google Scholar]
- Hirakura Y.; Yiu W. W.; Yamamoto A.; Kagan B. L. Amyloid 2000, 7, 194–199. [DOI] [PubMed] [Google Scholar]
- Kawahara M.; Arispe N.; Kuroda Y.; Rojas E. Biophys. J. 1997, 73, 67–75. [DOI] [PMC free article] [PubMed] [Google Scholar]
- Kawahara M.; Kuroda Y. Brain Res. Bull. 2000, 53, 389–397. [DOI] [PubMed] [Google Scholar]
- Kawahara M.; Kuroda Y.; Arispe N.; Rojas E. J. Biol. Chem. 2000, 275, 14077–14083. [DOI] [PubMed] [Google Scholar]
- Kourie J. I.; Henry C. L.; Farrelly P. Cell. Mol. Neurobiol. 2001, 21, 255–284. [DOI] [PMC free article] [PubMed] [Google Scholar]
- Lin H.; Zhu Y. J.; Lal R. Biochemistry 1999, 38, 11189–11196. [DOI] [PubMed] [Google Scholar]
- Lin H.; Bhatia R.; Lal R. FASEB J. 2001, 15, 2433–2444. [DOI] [PubMed] [Google Scholar]
- Rhee S. K.; Quist A. P.; Lal R. J. Biol. Chem. 1998, 273, 13379–13382. [DOI] [PubMed] [Google Scholar]
- Simakova O.; Arispe N. J. Biochemistry 2006, 45, 5907–5915. [DOI] [PubMed] [Google Scholar]
- Zhu Y. J.; Lin H.; Lal R. FASEB J. 2000, 14, 1244–1254. [DOI] [PubMed] [Google Scholar]
- Kagan B. L. Science 2005, 307, 42–43; author reply pp 42−43. [DOI] [PubMed] [Google Scholar]
- Selkoe D. J. Nature 1991, 354, 432–433. [DOI] [PubMed] [Google Scholar]
- Kayed R.; Sokolov Y.; Edmonds B.; McIntire T. M.; Milton S. C.; Hall J. E.; Glabe C. G. J. Biol. Chem. 2004, 279, 46363–46366. [DOI] [PubMed] [Google Scholar]
- Sokolov Y.; Kozak J. A.; Kayed R.; Chanturiya A.; Glabe C.; Hall J. E. J. Gen. Physiol. 2006, 128, 637–647. [DOI] [PMC free article] [PubMed] [Google Scholar]
- Bucciantini M.; Giannoni E.; Chiti F.; Baroni F.; Formigli L.; Zurdo J.; Taddei N.; Ramponi G.; Dobson C. M.; Stefani M. Nature 2002, 416, 507–511. [DOI] [PubMed] [Google Scholar]
- Walsh D. M.; Klyubin I.; Fadeeva J. V.; Cullen W. K.; Anwyl R.; Wolfe M. S.; Rowan M. J.; Selkoe D. J. Nature 2002, 416, 535–539. [DOI] [PubMed] [Google Scholar]
- Singh R.; Barman A.; Prabhakar R. J. Phys. Chem. B 2009, 113, 2990–2999. [DOI] [PubMed] [Google Scholar]
- Nunan J.; Small D. H. FEBS Lett. 2000, 483, 6–10. [DOI] [PubMed] [Google Scholar]
- Thinakaran G.; Koo E. H. J. Biol. Chem. 2008, 283, 29615–29619. [DOI] [PMC free article] [PubMed] [Google Scholar]
- Jang H.; Arce F. T.; Ramachandran S.; Capone R.; Azimova R.; Kagan B. L.; Nussinov R.; Lal R. Proc. Natl. Acad. Sci. U.S.A. 2010, 107, 6538–6543. [DOI] [PMC free article] [PubMed] [Google Scholar]
- Lalowski M.; Golabek A.; Lemere C. A.; Selkoe D. J.; Wisniewski H. M.; Beavis R. C.; Frangione B.; Wisniewski T. J. Biol. Chem. 1996, 271, 33623–33631. [DOI] [PubMed] [Google Scholar]
- Jang H.; Zheng J.; Nussinov R. Biophys. J. 2007, 93, 1938–1949. [DOI] [PMC free article] [PubMed] [Google Scholar]
- Jang H.; Zheng J.; Lal R.; Nussinov R. Trends Biochem. Sci. 2008, 33, 91–100. [DOI] [PubMed] [Google Scholar]
- Jang H.; Arce F. T.; Capone R.; Ramachandran S.; Lal R.; Nussinov R. Biophys. J. 2009, 97, 3029–3037. [DOI] [PMC free article] [PubMed] [Google Scholar]
- Jang H.; Ma B.; Lal R.; Nussinov R. Biophys. J. 2008, 95, 4631–4642. [DOI] [PMC free article] [PubMed] [Google Scholar]
- Mustata M.; Capone R.; Jang H.; Arce F. T.; Ramachandran S.; Lal R.; Nussinov R. J. Am. Chem. Soc. 2009, 131, 14938–14945. [DOI] [PMC free article] [PubMed] [Google Scholar]
- Luhrs T.; Ritter C.; Adrian M.; Riek-Loher D.; Bohrmann B.; Dobeli H.; Schubert D.; Riek R. Proc. Natl. Acad. Sci. U.S.A. 2005, 102, 17342–17347. [DOI] [PMC free article] [PubMed] [Google Scholar]
- Petkova A. T.; Yau W. M.; Tycko R. Biochemistry 2006, 45, 498–512. [DOI] [PMC free article] [PubMed] [Google Scholar]
- Ma B.; Nussinov R. Proc. Natl. Acad. Sci. U.S.A. 2002, 99, 14126–14131. [DOI] [PMC free article] [PubMed] [Google Scholar]
- Iwata K.; Fujiwara T.; Matsuki Y.; Akutsu H.; Takahashi S.; Naiki H.; Goto Y. Proc. Natl. Acad. Sci. U.S.A. 2006, 103, 18119–18124. [DOI] [PMC free article] [PubMed] [Google Scholar]
- Ferguson N.; Becker J.; Tidow H.; Tremmel S.; Sharpe T. D.; Krause G.; Flinders J.; Petrovich M.; Berriman J.; Oschkinat H.; Fersht A. R. Proc. Natl. Acad. Sci. U.S.A. 2006, 103, 16248–16253. [DOI] [PMC free article] [PubMed] [Google Scholar]
- Lin M. C.; Mirzabekov T.; Kagan B. L. J. Biol. Chem. 1997, 272, 44–47. [DOI] [PubMed] [Google Scholar]
- Hirakura Y.; Azimov R.; Azimova R.; Kagan B. L. J. Neurosci. Res. 2000, 60, 490–494. [DOI] [PubMed] [Google Scholar]
- Hirakura Y.; Kagan B. L. Amyloid 2001, 8, 94–100. [DOI] [PubMed] [Google Scholar]
- Zheng J.; Ma B.; Nussinov R. Phys. Biol. 2006, 3, P1–4. [DOI] [PubMed] [Google Scholar]
- Zheng J.; Jang H.; Ma B.; Tsai C. J.; Nussinov R.. Biophys. J. 2007, 93, 3046−3057. [DOI] [PMC free article] [PubMed] [Google Scholar]
- Zheng J.; Jang H.; Ma B.; Nussinov R. J. Phys. Chem. B 2008, 112, 6856–6865. [DOI] [PMC free article] [PubMed] [Google Scholar]
- Capone R.; Mustata M.; Jang H.; Arce F. T.; Nussinov R.; Lal R. Biophys. J. 2010, 98, 2644–2652. [DOI] [PMC free article] [PubMed] [Google Scholar]
- Brooks B. R.; Bruccoleri R. E.; Olafson B. D.; States D. J.; Swaminathan S.; Karplus M. J. Comput. Chem. 1983, 4, 187–217. [Google Scholar]
- Phillips J. C.; Braun R.; Wang W.; Gumbart J.; Tajkhorshid E.; Villa E.; Chipot C.; Skeel R. D.; Kale L.; Schulten K. J. Comput. Chem. 2005, 26, 1781–1802. [DOI] [PMC free article] [PubMed] [Google Scholar]
- Smart O. S.; Goodfellow J. M.; Wallace B. A. Biophys. J. 1993, 65, 2455–2460. [DOI] [PMC free article] [PubMed] [Google Scholar]
- Frishman D.; Argos P. Proteins 1995, 23, 566–579. [DOI] [PubMed] [Google Scholar]
- Wriggers W.; Mehler E.; Pitici F.; Weinstein H.; Schulten K. Biophys. J. 1998, 74, 1622–1639. [DOI] [PMC free article] [PubMed] [Google Scholar]
- Brogden K. A. Nat. Rev. Microbiol. 2005, 3, 238–250. [DOI] [PubMed] [Google Scholar]
- Roux B. Annu. Rev. Biophys. Biomol. Struct. 2005, 34, 153–171. [DOI] [PubMed] [Google Scholar]
- Tombola F.; Pathak M. M.; Isacoff E. Y. Annu. Rev. Cell. Dev. Biol. 2006, 22, 23–52. [DOI] [PubMed] [Google Scholar]
- Chakrabarti N.; Neale C.; Payandeh J.; Pai E. F.; Pomes R. Biophys. J. 2010, 98, 784–792. [DOI] [PMC free article] [PubMed] [Google Scholar]
- Miller Y.; Ma B.; Nussinov R.. Chem. Rev. 2010, (in press) DOI: 10.1021/cr900377t. [DOI] [PMC free article] [PubMed] [Google Scholar]
Associated Data
This section collects any data citations, data availability statements, or supplementary materials included in this article.