

Abstract
Protein palmitoyltransferases (PATs) represent an exciting new target for anticancer drug design due to their pivotal roles in the subcellular localization of a number of oncogenes. We show that the Huntingtin interacting protein 14 (HIP14) is a PAT with a preference for the farnesyl-dependent palmitoylation motif found in H- and N-RAS. Characterization of HIP14 in mouse cells has revealed that it has the ability to induce colony formation in cell culture, anchorage-independent growth, and tumors in mice. Activity of the enzyme and its ability to transform cells is dependent on critical residues in the active site of the enzyme.
Keywords: palmitoylation, protein, palmitoyl acyltransferase, RAS, intracellular signaling
Introduction
Enzymatic palmitoylation refers to the attachment of a 16-carbon palmitate group to specific cysteine residues of cellular proteins by the palmitoyl acyltransferase (PAT) enzymes (Bouvier et al., 1995). This type of palmitoylation is unique among lipid modifications of proteins, in that it is readily reversible by thioesterases that cleave the palmitate from proteins (Camp and Hofmann, 1993; Camp et al., 1994). The main function of protein palmitoylation is to facilitate membrane binding of the palmitate-modified proteins. Although other fatty acid modifications also increase protein hydrophobicity, those modifications result in only transient membrane association (t½≤1 min) (Schroeder et al., 1997). Furthermore, proteins that undergo palmitoylation in conjunction with either myristoylation or prenylation demonstrate an even stronger membrane association with a t½>70h (Alland et al., 1994; Shahinian and Silvius, 1995).
Diverse subsets of cellular proteins have been shown to contain covalently bound palmitate. Members of this ‘palmitoylome’ can be categorized into four groups based on their sites of palmitoylation (Resh, 1996, 1999). Proteins classified by Resh as Type 1 or Type 2 contain palmitoylation sites on cysteine residues near transmembrane or integral membrane domains, or on cysteine residues in C-terminal or N-terminal regions. These proteins do not appear to contain specific palmitoylation consensus sequences for recognition by PAT enzymes, and are likely to be palmitoylated by nonenzymatic reactions.
Type 3 and Type 4 proteins are of special interest as they contain discrete recognition motifs for PAT enzymes. Type 3 proteins are first farnesylated and then palmitoylated. Examples of these proteins include the H-, N- and K2A- isoforms of RAS and paralemmin. For these proteins, prenylation occurs on the cysteine residue of the C-terminal CAAX motif and this is required for subsequent palmitoylation of one or more cysteine residues located near the farnesylcysteine (Hancock et al., 1989). This C-terminal prenylation motif serves as a palmitoylation signal that is recognized by one or more PAT enzymes. The Type 4 proteins are first N-myristoylated and then palmitoylated. Examples of these proteins include certain Gα subunits and several Src-related tyrosine kinases. These proteins contain a Met1-Gly2-Cys3 sequence that is the site of N-myristoylation following cleavage of the initiator Met1 by methionine aminopeptidase 2, and this is required for the palmitoylation of one or more cysteines near the N-myristoylglycine (Alland et al., 1994; Degtyarev et al., 1994; Morales et al., 1998). This N-myristoylglycine motif also serves as a palmitoylation signal that is recognized by one or more PAT enzymes. The Type 3 and Type 4 proteins represent the two major classes of proteins in human cells with distinct palmitoylation motifs that can be modified enzymatically.
Recent evidence indicates that for many Type 3 and Type 4 proteins, palmitoylation in conjunction with a second fatty acid modification not only targets these proteins to the plasma membrane but specifically targets them also to lipid rafts or caveolae in the plasma membrane (Shenoy-Scaria et al., 1994; Robbins et al., 1995). Lipid rafts and caveolae have been shown to be enriched with signaling proteins (Gorodinsky and Harris, 1995; Simons and Ikonen, 1997; Anderson, 1998; Smart et al., 1999), and are thought to play a role in signal transduction by effectively increasing the local concentrations of these signaling components. In many forms of cancer, these signaling molecules are the cellular components that are mutated or misregulated.
One signal transduction component that is a good candidate for cancer therapeutics is RAS. RAS genes are mutated in 55–60% of thyroid tumors, approximately 50% of colon tumors, 30% of liver tumors, and 90% of pancreatic tumors, making these oncoproteins significant inducers of human cancer (reviewed in Downward, 2003). In addition, overexpression of normal RAS proteins can lead to unregulated cell proliferation. The fact that these proteins lay downstream from growth factor receptors that may be inappropriately activated in many cancers makes it likely that RAS inhibitors will be therapeutically effective even in cancers in which mutation of RAS genes are infrequent.
Since the post-translational processing of RAS proteins is critical for their function, the enzymes involved in these modifications have been considered as prime targets for anticancer drugs (Leonard, 1997; Waddick and Uckun, 1998). To date, the farnesyltransferases (FTases) have been the main focus for the development of anti-RAS agents. As a result, several classes of compounds that inhibit the enzyme have been described, and a number are in clinical trials. The majority of FTase inhibitors are peptidomimetics that compete with the CaaX tetrapeptide recognition motif (reviewed in Sausville et al., 2003). Additionally, benzodiazepine derivatives (James et al., 1993), farnesyl analogues (Eummer et al., 1999), and phenylacetate (Danesi et al., 1996) have been shown to inhibit the farnesylation of RAS.
The final step in processing certain RAS proteins is the addition of palmitate moieties to one (N-RAS and K-RAS2A) or two (H-RAS) cysteines adjacent to the farnesylated cysteine of the CaaX motif by PAT enzymes. This modification is critical for the proper localization and function of these RAS isoforms (Dunphy and Linder, 1998; Booden et al., 1999; Apolloni et al., 2000). Despite the accumulation of evidence showing that the palmitoylation of various proteins, including RAS, is critical for their biologic functions, the enzymes involved in this process are still poorly understood. Several groups have sought to purify PAT enzymes (Gutierrez and Magee, 1991; Liu et al., 1996; Das et al., 1997; Ueno and Suzuki, 1997; Hiol et al., 2003), unfortunately none have provided any examples of bona fide human Pat enzymes.
The identification and characterization of the yeast proteins AKR1 and ERF2/ERF4 as PAT enzymes have provided critical insights to aid in the search for the human homologues of these enzymes. Roth et al. (2002) have shown that the yeast protein Akr1p, which localizes to the Golgi, is a PAT enzyme. Sequence analyses of the Akr1p indicated that it contains ankryn repeats and a DHHC cysteine-rich domain. The approximately 50 residue long DHHC domain is a variant of the C2H2 zinc-finger domain (Putilina et al., 1999), defined by the core Asp-His-His-Cys tetrapeptide sequence. Homology studies have already identified over 120proteins containing the essential DHHC-cysteinerich domain of Akr1p in Saccharomyces cerevisiae, Drosophila melanogaster, Caenorhabditis elegans, Mus musculus, Homo sapiens, and Arabidopsis thaliana, with at least 23 DHHC-containing proteins in H. sapiens (Roth et al., 2002). Although it is unlikely that all proteins containing the DHHC domain are PATs, they have provided a reference point to aid in the search for human PATs.
A protein that shares significant sequence and domain architectural homology with Akr1p, called Huntingtin interacting protein 14 (HIP14), has been identified in the human brain (Singaraja et al., 2002). Although expression of HIP14 in akr1 knockout yeast results in the partial rescue of the endocytosis of the sex hormone receptor Ste3p, the function of HIP14 and its potential role in palmitoylation in human cells are yet to be determined. Although Singaraja et al. identified HIP14 as a homologue of AKR1, further comparison of the 50 residues surrounding the DHHC domain of HIP14 shows that this region has slightly higher homology to ERF2 (unpublished observation). Interestingly, ERF2 has been shown to be the yeast RAS palmitoyltransferase (Bartels et al., 1999; Lobo et al., 2002).
This report describes the characterization of HIP14 in murine cells using RNAi, overexpression, and an in vitro palmitoylation assay. The results demonstrate that HIP14 has PAT activity with a preference for the farnesylated-palmitoylation motif found in proteins such as H-RAS. Our data also show for the first time that overexpression of HIP14 can transform cells, with these cells forming aggressively growing tumors in mice. Tumor studies in these mice using direct injections of HIP14 short interfering RNA (siRNA) have demonstrated the potential efficacy of small molecule inhibitors of PATs as anticancer therapeutics.
Results and discussion
The in vitro palmitoylation assay developed in this laboratory (Varner et al., 2002) has demonstrated an increase in palmitoylation activity in RAS-transformed NIH 3t3 cells as compared to wild-type cells. This increased PAT activity is specific for a peptide substrate that mimics the C-terminal RAS farnesylated-palmitoylation motif, FarnCNRas(NBD), but not toward one that mimics the N-terminal myristoylated-palmitoylation motif, MyrGCK(NBD) (Varner et al., 2002, 2003). These two substrates represent the two palmitoylation motifs identified for cellular proteins (Resh, 1999) that are clear targets for PAT enzymes (Varner et al., 2002, 2003). RT–PCR analysis of RNA from these same cells has revealed that HIP14 is overexpressed in N-, K-, and H(EJ)-RAS-transformed NIH 3t3 cells, with EJ-RAS cells having the highest level of HIP14 message (Figure 1). These cells also showed the greatest increase in PAT activity, making them ideal for exploring the relationship between HIP14 and PAT activity.
Figure 1.

PAT activity and HIP14 mRNA levels. The in vitro palmitoylation assay performed using wild-type, three RAS-transformed NIH 3t3 cell lines, and three human tumor cell lines. In vitro palmitoylation assays consisted of 10 μM MyrGCK(NBD) peptide with 2 μM palmitoyl-CoA or 20 μM FarnCNRas(NBD) peptide and 4 μM palmitoyl-CoA, 50 μg membrane protein, in 100 μl acylation buffer. The assays were initiated by incubating the peptide substrate with membrane fractions from the indicated cell lines in acylation buffer for 8 min at 37°C with agitation. Palmitoyl-CoA is added to start the reaction and incubation was continued at 37°C for an additional 7.5 min. Palmitoylated peptides were resolved by HPLC using a reverse phase wide pore butyl column. RT–PCR analyses were preformed using 1 μg of total RNA isolated from the indicated cell lines and primers that recognize both human and mouse HIP14
Characterization of HIP14 by RNAi
Given the correlation between expression of HIP14 and PAT activity, the question remained; would abrogating HIP14 message have an effect on PAT activity? To address this question, siRNAs were generated to knockdown HIP14 expression in both human and mouse cell lines. The most effective 21-mer sequence starts at nucleotide 947 of the HIP14 mRNA (Accession No. AB024494) and is approximately 100 nucleotides from the start site of transcription. This sequence has been determined to be unique to the human, rat, and mouse HIP14 mRNA by blast search. Treating cells with HIP14 (947) siRNA resulted in greater than 70% reduction of both mRNA (Figure 2) and protein (data not shown). To measure protein reduction by siRNA treatment, NIH 3t3 cell overexpressing a V5-6His-tagged HIP14 protein (described below) were used and Western blots were performed using an anti-V5-HRP antibody. The HIP14 (947) siRNA had no effect on off-target proteins such as actin in any of the cells used in this study.
Figure 2.

HIP14 siRNA affects in vitro palmitoylation of the FarnCNRas(NBD) peptide and subcellular localization of H-RAS-GFP. In vitro palmitoylation assays performed on membrane fractions from the indicated cell lines. Each bar represents three independent experiments and the error bars are the standard deviation. RT–PCR was performed using 1 μg of total RNA isolated from the indicated cell lines and primers that recognize both human and murine HIP3
To determine the effects of HIP14 knockdown on cellular PAT activity, EJ-RAS cells were transfected with either HIP14 (947) siRNA or negative control siRNA. Membrane fractions and total RNA were isolated 48-h post-transfection. The membrane fractions were assayed for PAT activity using the in vitro palmitoylation assay and the RNA was used to determine the HIP14 message level by RT–PCR. Figure 2 shows that treating the cells with the negative control siRNA had no effect on message level or activity towards either substrate in the in vitro palmitoylation assay. In contrast, treating the cells with HIP14 (947) siRNA reduced the message to near wild-type levels as well as reduced the PAT activity towards the FarnCNRas(NBD) peptide by 86%. However, treating the cells with HIP14 (947) siRNA had no effect on in vitro palmitoylation of the MyrGCK(NBD) peptide. These results clearly indicate that RNAi directed towards HIP14 can affect specific PAT activities in the in vitro palmitoylation assay, and suggests that HIP14 is a PAT with a preference for the farnesylated-palmitoylation motif. It should be noted that these results do not rule out the possibility that HIP14 has a higher affinity to or greater specificity for some as yet unknown recognition motif. Interestingly, these results also indicate that there is more than one PAT enzyme in these cells.
Characterization of HIP14 overexpression
In order to demonstrate that HIP14 has PAT activity, HIP14 cDNA was cloned into multiple expression vectors. We attempted to isolate activity from E. coli, and S. cerevisiae with no success. As HIP14 is an integral membrane protein, it was not surprising that it was not possible to isolate it from these organisms. As an alternative, the HIP14 cDNA was cloned into the pcDNA3 vector (Invitrogen) and transfected into wild-type NIH 3t3 cells. This vector provides V5- and 6His-epitopes fused to the C-terminus of the cloned protein. Stable clones were established by selection with G418. HIP14 expression levels were quantified by Western blot analysis with anti-V5-HRP antibodies (Invitrogen). The clone with the highest level of HIP14 expression was designated 3t3-3 and cultured in selective media for further analysis. Membrane fractions isolated from the 3t3-3 cells were assayed for PAT activity using the in vitro palmitoylation assay described above. In this assay, a 10-fold increase in PAT activity towards the FarnCNRas(NBD) peptide was observed; however, there was no change in activity towards the MyrGCK(NBD) peptide (Figure 3a). These data provide strong evidence that HIP14 is a PAT with a preference for the farnesylated-palmitoylation motif found in mammalian cellular proteins such as H-RAS.
Figure 3.

HIP14 overexpression increases PAT activity but HIP14 containing an active site mutation does not. (a) In vitro palmitoylation assays were conducted with membrane fractions isolated from wt NIH 3t3 cells, or NIH 3t3 cells overexpressing either HIP14 (3t3-3), HIP14 with an active site mutation (3t3-DHHS), or EJ-RAS. Each bar represents three independent experiments and the error bars are the standard deviation. (b) HIP14 labeling with 14C-palmitoyl-CoA. Labeling reactions were identical to the IVP reactions with the exception of 14C-palmitoyl-CoA replacing cold palmitoyl-CoA. Radiolabeled HIP14 was resolved by SDS–PAGE and visualized by fluorography followed by exposure to film
Studies using the yeast PAT, ERF2, have shown that the enzyme forms an acyl-enzyme intermediate prior to transferring the palmitate moiety to the target protein (Lobo et al., 2002). These authors have also demonstrated that the cysteine residue of the DHHC-CRD domain is required for enzymatic activity and for the formation of the acyl-enzyme intermediate of ERF2. Furthermore, formation of this intermediate is dependent on the native conformation of the protein (Lobo et al., 2002). These data suggest that the cysteine residue is thioesterified by the palmitate moiety of palmitoyl-CoA, followed by transfer of the lipid to the peptide substrate. To determine if HIP14 also forms this intermediate, in vitro palmitoylation assays were performed in the presence of 14C-palmitoyl-CoA (Figure 3b). HIP14 in membranes from EJ-RAS and 3t3-3 cells readily incorporated 14C-palmitate, whereas labeling of HIP14 from wild-type 3t3 cell membranes was very low. Furthermore, the appearance of this labeled product was sensitive to heat inactivation, indicating that formation of this intermediate requires HIP14 to be in its native conformation.
HIP14 active site mutation
To determine if the cysteine residue of the DHHC-CRD domain of HIP14 was required for both enzymatic activity and formation of the acyl-enzyme intermediate, cysteine 468 of the DHHC motif was mutated to a serine residue, effectively replacing the sulfohydryl (SH) side chain with a hydroxyl (OH) but otherwise maintaining the physical properties of the residue. This C468S mutant was made by site-directed mutagenesis and stable cell lines were generated as described above for the wild-type HIP14-expressing 3t3 lines. These cells were designated 3t3-DHHS. In vitro palmitoylation assays using membrane fractions from the 3t3-DHHS cells show only background PAT activity towards the FarnCNRas(NBD) peptide (Figure 3a). The mutation of the DHHC-CRD domain also abolished the formation of the acyl-enzyme intermediate (Figure 3b). The decreased PAT activity was not due to lower expression of the DHHS-mutant as Western blot analyses of both whole-cell extracts and membrane fractions from the wild-type HIP14- and DHHS-mutant-expressing cell lines showed that the mutant protein was actually expressed to a higher level than the wild-type protein (data not shown). These results clearly indicate that HIP14 is a bona fide human PAT with many of the characteristics of its yeast homologues.
HIP14-mediated cellular transformation
Along with the increase in PAT activity, HIP14 overexpression in NIH 3t3 fibroblasts caused unsuspected cellular changes. The 3t3-3 clones with the highest levels of HIP14 expression rapidly formed foci on tissue culture plates, whereas the 3t3-DHHS and the wild-type 3t3 cells grew as monolayers (Table 1). Furthermore, the 3t3-3 cells continued to proliferate well after reaching saturation density, suggesting an escape from contact inhibition. Again, the 3t3-DHHS and wild-type 3t3 cells stopped proliferating at saturation (Table 1). In conjunction with the loss of contact inhibition, overexpression of HIP14 also conveyed anchorage-independent growth to the 3t3-3 cells. The 3t3-3 cells showed a 150-fold increase in colony formation in soft agar and a dramatic increase in colony size as compared with wild-type cells (Table 1). Interestingly, the 3t3-DHHS cells were able to form a few large colonies in soft agar but they were 10-fold less abundant than the 3t3-3 cells.
Table 1.
HIP14 transforming activities and tumorigenicity in transfected NIH 3t3 cells
| Cell line | Foci formation |
Colonies in soft agar |
Tumorigenicity Tumors per injection |
||||
|---|---|---|---|---|---|---|---|
| 14 days |
21 days |
Number | Size (mm) | ||||
| Foci | Cell number | Foci | Cell number | ||||
| 3t3-3 | 374±25.5 | 45.0×10⁶ | TNTCa | 59±8.02×10⁶ | 154±6.7 | 0.1–0.5 | 7/7 |
| 3t3-DHHS | 0 | 6.33×10⁶ | — | — | 18.7±4.1 | 0.1–0.5 | — |
| 3t3-β-Gal | 0 | 7.38×10⁶ | — | — | 0.33±0.33 | <0.1 | — |
| wt NIH 3t3 | 0 | 9.81×10⁶ | 1.3±.09 | 10±2.20×10⁶ | 2.6±1.6 | <0.1 | 0/3 |
TNTC=too numerous to count
Another classic test of cellular transformation is the dependence of the cells on serum in the media for growth. In this assay, the various cellular constructs were grown in serum-free media, media containing 1% serum, or media containing the normal 10% serum and the growth rates were determined (Table 2). All of the cell types proliferated at the same rate in media containing 10% serum. However, growth rate of the 3t3-3 cells was significantly higher than those of the 3t3-DHHS and the control cells in 1% serum containing media. Finally, only the 3t3-3 cells were able to proliferate in the absence of serum. It is intriguing to speculate that this growth is mediated by a shift in the equilibrium of RAS palmitoylation, resulting in the inability of RAS to cycle out of the peripheral membrane.
Table 2.
Growth rates in media containing 0, 1, and 10% serum
| Cell line | Doubling time (days) |
||
|---|---|---|---|
| No serum | 1% serum | 10% serum | |
| 3t3-3 | 1.23 | 1.23 | 1.08 |
| 3t3-DHHS | Dying | 1.42 | 1.18 |
| 3t3-β-Gal | Dying | 1.45 | 1.22 |
| wt NIH 3t3 | Dying | 1.49 | 1.17 |
To confirm that the transformation phenotype was not due to a transfection artefact, a control-vector expressing β-galactosidase (3t3-β-Gal) was transfected into NIH 3t3 cells. Both the HIP14 and the β-Gal expression vectors showed a similar efficiency in the generation of G418-resistant colonies. However, the 3t3-β-Gal cells did not form foci, grow in the absence of serum (Table 2), form colonies in soft agar nor did they proliferate beyond saturation density (Table 1).
HIP14 is tumorigenic
Since the 3t3-3 cells exhibited morphological properties consistent with transformation, the tumorigenicity of these cells was evaluated in mice. Subcutaneous injection of 1 × 10⁶ 3t3-3 cells into NOD/SCID mice rapidly developed tumors in all mice (Table 1). No mice injected with control cells developed tumors. At 28 days postinjection, the tumors were measured and six of the seven animals were divided into two groups. Group 1 was administered 30 μM negative control siRNA with one-site intratumoral injections on days 1, 4, 7, and 10 (Figure 4). Group 2 was treated on the same schedule with 30 μM HIP14 (947) siRNA. In the HIP14 (947) siRNA-treated mice, a 20% reduction in tumor volume occurred during the first seven days. Over 11 days, the HIP14 (947) siRNA-treated tumors showed only a slight increase in size, whereas the controls increased by 400% during the same period (Figure 4). This experiment demonstrates that the growth of these tumors is driven by HIP14. More importantly, it highlights the potential efficacy of small molecule inhibitors of HIP14 as an anticancer therapy.
Figure 4.
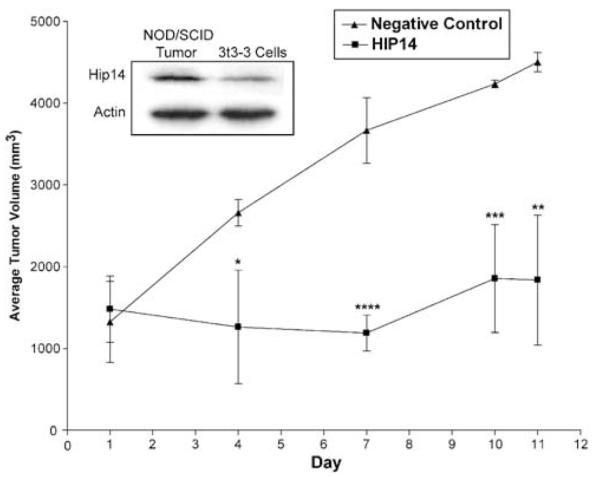
Intratumoral injections of HIP3 siRNA. Tumors were established in female NOD/SCID mice by subcutaneous injections in the right flank with 1 × 10⁶ 3t3-3 cells. At 28 days postinjection, the tumors were measured and the animals were split into two groups with roughly equal tumor volumes. HIP14 or negative control siRNAs (30 μM) were injected intratumorally on days 1, 4, 7, and 10, at which time tumor volumes were measured. A statistical comparison of the two groups at days 4, 7, 10, and 11 showed significant differences for all four points, with the following P-values; *P>0.0273, ****P>0.0007, ***P>0.0034, **P>0.0045 as determined by unpaired t-tests. Inset is a Western blot analysis of tumor tissue and 3t3-3 cells
The remaining animal from the tumor study was killed at 28 days postinjection and the tumor was excised. The inset of Figure 4 shows a Western blot analysis comparing the HIP14 protein levels in this tumor to the cultured 3t3-3 cells used for the injections. An anti-V5-HRP antibody, which can only detect the tagged version of the protein, was used for the blot. These data show that the tumors have higher HIP14 levels than the cultured cells, suggesting that the tumor is enriched in 3t3-3 cells that strongly express the gene or that expression of HIP14 is further upregulated in the tumor environment.
The data generated in this study, together with information previously published, demonstrate that HIP14 is a human palmitoyltransferase with specificity for peptide substrates containing the farnesylated-palmitoylation motif found in cellular proteins such as H-RAS. Furthermore, HIP14 does not modify the N-terminal myristoylated-palmitoylation motif indicating that there are additional PATs expressed in human cells. This is consistent with our previous biochemical characterization of PAT activity in mouse and human tumor cells (Varner et al., 2002, 2003). It will be interesting to determine if alterations in HIP14 affect subcellular localization of the endogenous RAS protein. It will also be important to determine if HIP14 has other substrates that could be contributing to the transformation phenotype observed in this study.
The data presented here also demonstrates, for the first time, that HIP14 can act as an oncogene. Most importantly, its overexpression causes very aggressively growing tumors in mice. With the tools and insight provided in this study, we can now begin to investigate the involvement of HIP14 and protein palmitoylation in cellular transformation and tumor formation. We can also determine if HIP14 is upregulated in various cancer types and whether it plays a role in those tumors. It is exciting to speculate that in RAS-driven diseases, HIP14 will be upregulated and involved in the etiology of those malignancies.
Materials and methods
Constructs
siRNA constructs
Oligonucleotide templates for the generation of siRNAs used in this study were designed using the Ambion siRNA Target Finder at http://www.ambion.com. The siRNAs were generated using the Silencer siRNA construction kit (Ambion, Cat. No. 1620). The HIP14 (947) siRNA with sequence 5′-AATAACAGAATAGATTTAGTC-3′ was determined to be the most effective. Negative control siRNA templates were obtained from Ambion (Negative Control #1 siRNA Templates – Cat. No. 4610) and used to generate negative control siRNA. Negative control siRNA was used at an equal concentration to HIP14 siRNA in all experiments.
HIP14 expression constructs
IMAGE clone No. 5266097 which contains the cDNA for HIP14 was obtained from Invitrogen. Primers were designed to clone the entire sequence into the pENTR-SD/D-TOPO vector (Invitrogen). This construct was altered by PCR-mediated mutagenesis using primers dhhs_5′_Mut, 3′-GCAAAATTTGATCATCATTCCCCATGGGTGGGTAACTG-5′, and dhhs_3′_Mut, 3′-CAGTTACCCACCCATGGGGAATGATGATCAAATTTT GC-5′ to create the DHHS active site mutant expression construct. These two entry vector clones were sequence verified, and the constructs were used to generate expression vectors for bacteria (pET-DEST42 Gateway vector), yeast (pYES-DEST52 Gateway vector), and mammalian (pcDNA-DEST40 Gateway vector) systems. The β-Gal expression construct was provided as a control with the pcDNA-DEST40 Gateway vector. Details about the TOPO cloning and expression system can be found at www.invitrogen.com.
Cell culture
NIH 3t3 cells (ATCC – CRL-1658) were maintained in DMEM containing 10% calf serum, 50 μg/ml gentamycin, and 1 mM sodium pyruvate at 371C in an atmosphere of 5% CO2 and 95% air. DMEM culture medium, calf serum, gentamycin, and sodium pyruvate are from GibcoBRL.
Membrane fractionation
The subcellular fractions were prepared as described in Varner et al. (2002). Briefly, cells were grown to 70% confluence in 150mm tissue culture dishes and collected by centrifugation. The cells were swollen with hypotonic lysis buffer containing 10mM HEPES (pH 7.4), 10mM KCl, 1.5 mM MgCl2, and 5 μM phenylmethylsulfonyl fluoride (PMSF) for 30min on ice. The cells were disrupted by homogenization and centrifuged at 5600 g for 10min at 4°C to remove nuclei and debris. The supernatant from the low-speed centrifugation was then centrifuged at 100 000 g for 1 h at 4°C. The resulting pellet from this ultracentrifugation was resuspended in lysis buffer and collected as the membrane fraction for use in the in vitro palmitoylation (IVP) assays.
IVP assay
The IVP assay was performed as described in Varner et al. (2002, 2003). Briefly, IVP assays with the MyrGCK(NBD) ((myr)GCK-NBD) substrate consisted of 10 μM deprotected peptide, 2 μM palmitoyl-CoA, 50 μg membrane protein, and acylation buffer (50mM citrate, 50mM phosphate, 50mM Tris, and 50mM CAPS at pH 7.2) in a total volume of 100 μl. IVP assays with the FarnCNRas(NBD) (NBD-GCMGLPC(farn)-Ome) peptide consisted of the same IVP assay mixture as above except with optimized concentrations of 20 μM peptide and 4 μM palmitoyl-CoA. The IVP assays were initiated by incubating the peptide substrate with membrane fractions from the indicated cell lines in acylation buffer for 8 min at 37°C with agitation. Palmitoyl-CoA was added to start the reaction and incubation was continued at 37°C for an additional 7.5 min. The assay was stopped by the addition of 1.2 ml of CH2Cl2 : methanol : water (2 : 1 : 1), which also extracts the peptide into the organic phase. The aqueous phase was extracted three times and the organic phase combined, dried under N2, and stored at −20°C until analysed by high-performance liquid chromatography (HPLC) as described in Varner et al. (2002, 2003).
Transfection
Transfection of the NIH 3t3 cells with siRNA was carried out as follows: cells were passaged from the stock cultures described above to six-well culture plates or 10cm culture dishes containing DMEM and 10% calf serum. An appropriate number of cells were plated so that they were at approximately 50% confluent the next day. Transfection of the siRNA constructs into the NIH 3t3 cells was carried out in DMEM with 10% calf serum (without antibiotic) in the presence of 5 μg/ml Lipofectamine 2000 (Invitrogen), for 4 h, at 37°C in an atmosphere of 5% CO2 and 95% air. Following the 4 h incubation, the media was replaced with DMEM plus 10% calf serum and the cells were incubated for 24–72 h. Following the incubation, the cells were scraped from the dishes, washed twice in PBS and the cell pellets were either used to prepare membrane fractions or to isolate total RNA.
Reverse transcription assay
Total RNA was isolated from the indicated cell lines using the Rneasy RNA isolation kit (QIAGEN, Cat. No. 74104). Total RNA (1 μg) was used in each RT–PCR reaction using the onestep RT–PCR kit (QIAGEN, Cat. No. 210210). HIP14 mRNA was amplified using primers that span the intron between exons 21 and 22. The 5′ primer is 5′-GAA TGA ATG CCA GGA GAT ACA AGC-3′ and the 3′ primer is 5′-GGC AGT GTG TTC TGT CCA TG-3. The 390-bp product was resolved on a 2% agarose gel and visualized by staining with ethidium bromide.
Serum-dependent growth
Stably transfected HIP14 (3t3-3) cells or wt NIH 3t3 cells were plated in 12-well plates (10 000 cells/well) in DMEM containing 10% calf serum. After 4 h, the media was changed to DMEM containing no calf serum, 1 or 10% calf serum. At 24-h intervals, the cells from each condition were collected and counted in a hemocytometer.
Growth in soft agar
Suspensions of 50 000 cells of stably transfected HIP14 (3t3-3) or wt NIH 3t3 cells in DMEM containing 0.33% agar were overlaid in six-well plates containing 0.6% agar gels. Cells were fed every 3 days and after 21 days, colonies were stained with 0.1% MTT and scored.
Foci-formation assay
Stably transfected HIP14 (3t3-3) cells or wt NIH 3t3 cells were plated in 10cm plates in DMEM containing 10% calf serum. After reaching confluence, the cells were cultured for 14–21 days in DMEM containing 5% calf serum. The foci were scored after staining with sulforhodamine B. For the 14-day experiment, one plate was counted in a hemocytometer and five were scored for foci. For the 21-day experiment, three plates were counted in a hemocytometer and three were scored for foci.
Tumorigenicity
Seven female NOD/SCID mice, 3–4 weeks old, were injected subcutaneous in the right hind flank with 1 × 10⁶ stably transfected HIP14-expressing (3t3-3) cells suspended in 200 μl PBS and three were injected with 1 × 10⁶ wild-type NIH 3t3 cells. Animals were examined twice per week. Tumors appeared between weeks two and three.
RNAi tumor study
The tumors of the seven Female NOD/SCID mice described in the tumorigenicity study above were measured and the animals were divided into two groups. Tumor volumes were determined using caliper by measuring the length (L) and width (W) of the tumor. Tumor volume was calculated using the formula: (L × W2)/2, n = 3/group. Treatment consisted of one-site intratumoral injections of 50 μl of negative control, or HIP14 (947) siRNA, respectively, at a concentration of 30 μM on days 1, 4, 7, and 10. On day 11, the animals were euthanized and tumors were excised and weighed. The siRNAs were reconstituted in nuclease-free water containing 0.1 mg/ml Lipofectamine 2000 (Invitrogen). Tumor measurements were performed on days 1, 4, 7, 10, and 11. Ps were determined by unpaired t-tests using GraphPad InStat (San Diego, CA, USA). There were no gross changes in the weights of any of the mice in the study.
Acknowledgements
We thank Dwayne Dexter for assistance in obtaining the HIP14 clone. We are also grateful to Lynn Maines for his assistance in the preparation of the manuscript. This work was supported by NIH Grant No. R01 CA75248 to CDS.
References
- Alland L, Peseckis SM, Atherton RE, Berthiaume L, Resh MD. J. Biol. Chem. 1994;269:16701–16705. [PubMed] [Google Scholar]
- Anderson RG. Annu. Rev. Biochem. 1998;67:199–225. doi: 10.1146/annurev.biochem.67.1.199. [DOI] [PubMed] [Google Scholar]
- Apolloni A, Prior IA, Lindsay M, Parton RG, Hancock JF. Mol. Cell. Biol. 2000;20:2475–2487. doi: 10.1128/mcb.20.7.2475-2487.2000. [DOI] [PMC free article] [PubMed] [Google Scholar]
- Bartels DJ, Mitchell DA, Dong X, Deschenes RJ. Mol. Cell. Biol. 1999;19:6775–6787. doi: 10.1128/mcb.19.10.6775. [DOI] [PMC free article] [PubMed] [Google Scholar]
- Booden MA, Baker TL, Solski PA, Der CJ, Punke SG, Buss JE. J. Biol. Chem. 1999;274:1423–1431. doi: 10.1074/jbc.274.3.1423. [DOI] [PubMed] [Google Scholar]
- Bouvier M, Loisel TP, Hebert T. Biochem. Soc. Trans. 1995;23:577–581. doi: 10.1042/bst0230577. [DOI] [PubMed] [Google Scholar]
- Camp LA, Hofmann SL. J. Biol. Chem. 1993;268:22566–22574. [PubMed] [Google Scholar]
- Camp LA, Verkruyse LA, Afendis SJ, Slaughter CA, Hofmann SL. J. Biol. Chem. 1994;269:23212–23219. [PubMed] [Google Scholar]
- Danesi R, Nardini D, Basolo F, Del Tacca M, Samid D, Myers CE. Mol. Pharmacol. 1996;49:972–979. [PubMed] [Google Scholar]
- Das AK, Dasgupta B, Bhattacharya R, Basu J. J. Biol. Chem. 1997;272:11021–11025. doi: 10.1074/jbc.272.17.11021. [DOI] [PubMed] [Google Scholar]
- Degtyarev MY, Spiegel AM, Jones TL. J. Biol. Chem. 1994;269:30898–30903. [PubMed] [Google Scholar]
- Downward J. Nat. Rev. Cancer. 2003;3:11–22. doi: 10.1038/nrc969. [DOI] [PubMed] [Google Scholar]
- Dunphy JT, Linder ME. Biochim. Biophys. Acta. 1998;1436:245–261. doi: 10.1016/s0005-2760(98)00130-1. [DOI] [PubMed] [Google Scholar]
- Eummer JT, Gibbs BS, Zahn TJ, Sebolt-Leopold JS, Gibbs RA. Bioorg. Med. Chem. 1999;7:241–250. doi: 10.1016/s0968-0896(98)00202-8. [DOI] [PubMed] [Google Scholar]
- Gorodinsky A, Harris DA. J. Cell. Biol. 1995;129:619–627. doi: 10.1083/jcb.129.3.619. [DOI] [PMC free article] [PubMed] [Google Scholar]
- Gutierrez L, Magee AI. Biochim. Biophys. Acta. 1991;1078:147–154. doi: 10.1016/0167-4838(91)99003-b. [DOI] [PubMed] [Google Scholar]
- Hancock JF, Magee AI, Childs JE, Marshall CJ. Cell. 1989;57:1167–1177. doi: 10.1016/0092-8674(89)90054-8. [DOI] [PubMed] [Google Scholar]
- Hiol A, Caron JM, Smith CD, Jones TLZ. Biochim. Biophys. Acta. 2003;1635:10–19. doi: 10.1016/j.bbalip.2003.10.001. [DOI] [PubMed] [Google Scholar]
- James GL, Goldstein JL, Brown MS, Rawson TE, Somers TC, McDowell RS, Crowley CW, Lucas BK, Levinson AD, Marsters JC., Jr Science. 1993;260:1937–1942. doi: 10.1126/science.8316834. [DOI] [PubMed] [Google Scholar]
- Leonard DM. J. Med. Chem. 1997;40:2971–2990. doi: 10.1021/jm970226l. [DOI] [PubMed] [Google Scholar]
- Liu L, Dudler T, Gelb MH. J. Biol. Chem. 1996;271:23269–23276. doi: 10.1074/jbc.271.38.23269. [DOI] [PubMed] [Google Scholar]
- Lobo S, Greentree WK, Linder ME, Deschenes RJ. J. Biol. Chem. 2002;277:41268–41273. doi: 10.1074/jbc.M206573200. [DOI] [PubMed] [Google Scholar]
- Morales J, Fishburn CS, Wilson PT, Bourne HR. Mol. Biol. Cell. 1998;9:1–14. doi: 10.1091/mbc.9.1.1. [DOI] [PMC free article] [PubMed] [Google Scholar]
- Putilina T, Wong P, Gentleman S. Mol. Cell. Biochem. 1999;195:219–226. doi: 10.1023/a:1006932522197. [DOI] [PubMed] [Google Scholar]
- Resh MD. Cell Signal. 1996;8:403–412. doi: 10.1016/s0898-6568(96)00088-5. [DOI] [PubMed] [Google Scholar]
- Resh MD. Biochim. Biophys. Acta. 1999;1451:1–16. doi: 10.1016/s0167-4889(99)00075-0. [DOI] [PubMed] [Google Scholar]
- Robbins SM, Quintrell NA, Bishop JM. Mol. Cell. Biol. 1995;15:3507–3515. doi: 10.1128/mcb.15.7.3507. [DOI] [PMC free article] [PubMed] [Google Scholar]
- Roth AF, Feng Y, Chen L, Davis NG. J. Cell. Biol. 2002;159:23–28. doi: 10.1083/jcb.200206120. [DOI] [PMC free article] [PubMed] [Google Scholar]
- Sausville EA, Elsayed Y, Monga M, Kim G. Annu. Rev. Pharmacol. Toxicol. 2003;43:199–231. doi: 10.1146/annurev.pharmtox.43.100901.135813. [DOI] [PubMed] [Google Scholar]
- Schroeder H, Leventis R, Rex S, Schelhaas M, Nagele E, Waldmann H, Silvius JR. Biochemistry. 1997;36:13102–13109. doi: 10.1021/bi9709497. [DOI] [PubMed] [Google Scholar]
- Shahinian S, Silvius JR. Biochemistry. 1995;34:3813–3822. doi: 10.1021/bi00011a039. [DOI] [PubMed] [Google Scholar]
- Shenoy-Scaria AM, Dietzen DJ, Kwong J, Link DC, Lublin DM. J. Cell. Biol. 1994;126:353–363. doi: 10.1083/jcb.126.2.353. [DOI] [PMC free article] [PubMed] [Google Scholar]
- Simons K, Ikonen E. Nature. 1997;387:569–572. doi: 10.1038/42408. [DOI] [PubMed] [Google Scholar]
- Singaraja RR, Hadano S, Metzler M, Givan S, Wellington CL, Warby S, Yanai A, Gutekunst CA, Leavitt BR, Yi H, Fichter K, Gan L, McCutcheon K, Chopra V, Michel J, Hersch SM, Ikeda JE, Hayden MR. Hum. Mol. Genet. 2002;11:2815–2828. doi: 10.1093/hmg/11.23.2815. [DOI] [PubMed] [Google Scholar]
- Smart EJ, Graf GA, McNiven MA, Sessa WC, Engelman JA, Scherer PE, Okamoto T, Lisanti MP. Mol. Cell. Biol. 1999;19:7289–7304. doi: 10.1128/mcb.19.11.7289. [DOI] [PMC free article] [PubMed] [Google Scholar]
- Ueno K, Suzuki Y. J. Biol. Chem. 1997;272:13519–13526. doi: 10.1074/jbc.272.21.13519. [DOI] [PubMed] [Google Scholar]
- Varner A, De Vos M, Creaser S, Peterson B, Smith C. Anal. Biochem. 2002;308:160. doi: 10.1016/s0003-2697(02)00212-9. [DOI] [PubMed] [Google Scholar]
- Varner AS, Ducker CE, Xia Z, Zhuang Y, DeVos ML, Smith CD. Biochem. J. 2003;373:91–99. doi: 10.1042/BJ20021598. [DOI] [PMC free article] [PubMed] [Google Scholar]
- Waddick KG, Uckun FM. Biochem. Pharmacol. 1998;56:1411–1426. doi: 10.1016/s0006-2952(98)00211-1. [DOI] [PubMed] [Google Scholar]