Abstract
Background
Following near-defibrillation threshold (DFT) shocks from an ICD, the first postshock activation that leads to defibrillation failure arises focally after an isolelectric window (IW). The mechanisms underlying the IW remain incompletely understood.
Objective
The goal of this study was to provide mechanistic insight into the origins of postshock activations and IW following ICD shocks, and to link shock outcome to the preshock state of the ventricles. We hypothesized that the non-uniform ICD field results in the formation of an intramural excitable area (tunnel) only in the LV free wall, through which both pre-existing and new shock-induced wavefronts propagate during the IW.
Methods
Simulations were conducted using a realistic 3-D model of defibrillation in the rabbit ventricles. Biphasic ICD shocks of varying strengths were delivered to 27 different fibrillatory states.
Results
Following near-DFT shocks, regardless of preshock state, the main postshock excitable area was always located within LV free wall, creating an intramural tunnel. Either preexisting fibrillatory or shock-induced wavefronts propagated during the IW (duration of up to 74ms) in this tunnel and emerged as breakthroughs on LV epicardium. Preshock activity within the LV played a significant role in shock outcome: large number of preshock filaments resulted in an IW associated with tunnel propagation of preexisting rather than shock-induced wavefronts. Furthermore, shocks were more likely to succeed if LV excitable area was smaller.
Conclusions
The LV intramural excitable area is the primary reason for near-DFT failure. Any intervention that decreases the extent of this area will improve the likelihood of defibrillation success.
Keywords: Ventricular Defibrillation, Bidomain Model, Postshock Activations, Internal Cardioverter Defibrillator, Excitable Area
1. Introduction
Defibrillation is the only effective means for terminating ventricular fibrillation (VF); however, high-energy discharges are known to cause acute injury, myocardial dysfunction, and even adverse physiological effects1. The mechanisms of defibrillation are not fully understood, and a complete characterization of the interaction between fibrillating cardiac tissue and electric shocks is still lacking.
An isoelectric window2, IW, a quiescent period prior to the first global postshock activation, has been documented following strong shocks. Electrical and optical mapping studies have demonstrated that following the delivery of shocks of strength near the defibrillation threshold (DFT) from an implantable cardioverter-defibrillator (ICD) device, the first global activation consistently arises focally on the left ventricle (LV) at the end of the IW3,4. Understanding the origins of the IW is thus of great importance for uncovering the mechanisms by which a defibrillation shock fails. Various hypotheses have been proposed for the existence of an IW, including virtual electrode-induced propagated graded response5, calcium (Ca) sinkholes6, and activations emanating from Purkinje fibers7; however, the mechanisms responsible for it remain inconclusive. Ascertaining these mechanisms is expected to shed light on possible strategies for lowering DFT.
A recent fibrillation induction study from our group has proposed a novel mechanism underlying IW origin termed “tunnel propagation” of a postshock activation (PA) through intramural excitable areas8. While these results have yielded insight regarding the propagation of PAs, they focused on arrhythmia induction with external uniform-field shocks, and thus were insufficient for providing comprehensive understanding of defibrillation failure following ICD shocks.
The goal of this study is to provide mechanistic insight into the origins of PA and IW following ICD shocks, and to link shock outcome to the preshock state of the ventricles. To achieve the goal of the study, we employed a realistic 3-D bidomain model of defibrillation in the rabbit ventricles. We hypothesized that the non-uniform field established by the ICD creates an intramural excitable area (tunnel) only in the LV free wall, through which both pre-existing and new shock-induced wavefronts propagate during the IW. Using a computational approach allowed us to examine events occurring throughout the 3-D volume of the ventricles and to focus on the ventricular structure of critical vulnerability to defibrillation failure, overcoming the inability of current experimental techniques to obtain insight into postshock behavior in the depth of the ventricular wall.
2 Methods
Methods details are in online Supplement. Briefly, we used experimentally-validated anatomically-accurate rabbit ventricular model with realistic geometry and fiber orientation, as described previously8,9. Representations of blood in cavities and the perfusing bath were also included. Electrical activity in the myocardium was computed using the bidomain equations. Membrane kinetics was represented by the Mahajan-Shiferaw rabbit ventricular model10; the experimentally-validated restitution properties of the latter enable simulation of fibrillatory activity. Fibrillation was induced as described in the Supplement. From each fibrillation episode, we selected different preshock states (i.e. timings of defibrillation shock delivery), separated by 50-ms intervals. A total of 27 preshock states were chosen randomly, presenting different distributions of transmembrane potential (Vm) in the 3D volume of the ventricles.
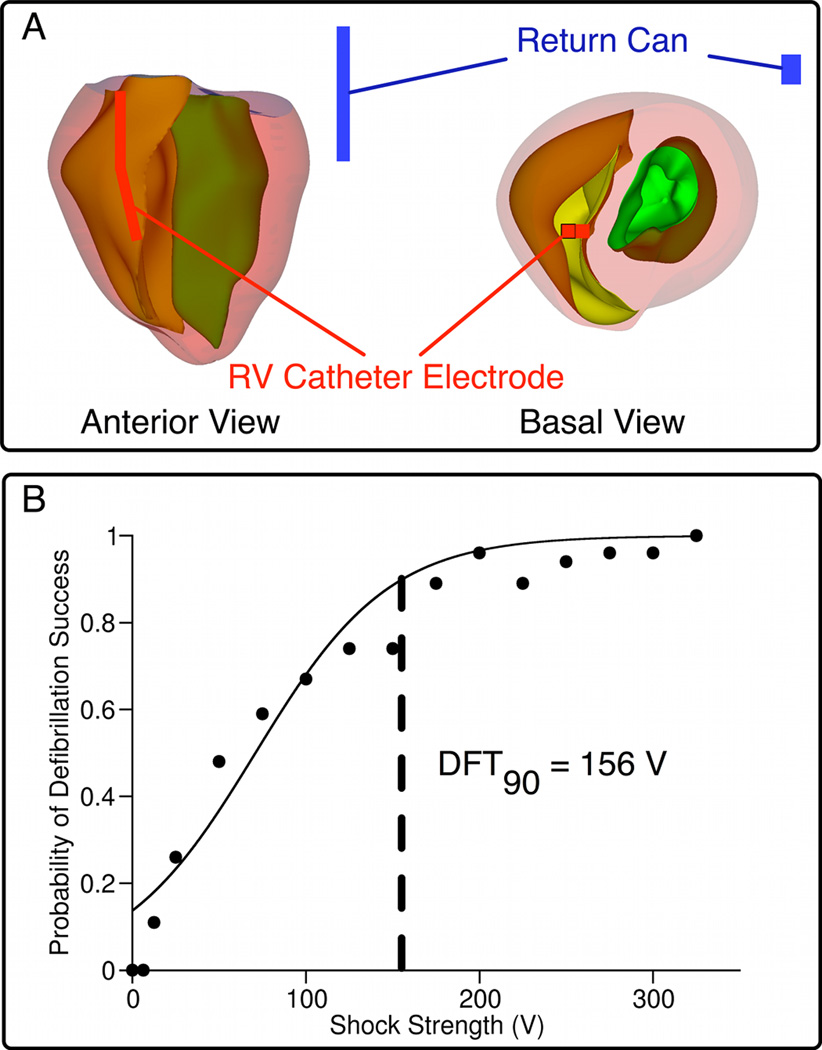
Biphasic shocks of strengths 12.5V–375V were delivered via ICD electrodes, a catheter in the right ventricle (RV) and an active can in the bath near the posterior LV (Fig.1A). The leads were scaled to a size appropriate for the rabbit ventricles. Shock strength (SS) referred to the leading edge voltage. During the first phase of the shock, RV catheter was the anode, while the active can was the cathode. The second phase polarity was reversed; its magnitude was 50% of the first. Tilt and duration of each phase were 50% and 3.5 ms, respectively.
Fig. 1. Model geometry and dose-response curve.
A, Rabbit ventricular geometry and ICD-like electrodes in anterior and basal views; RV catheter in red, active can in blue. B, Dose-response curve resulting from all defibrillation episodes.
Postshock arrhythmias were classified as “sustained” or “non-sustained” as described in the Supplement. The sigmoidal dose-response curve, representing the relationship between probability of successful defibrillation and SS, was constructed from the shock outcomes for the various preshock states (see online Supplement); the discrete curve was then fitted, from which DFT90, the SS with 90% probability of defibrillation success, was calculated. Tissue was considered “excitable” when Vm was more negative than −60mV, a value close to the threshold for sodium current inactivation.
As done previously8, we defined the “initiating PA” as the first PA present within the volume of the ventricles after shock-end, and the “earliest-propagated PA” as the earliest PA to appear on the epicardium following shock-end. The IW was defined as the time interval between shock-end and the time of breakthrough on the epicardium2.
A scroll-wave filament is the 3-D organizing center of reentry. We determined the number of filaments and their locations in the ventricles using a published methodology11.
Statistical significance was determined as p<0.05. The data are presented as mean±standard deviation.
3 Results
The dose-response curve constructed from all 254 defibrillation episodes, from which DFT90 was calculated as ~156V, is shown in Fig.1B. DFT90 correlated well with experimental values12. Although the corresponding energy level (0.84J) is lower than that used to defibrillate larger hearts, the energy requirement is comparable when it is scaled according to ventricular mass (16J)13. For all episodes, we examined postshock propagation and PA origins. The results demonstrate that the earliest-propagated PA was either a pre-existing fibrillatory wavefront or a new, shock-induced one. Of all 180 episodes, 45% of earliest-propagated PAs were preexisting, while 26.7% were shock-induced. In the remainder of cases, there were multiple earliest-propagated PAs of both origins. Although the relative incidences of shock-induced PAs increased with SS (y=0.3439x−1.461, R2=0.94), the relative incidences of pre-existing PAs did not correlate strongly with SS (y=−0.1391x+52.266, R2=0.43). For near-DFT shocks, the relative number of shock episodes associated with shock-induced PAs was approximately the same as those associated with pre-existing PAs (47 vs 41% SS=125V, 52 vs 47% SS=150V, 60 vs 40% SS=75V), demonstrating that near-DFT shocks were not always associated with termination of existing wavefronts and generation of new wavefronts by the shock.
3.1 Postshock Excitable Areas
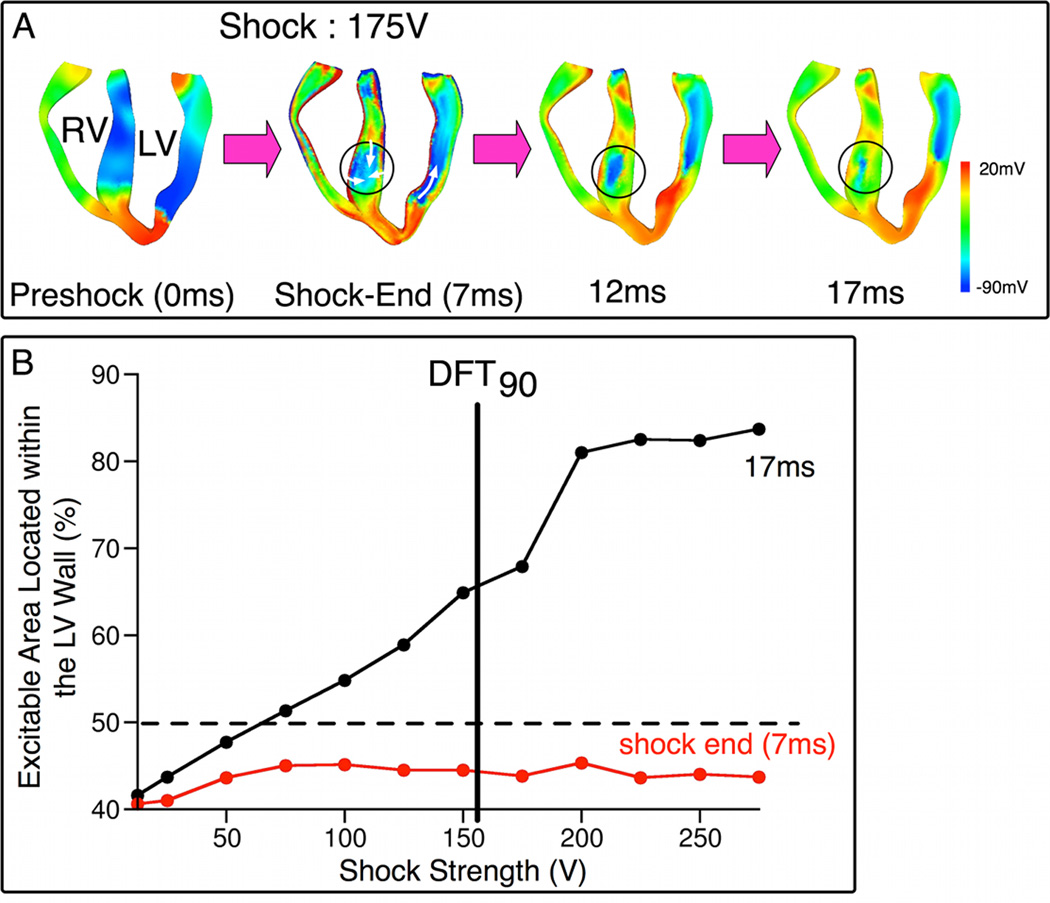
Following near-DFT90 ICD shocks, the main postshock excitable area was consistently located within the LV free wall, independent of preshock state. RV and septum, which were in immediate proximity to the RV catheter, did not present major postshock excitable avenues. As shown in Fig.2A, RV was directly depolarized by the shock. Break excitations were elicited within the septum, resulting in rapid eradication of the postshock excitable regions (black circles; 7, 12, 17ms). Fig.2B quantifies the amount of postshock excitable volume within LV wall as a function of SS at 7ms and 17ms postshock (onset of shock is time zero). For a given SS, the postshock LV excitable volume was measured for each preshock state; values were then averaged over all preshock states. For SS≥75V, by 17ms, more than half of the excitable tissue was located in the LV free wall. As SS increased, an increase in the amount of excitable tissue within the LV wall was observed only at 17ms, while the value measured at shock end remained nearly constant. For instance, following a 175-V shock (near-DFT90), 68% of the excitable tissue (1.2e4mm3) was located within the LV wall at 17ms, as opposed to 44% (7.4e3mm3) at shock-end. This redistribution manifests the reduction in the amount of RV and septal excitable tissue within this short postshock interval. These results demonstrate that the LV wall was the structure wherein the major postshock excitable region was located for near-DFT ICD shocks.
Fig. 2. Main postshock excitable area is in the LV wall.
A, Vm maps in apex-to-base cross-sections following 175-V shock. Time is counted from shock onset. Regions within circles are septal excitable areas. White arrows denote direction of propagation. B, Percentage of total excitable volume in the LV wall as a function of SS at shock-end (7ms, red) and 17ms postshock (black).
3.2 Relation between Amount of LV Excitable Tissue and Defibrillation Outcome
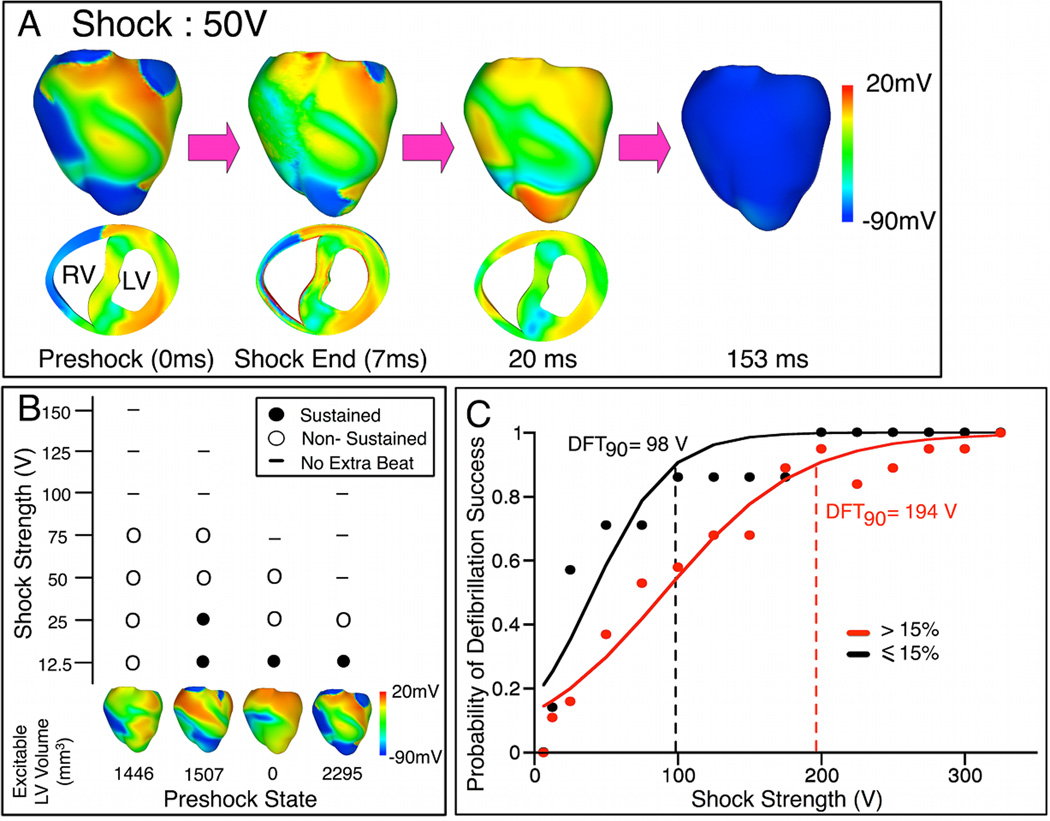
Our results demonstrate a strong relation between amounts of preshock and postshock excitable tissue in LV. 76%±25% of LV volume that was excitable at 17ms postshock (average value from all shock episodes) was also excitable prior to the shock, suggesting that the majority of postshock LV excitable regions resulted from preexisting excitable gaps in fibrillation. Thus, the amount of preshock LV excitable tissue affected defibrillation outcome. In Fig.3A, 50-V (32% DFT90) shock was applied at a preshock state where only 13% of LV wall was excitable. The shock further decreased the excitable area; 4% LV excitable tissue remained at shock-end. RV excitable area was eliminated within 20ms postshock. Because no avenue for postshock propagation existed in the ventricles, the shock successfully defibrillated.
Fig. 3. Extent of LV preshock excitable area affects shock outcome.
A, Vm maps following 50-V shock delivered when LV was mostly refractory. B, Shock outcome grid for four preshock states, each with <15% excitable tissue in LV wall. Shock outcome is denoted by symbols in the grid. C, Dose-response curves for episodes of shock delivery at preshock states with >15% (red) and ≤15% (black) excitable tissue in LV wall.
Of the 27 random preshock states, only 6 preshock states had <15% excitable tissue. In 4 of these preshock states, SSs as low as 50V (32% DFT90) or less terminated VF; these were considerably lower than the average SS needed to successfully defibrillate. A shock outcome grid (Fig.3B) summarizes the results for these four preshock states, each with <15% excitable tissue in the LV free wall.
To further demonstrate the role of the amount of LV preshock excitable tissue wall plays in defibrillation outcome, episodes were divided into two groups: shock delivery at preshock states with ≤15%, and at those with >15% excitable tissue in LV wall (the cut-off of 15% excitable tissue was chosen such that the probability of successful defibrillation in the two groups was significantly different). The corresponding dose-response curves are shown in Fig.3C; DFT90s were ~98V and ~194V, respectively. The results indicate that a stronger shock was required for successful defibrillation when there was a larger amount of excitable tissue in the LV wall prior to the shock. The larger LV excitable area allowed for postshock wavefronts to propagate unobstructed, increasing the likelihood of defibrillation failure.
3.3 Presence of IWs
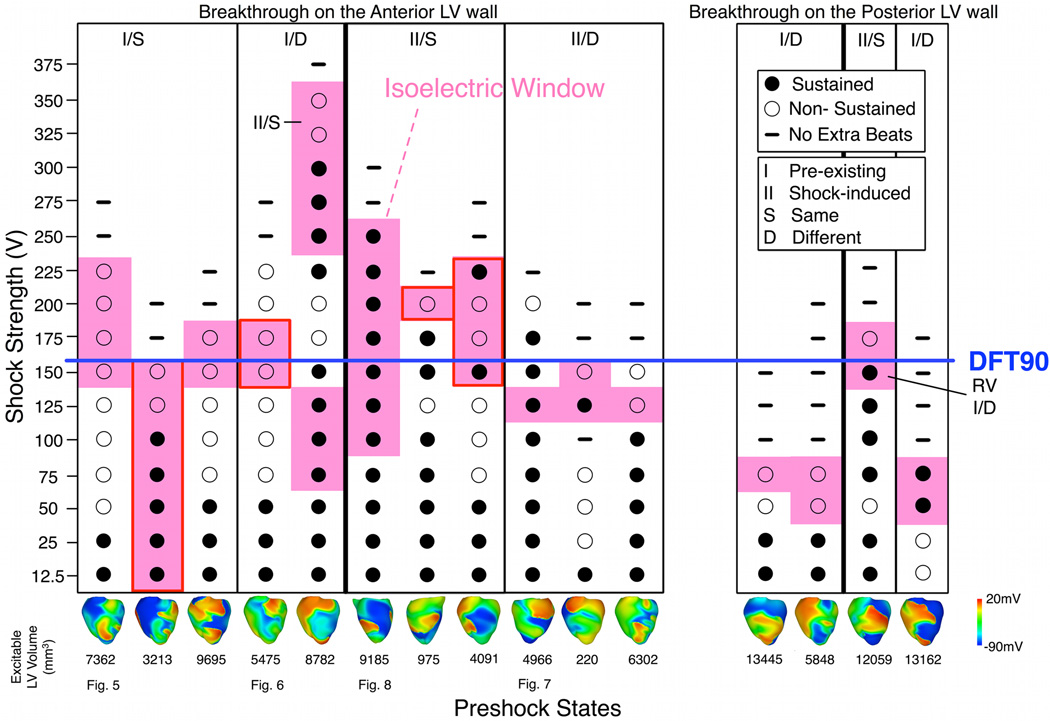
Of the 27 preshock states, IW was observed following defibrillation shocks to 15 of them. Fig.4 displays the shock outcome grid for these 15 cases (see Online Supplement for a figure depicting the remaining preshock states). Earliest-propagated PAs following the IW (pink) were observed mostly at near-DFT90 shocks, whereas episodes without IW, in which the earliest-propagated PA appeared on the epicardium immediately following the shock, occurred mostly at lower SS (≤100V, 122 of 135 episodes).
Fig. 4. Shock outcome grid.
Pink denotes fibrillation re-initiation episodes following IW. Images at bottom represent epicardial preshock Vm maps. Breakthroughs following IW are on LV anterior (left) and posterior (right) epicardium, with one exception on RV epicardium (marked by “RV”). Red boxes indicate breakthroughs near LV apex. Episodes with the same postshock behavior as a function of SS (S or D) and initiating PA origin (I or II, denoting pre-existing or shock-induced PA, respectively) are grouped into columns. Labels at bottom indicate figures in which the corresponding behavior is examined.
All breakthrough activations were observed on the LV epicardium, with one exception. In this particular case, the initiating PA originated in the thick RV basal portion. Of the 15 preshock states associated with IW, 11 resulted in breakthroughs on the LV anterior epicardium (left panel, Fig.4), and 4 on the LV posterior (right panel). The persistent breakthrough locations on the LV epicardium further indicated that the LV wall provided the propagation pathway for PAs.
3.4 Origins of the IW
At low SS, the earliest-propagated PA arose on the epicardium immediately following shock-end. Increasing SS altered the type of earliest-propagated PA from immediate epicardial activation to a delayed breakthrough at the end of IW. High SS caused the entire epicardium to become refractory and created a mid-myocardial excitable tunnel, through which a submerged initiating PA propagated during IW. This tunnel was consistently located within the LV wall following ICD shocks, and consequently, the initiating PAs exited the tunnel and broke onto the LV epicardium. After IW, the initiating PA became the earliest-propagated PA, often reinitiating fibrillation.
We classified the events surrounding PA initiation into two cases depending on behavior following SS increase. In the first case, the intramural wavefront propagating within the tunnel following near-DFT shocks was the same wavefront that served as the earliest-propagated PA appearing epicardially immediately after the lower-strength shock (behavior S). In the second case, the intramural wavefront in the tunnel following near-DFT shocks was different from the earliest-propagated PA following weak shocks (behavior D). Each of the behaviors (S or D) resulting in IW was observed independently of the initiating PA origin, which was either preexisting fibrillatory or shock-induced wavefront. Episodes with IWs resulting from PAs having different origins and different behaviors across SSs are categorized in the correspondingly-labeled columns in the outcome grid (Fig.4); the four types of episodes are illustrated in Figs.5–8.
Fig. 5. Behavior S with pre-existing initiating PA.
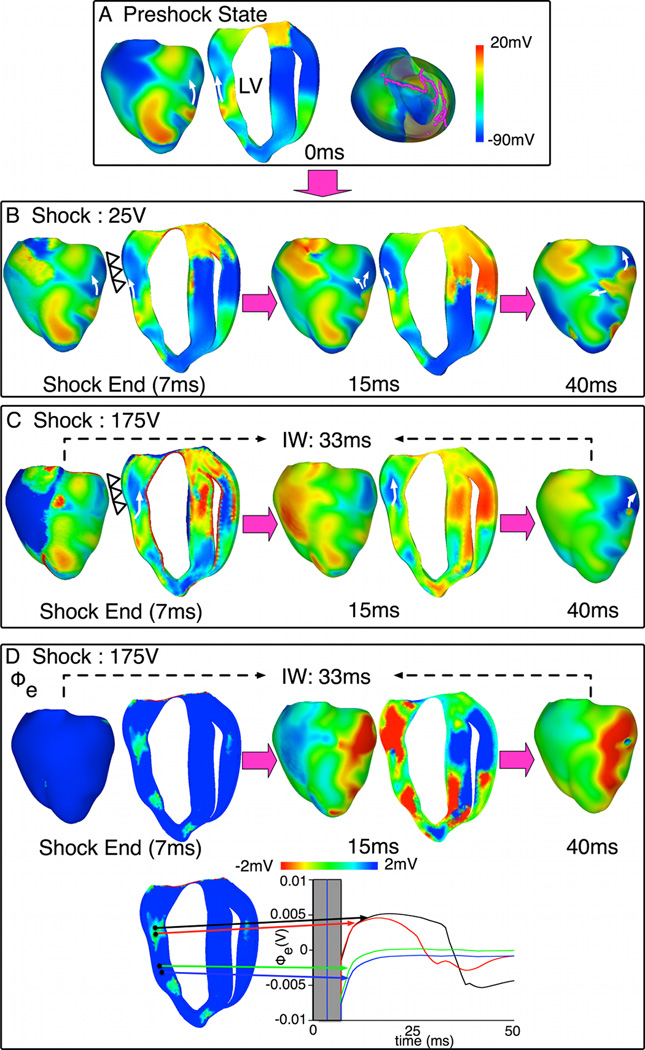
A. Preshock Vm maps with filaments in pink. B–C. Shock-induced response and propagation of Pas following 25-V and 175-V shocks. Open triangles mark LV epicardium that is refractory after the 175-V shock. White arrows denote propagation direction. Transmural apex-to-base maps are shown larger than epicardial maps to better show intramural propagation. D. Epicardial and transmural Φe maps (top) and Φe traces (bottom) within (black, red) and outside (green, blue) the tunnel following the 175-V shock.
Fig. 8. Behavior S with shock-induced initiating PA.
A. Preshock Vm maps. B–D. Shock-induced response and propagation of PAs following 75V, 100V and 175V shocks. Symbols as in Fig.5. E. Vm traces at the site marked with *. Gray rectangle denotes shock duration. Inset (bottom) emphasizes the incremental elevation of Vm with increases in SS within 13-ms interval following shock-end (interval outlined with dashed line).
In Fig.5, increase in SS from 25V to 175V (near-DFT90) caused a preexisting fibrillatory epicardial wavefront (arrow in preshock panel), whose continued propagation unaffected by the shock resulted in the 25-V shock failure, to become submerged (behavior S) and travel within the mid-myocardial tunnel following the 175-V shock. The tunnel formation and the submerging of the wavefront were due to the epicardium becoming refractory following this near-DFT90 shock (compare epicardial regions marked by open triangles in shock-end images). Tunnel propagation ended in a breakthrough on the LV anterior at 40ms postshock. The extracellular potential (Φe) maps for the 175-V shock are in Fig.5D, together with traces at locations inside and outside the tunnel.
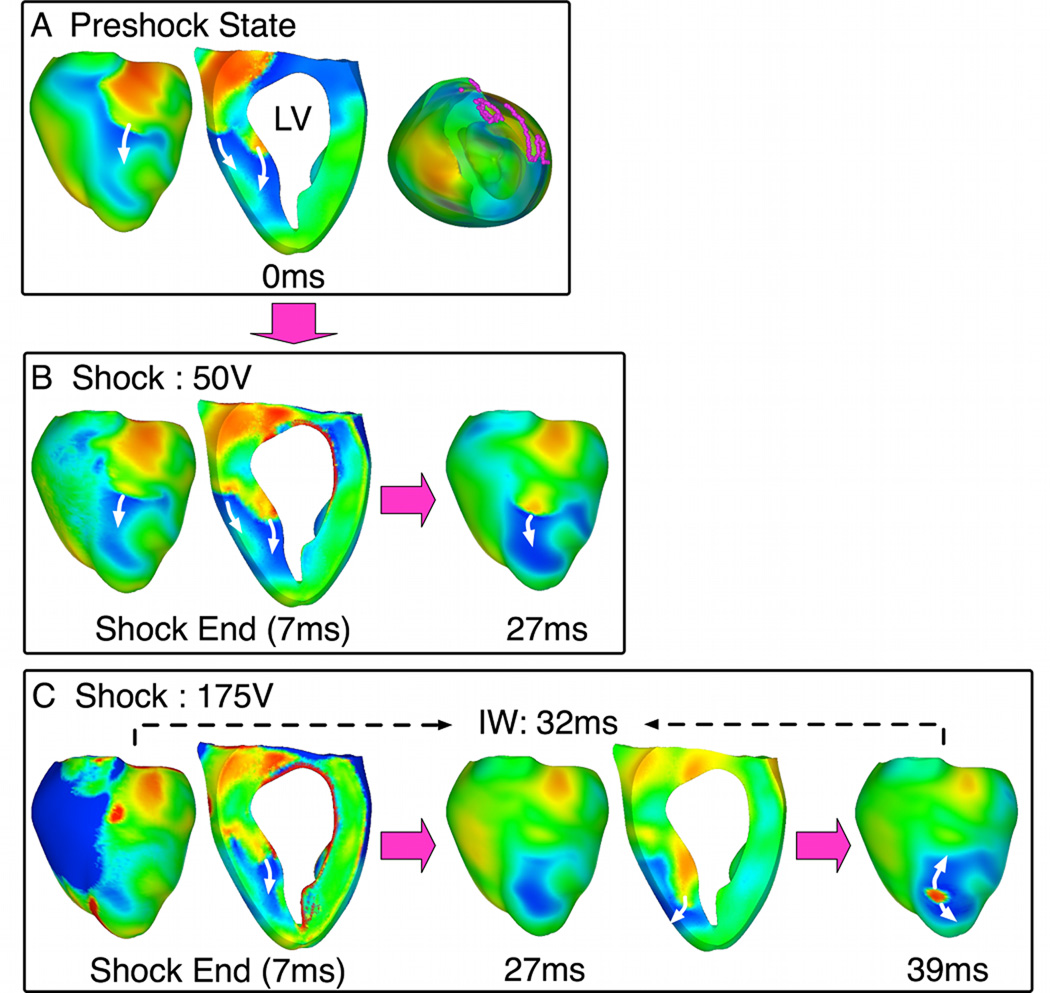
In Fig.6, the same SS increase resulted in elimination of the epicardial PA that caused the 50-V shock to fail (27ms panels). However, an intramural wavefront, which existed before the shock (intramural wavefront in preshock panel), underwent tunnel propagation (behavior D) and resulted in breakthrough following the 175-V shock. This PA emerged focally near LV apex at 39ms postshock.
Fig. 6. Behavior D with pre-existing initiating PA.
A. Preshock Vm maps with filaments in pink. B–C. Shock-induced response and propagation of Pas following 50-V and 175-V shocks. Symbols as in Fig.5.
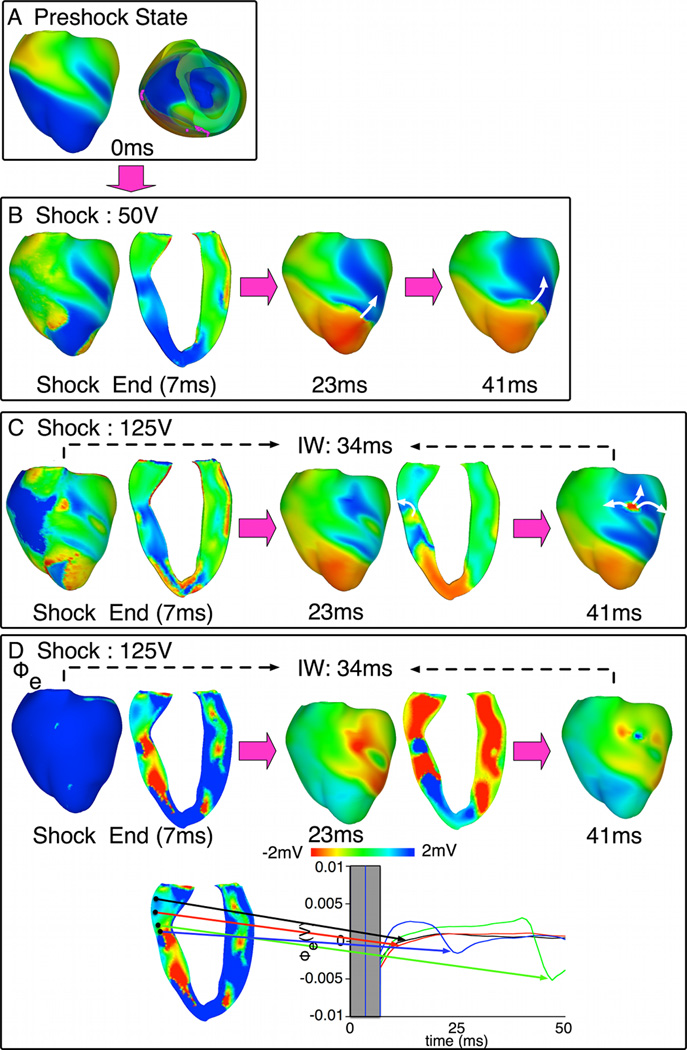
In Fig.7, behavior D is again shown, however the initiating PA is a new, shock-induced wavefront. Following the 50-V shock, the shock-induced activation propagated immediately on the epicardium (Fig.7B), causing the shock to fail. Following the 125-V shock (Fig.7C), however, a different, also shock-induced, wavefront propagated intramurally through the LV tunnel during IW, emerging on the LV epicardium at 41ms postshock.
Fig. 7. Behavior D with shock-induced initiating PA.
A. Preshock Vm maps. No preshock filaments existed within LV. B–C. Shock-induced response and propagation of PAs following 50-V and 125-V shocks. Symbols as in Fig.5. D. Epicardial and transmural Φe maps (top) and Φe traces (bottom) within (blue, green) and outside (black, red) the tunnel following a 125-V shock.
Fig.8 shows that SS increase caused the shock-induced epicardial wavefront, which resulted in the 75-V shock failure, to become submerged (behavior S) and propagate intramurally during IW (100 and 175-V shocks). IW duration was 42 and 57ms for these shocks, respectively.
In the two episodes above with tunnel propagation of pre-existing PAs, more than 3 filaments were located within the LV wall preshock (Figs.5A,6A; apical views). The number of preshock filaments was strongly linked to the initiating PA origin responsible for IW. More preshock filaments within the LV wall increased the likelihood of IW resulting from tunnel propagation of preexisting wavefronts. The average number of preshock filaments in the LV wall for the shock episodes with IW associated with pre-existing PAs vs. shock-induced PAs was 2.67±1.37 vs. 0.57±0.79, respectively.
3.5 SS and IW
IW duration increased with SS increase (Fig.8). IW prolongation was due to longer-lasting epicardial refractoriness induced by stronger shocks. As a result, tunnel propagation lasted longer and breakthrough was delayed. This is illustrated in Fig.8E, which displays Vm traces at the breakthrough location (asterisk). Vm elevation was observed with SS increase during the shock (time in gray), resulting in Vm elevation postshock and extended refractoriness (see inset). Note also that when SS increased from 75V to 100V, Vm was elevated by ~1.29mV at 10ms (arrow in inset). This minute increase was sufficient to lead to conduction block on the epicardium following the 100-V shock, but not the 75-V shock (Fig.8E) and to cause the wavefront to propagate intramurally.
4 Discussion
This study explored the electrical behavior in the ventricles following ICD defibrillation shocks by employing a state-of-the-art 3D bidomain model. While this experimentally-validated rabbit ventricular model has been used previously to study the effects of shocks8,9, novel model elements here include: implementation of complex (Markov model for Ca) rabbit ventricular kinetics10, implementation of ICD electrode configuration, and representation of fibrillation. The simulation approach allowed us to analyze PAs deep within the walls, and thus to identify which cardiac structure has elevated vulnerability to defibrillation failure and why, and to establish the mechanisms underlying PA and IW origins. The study also provided insight into the direct relationship between preshock state and postshock activity. The main findings are:
The non-uniform field created by ICD electrodes, combined with the fiber orientation and complex geometry of the ventricles, resulted in postshock excitable region located always in the LV wall, regardless of preshock state. For near-DFT shocks, this excitable region became an intramural tunnel through which PAs of different origins propagated. Breakthroughs (exit from the tunnel) thus always occurred on LV epicardium.
Probability of successful defibrillation was greater when shocks were delivered to preshock Vm distributions with a small volume of excitable tissue in the LV wall.
Failed defibrillation for near-DFT shocks was not always associated with termination of existing wavefronts and generation of new wavefronts by the shock.
The initiating PA origin depended on preshock filaments number in the LV free wall. Initiating PAs were more likely to be continuations of preexisting activity when the number of LV preshock filaments was large.
Epicardial wavefronts that caused the shock to fail at lower SS were sometimes eliminated by near-DFT90 shocks, which then allowed for a different PA to undergo tunnel propagation (behavior B). In other cases, the same epicardial wavefront (preexisting or shock-induced) become submerged in the tunnel (behavior A).
As SS increased, epicardial refractoriness was extended, sustaining tunnel propagation for a longer period postshock, and increasing IW.
4.1 LV Free Wall as Main Postshock Propagation Avenue
Because biphasic shocks elicited quick excitation and eliminated preshock excitable areas in RV and septum, the main excitable area was consistently located within the LV wall (Fig.2). This occurs because ICD electrodes generate weaker virtual electrode polarization (VEP) across the thick LV wall; wall thickness also correlated with weaker VEP following external shocks9. Ideker and co-workers have shown that the LV wall was frequently associated with shock failure14. Here we provide an explanation of this finding. Shocks render the LV epicardium refractory (surface polarization). LV mid-myocardium is less affected by the biphasic shocks because intramural VEP is of lower magnitude than surface polarization15. Therefore, preshock activity is often preserved in mid-myocardium. As SS increased, the LV excitable area played an increasingly important role in postshock propagation (Fig.2B). Following near-DFT shocks, the earliest PA propagated through the LV tunnel, emerging focally on the LV epicardium. This finding explains why focal activations following IW for biphasic near-DFT ICD shocks occurred persistently on the LV epicardium in experiments3,4. In these studies, breakthrough locations were found predominantly near the LV apex. However, we observed breakthroughs not only near the LV apex (episodes outlined in red in Fig.4) but also elsewhere on LV epicardium. This discrepancy between simulation and experimental results is likely due to the different animal models employed.
The finding of the formation of an intramural tunnel following strong shocks appears universal, at least in the context of our simulations, as demonstrated previously for shocks given to the paced ventricles8 and here, for shocks delivered in fibrillation. Tunnel formation is also independent of the timing at which the strong shock is given.
4.2 Dependence of Postshock Behavior on Preshock Activity
Anderson et al16 showed, in a 2D model of defibrillation, that an increase in preshock excitable area results in an increase in DFT. Hillebrenner et al17 demonstrated that shocks applied to reentrant activity of different complexity at the time of shock delivery led to differences in mid-myocardium refractoriness and recovery rate, and thus different postshock activity and shock outcome. Here we observed that postshock propagation within the LV mid-myocardium was strongly dependent on preshock state. When the preshock excitable area was located in the LV mid-wall, it typically transitioned into postshock excitable area. Indeed, new shock-induced excitable areas were not typically formed in the LV mid-wall since VEP was weak there, thus de-excitation was not likely following biphasic shocks18. Large amount of preshock excitable tissue within LV increased the likelihood of fibrillation re-initiation.
Importantly, this study demonstrates that preexisting activity may not be terminated by the strong shock but instead remains hidden in the intramural tunnel, in contrast to what was previously thought2. As shown here, over half of wavefronts propagating in the tunnel existed before the shock. It also explains why defibrillation shock timing affects the outcome of the shock.
4.3 PA Origin and Behavior
This study explained how initiating PAs become first postshock global activations following near-DFT ICD shocks, as well as the effect of SS on PA behavior. PAs, which were typically observed on the epicardium following weak shocks, were either submerged into the tunnel (behavior S) or eliminated (behavior D) following near-DFT90 shocks. All initiating PAs that were induced by the shock arose via VEP-induced propagated graded responses5.
In this study, initiating PAs were either preexisting or shock-induced. However, the concepts proposed here do not limit the origin of the initiating PAs; these might have alternative origins. Dosdall et al7 suggested that PAs could also originate from Purkinje. We speculate that such initiating PA could also propagate in the mid-myocardial tunnel following strong shocks; the tunnel will facilitate its exit on the epicardium. The tunnel hypothesis is independent of the origin of wavefronts that propagate through it.
Hwang and co-authors proposed6 that earliest-propagated PAs originate on the epicardium (following IW) from regions of low intracellular Ca (Cai) surrounded by regions of high Cai (Ca “sinkholes”); in the experiments, these Ca sinkholes were associated with Vm sinkholes. Our results are consistent with these findings. As shown here, a PA propagates in the tunnel until LV epicardium recovers regionally from refractoriness; in other words, until Vm sinkhole is formed on the epicardium. Hwang et al.6 proposed that the earliest-propagated PAs were driven by Ca activation preceding Vm. Indeed, Ca activation could be another mechanisms for initiating PA origin. Hwang et al suggested, however, that the earliest-propagated PAs are driven by Ca activation preceding Vm in the sinkhole, which would be inconsistent with behavior at the tunnel exit. To support the conjecture, the authors presented experiments with cryoablated hearts6, in which rise in Cai within the Ca sinkhole preceded the rise in Vm. However, experimental results show pre-fluorescence in only 5 of the 63 failed defibrillation episodes, and no pre-fluorescence in normal hearts. Thus, the presence of Vm and Ca sinkholes and the emanating activation from there could well represent PA exit from the tunnel, at least in some cases.
4.4 IW duration
IW duration differed among shocks of varying SS delivered at different preshock states, ranging from 20ms to 74ms (average 45±15ms). We observed a correlation between IW duration and SS such that when shocks of increasing strength were delivered to the same preshock state, increases in IW duration were documented (Fig.8C,D,E). This phenomenon was due to extended epicardial refractoriness created by stronger shocks. Our data show that an increase as small as 1.35mV in epicardial Vm can keep the submerged initiating PA in the tunnel for additional 5ms (Fig.8E; 100V and 125V shocks). Following longer IWs, initiating PAs made breakthrough on the surface when the ventricles had fully recovered, increasing the probability of successful defibrillation. For SS above DFT90, the spatial extent of epicardial refractoriness was large enough and long-lasting, such that the initiating PAs could not find an excitable exit onto the epicardium and died in mid-myocardium.
Plunge needle experiments have recorded shorter IWs than surface mapping3,7. In swine hearts, IW measured by plunge needles was 49.4±17.3ms, while endocardially-mapped IW was 74.8±16.67. Our results are consistent with these findings: if IW were to be recorded by plunge electrodes, it would have duration>0 but <IW on the epicardium. Even for pre-existing wavefronts, the intramural IW would be non-zero because it takes time for the tunnel to form. Subsequently, propagation in it is initially slow as a result of the midwall VEP. Indeed, as Fig 5C demonstrates, while the tunnel was fully formed by 7ms post-shock, the pre-existing wavefront had hardly advanced in it by 15ms postshock. After that, propagation in the tunnel remains slow and it takes another 25ms for the wavefront to make epicardial breakthrough. Finally, slow propagation in the tunnel results in small extracellular potentials. Plunge needle recordings use the algorithm of dV/dt≤−0.5V/s,3 thus initial propagation in the tunnel might remain undetected, extending IW recorded intramurally.
5 Limitations
The model lacks certain structural details such as laminar structure, microscale heterogeneities, and Purkinje network. Inclusion of microstructure might lead to the appearance of small-scale VEP19, which could possibly give rise to new PAs. However, they would still be shock-induced PAs and propagate in the tunnel following near-DFT shocks. We expect that inclusion of Purkinje fibers would also not alter our conclusions. Deo et al.20 found that VEP-induced activations in Purkinje affected the outcome for weak shocks only. For near-DFT shocks, any PAs that might arise from Purkinje would either not be able to “penetrate” the refractory endocardial layer (for endocardial junctions) or will find its way in the midwall (for deeper-penetrating Purkinje) and propagate in the tunnel as PA.
6 Conclusions and Implications
This study demonstrated that the presence of IW and subsequent failure of near-DFT ICD shocks is associated with the propagation of intramural wavefronts that always takes place within the LV wall of the rabbit heart. These wavefronts may or may not exist prior to the shock; they exit the tunnel at a recovered location on the LV epicardium, reinitiating fibrillation. Thus, this study concluded that the presence of LV intramural excitable area is the primary reason for defibrillation failure in the rabbit heart. Any pre- or postshock intervention that decreases the extent of this LV excitable area will improve the likelihood of defibrillation success. In larger hearts, the mechanisms described here might also take place in the RV, since its thickness is expected to be able to sustain tunnel propagation.
Supplementary Material
Acknowledgments
Sources of Funding
Supported by NIH grants R01-HL082729 and R01-HL067322 to NT.
Footnotes
Publisher's Disclaimer: This is a PDF file of an unedited manuscript that has been accepted for publication. As a service to our customers we are providing this early version of the manuscript. The manuscript will undergo copyediting, typesetting, and review of the resulting proof before it is published in its final citable form. Please note that during the production process errors may be discovered which could affect the content, and all legal disclaimers that apply to the journal pertain.
Disclosures
None.
References
- 1.Yamaguchi H, Weil M, Tang W, et al. Myocardial dysfunction after electrical defibrillation. Resuscitation. 2002;54(3):289–296. doi: 10.1016/s0300-9572(02)00149-1. [DOI] [PubMed] [Google Scholar]
- 2.Chen PS, Shibata N, Dixon EG, et al. Activation during ventricular defibrillation in open-chest dogs. Evidence of complete cessation and regeneration of ventricular fibrillation after unsuccessful shocks. J Clin Invest. 1986;77(3):810–823. doi: 10.1172/JCI112378. [DOI] [PMC free article] [PubMed] [Google Scholar]
- 3.Chattipakorn N, Fotuhi PC, Chattipakorn SC, Ideker RE. Three-dimensional mapping of earliest activation after near-threshold ventricular defibrillation shocks. J Cardiovasc Electrophysiol. 2003;14(1):65–69. doi: 10.1046/j.1540-8167.2003.02397.x. [DOI] [PubMed] [Google Scholar]
- 4.Chattipakorn N, Banville I, Gray RA, Ideker RE. Mechanism of ventricular defibrillation for near-defibrillation threshold shocks: a whole-heart optical mapping study in swine. Circulation. 2001;104(11):1313–1319. doi: 10.1161/hc3601.094295. [DOI] [PubMed] [Google Scholar]
- 5.Trayanova NA, Gray RA, Bourn DW, Eason JC. Virtual electrode-induced positive and negative graded responses: new insights into fibrillation induction and defibrillation. J Cardiovasc Electrophysiol. 2003;14(7):756–763. doi: 10.1046/j.1540-8167.2003.03042.x. [DOI] [PubMed] [Google Scholar]
- 6.Hwang GS, Hayashi H, Tang L, et al. Intracellular calcium and vulnerability to fibrillation and defibrillation in Langendorff-perfused rabbit ventricles. Circulation. 2006;114(24):2595–2603. doi: 10.1161/CIRCULATIONAHA.106.630509. [DOI] [PubMed] [Google Scholar]
- 7.Dosdall DJ, Cheng KA, Huang J, et al. Transmural and endocardial Purkinje activation in pigs before local myocardial activation after defibrillation shocks. Heart Rhythm. 2007;4(6):758–765. doi: 10.1016/j.hrthm.2007.02.017. [DOI] [PMC free article] [PubMed] [Google Scholar]
- 8.Ashihara T, Constantino J, Trayanova NA. Tunnel propagation of postshock activations as a hypothesis for fibrillation induction and isoelectric window. Circ Res. 2008;102(6):737–745. doi: 10.1161/CIRCRESAHA.107.168112. [DOI] [PMC free article] [PubMed] [Google Scholar]
- 9.Rodriguez B, Li L, Eason JC, Efimov IR, Trayanova NA. Differences between left and right ventricular chamber geometry affect cardiac vulnerability to electric shocks. Circ Res. 2005;97(2):168–175. doi: 10.1161/01.RES.0000174429.00987.17. [DOI] [PMC free article] [PubMed] [Google Scholar]
- 10.Mahajan A, Shiferaw Y, Sato D, et al. A rabbit ventricular action potential model replicating cardiac dynamics at rapid heart rates. Biophys J. 2008;94(2):392–410. doi: 10.1529/biophysj.106.98160. [DOI] [PMC free article] [PubMed] [Google Scholar]
- 11.Iyer AN, Gray RA. An experimentalist's approach to accurate localization of phase singularities during reentry. Ann Biomed Eng. 2001;29(1):47–59. doi: 10.1114/1.1335538. [DOI] [PubMed] [Google Scholar]
- 12.Matula MH, Brooks MJ, Pan Q, et al. Biphasic waveforms for ventricular defibrillation: optimization of total pulse and second phase durations. Pace. 1997;20(9 Pt 1):2154–2162. doi: 10.1111/j.1540-8159.1997.tb04231.x. [DOI] [PubMed] [Google Scholar]
- 13.Chapman PD, Sagar KB, Wetherbee JN, Troup PJ. Relationship of left ventricular mass to defibrillation threshold for the implantable defibrillator: a combined clinical and animal study. Am Heart J. 1987;114(2):274–278. doi: 10.1016/0002-8703(87)90490-x. [DOI] [PubMed] [Google Scholar]
- 14.Tang AS, Wolf PD, Afework Y, Smith WM, Ideker RE. Three-dimensional potential gradient fields generated by intracardiac catheter and cutaneous patch electrodes. Circulation. 1992;85(5):1857–1864. doi: 10.1161/01.cir.85.5.1857. [DOI] [PubMed] [Google Scholar]
- 15.Entcheva E, Trayanova NA, Claydon FJ. Patterns of and mechanisms for shock-induced polarization in the heart: a bidomain analysis. IEEE Trans Biomed Eng. 1999;46(3):260–270. doi: 10.1109/10.748979. [DOI] [PubMed] [Google Scholar]
- 16.Anderson C, Trayanova NA, Skouibine K. Termination of spiral waves with biphasic shocks: role of virtual electrode polarization. J Cardiovasc Electrophysiol. 2000;11(12):1386–1396. doi: 10.1046/j.1540-8167.2000.01386.x. [DOI] [PubMed] [Google Scholar]
- 17.Hillebrenner MG, Eason JC, Trayanova NA. Mechanistic inquiry into decrease in probability of defibrillation success with increase in complexity of preshock reentrant activity. Am J Physiol Heart Circ Physiol. 2004;286(3):H909–H917. doi: 10.1152/ajpheart.00492.2003. [DOI] [PubMed] [Google Scholar]
- 18.Efimov IR, Cheng Y, Van Wagoner DR, Mazgalev T, Tchou PJ. Virtual electrode-induced phase singularity: a basic mechanism of defibrillation failure. Circ Res. 1998;82(8):918–925. doi: 10.1161/01.res.82.8.918. [DOI] [PubMed] [Google Scholar]
- 19.Sharifov OF, Ideker RE, Fast VG. High-resolution optical mapping of intramural virtual electrodes in porcine left ventricular wall. Cardiovasc Res. 2004;64(3):448–456. doi: 10.1016/j.cardiores.2004.07.016. [DOI] [PubMed] [Google Scholar]
- 20.Deo M, Boyle P, Plank G, Vigmond E. Arrhythmogenic mechanisms of the Purkinje system during electric shocks: a modeling study. Heart Rhythm. 2009;6(12):1782–1789. doi: 10.1016/j.hrthm.2009.08.023. [DOI] [PMC free article] [PubMed] [Google Scholar]
Associated Data
This section collects any data citations, data availability statements, or supplementary materials included in this article.


