Abstract
Multiple sequence alignment (MSA) is the basis for a wide range of comparative sequence analyses from molecular phylogenetics to 3D structure prediction. Sophisticated algorithms have been developed for sequence alignment, but in practice, many errors can be expected and extensive portions of the MSA are unreliable. Hence, it is imperative to understand and characterize the various sources of errors in MSAs and to quantify site-specific alignment confidence. In this paper, we show that uncertainties in the guide tree used by progressive alignment methods are a major source of alignment uncertainty. We use this insight to develop a novel method for quantifying the robustness of each alignment column to guide tree uncertainty. We build on the widely used bootstrap method for perturbing the phylogenetic tree. Specifically, we generate a collection of trees and use each as a guide tree in the alignment algorithm, thus producing a set of MSAs. We next test the consistency of every column of the MSA obtained from the unperturbed guide tree with respect to the set of MSAs. We name this measure the “GUIDe tree based AligNment ConfidencE” (GUIDANCE) score. Using the Benchmark Alignment data BASE benchmark as well as simulation studies, we show that GUIDANCE scores accurately identify errors in MSAs. Additionally, we compare our results with the previously published Heads-or-Tails score and show that the GUIDANCE score is a better predictor of unreliably aligned regions.
Keywords: multiple sequence alignment, guide tree, phylogeny, bootstrap, alignment confidence
Introduction
Multiple sequence alignment (MSA) is a fundamental task in molecular biology. An MSA is a prerequisite for virtually all comparative sequence analyses, including phylogeny reconstruction, functional motif or domain characterization, sequence-based structural alignment, inference of positive selection, and profile-based homology searches. All such analyses take the MSA input for granted, regardless of uncertainties in the alignment. Because errors in upstream methodology tend to cascade downstream, alignment errors are an important concern in molecular data analysis.
In the last decade, considerable efforts have been made to improve alignment accuracy (e.g., Notredame et al. 2000; Edgar 2004; Katoh et al. 2005; Loytynoja and Goldman 2008). Nevertheless, benchmark studies show that obtaining accurate alignments remains a challenging task. In such studies, a reference MSA is assumed to be the “true” alignment, the sequences are realigned using the MSA algorithm of interest, and the reconstructed MSA is compared with the reference MSA. In the Benchmark Alignment dataBASE (BAliBASE) benchmark database, for example, the reference alignment is based on superimposition of protein structures (Thompson et al. 2005). Alternatively, simulations of sequence evolution can provide a set of sequences with a known history of insertions and deletions along a known evolutionary tree (e.g., Nuin et al. 2006). The most widely used measures for the agreement of a reconstructed MSA with the reference are the column score (CS), which is the percentage of alignment columns in the reference alignment that were accurately reconstructed, and the sum-of-pairs score (SP), which is the percentage of pairs of aligned residues in the reference MSA that are similarly aligned in the reconstructed MSA (Carrillo and Lipman 1988; Thompson et al. 1999). A recent evaluation of SPs across the BAliBASE benchmark concluded that the best alignment programs to date achieve only 76% average accuracy, that is, a quarter of all residue pairs are incorrectly aligned (Nuin et al. 2006).
There are several possible sources for errors in sequence alignment. To begin with, all MSA programs use heuristic methods. In contrast to pairwise sequence alignment that can be optimally solved under a given scoring scheme, finding the optimal MSA is computationally prohibitive. Thus, MSA programs usually produce a suboptimal alignment. Furthermore, even with optimal algorithms for pairwise sequence alignment, there are often several co-optimal solutions, that is, different alignments with the same maximal score. This issue affects all state-of-the-art MSA algorithms that are based on the “progressive alignment approach” (Feng and Doolittle 1987) because they use an optimal pairwise alignment algorithm for iteratively adding sequences to the MSA. Notably, although progressive alignment approaches differ in the manner according to which post-alignment corrections and refinements are made, the progressive alignment step is a critical component in all of them. Landan and Graur (2007, 2008) investigated this source of error and concluded that 80–90% of the columns and 40–50% of aligned residue pairs in a typical MSA are affected by uncertainty due to co-optimal solutions.
An additional point of concern is that the objective functions, which alignment algorithms attempt to maximize, are based on simplified models of the process of molecular sequence evolution. Such approximations may yield high scores for unrealistic alignments. Therefore, even if we had unlimited computational power to find the set of MSAs with the optimal score, we cannot be confident that it includes the true alignment because the true alignment may actually be suboptimal. Additionally, the stochastic nature of sequence evolution introduces noise on top of the signal, and thus, the true evolutionary history will often score less than the highest scoring alignment even if a perfect scoring function were available.
Finally, the alignment may be sensitive to errors in the guide tree, which is used for choosing the order in which the sequences are added to the growing MSA in the progressive alignment approach. Indeed, estimates of guide tree accuracy show that, on average, more than 10% of tree branches are topologically incorrect for data sets of 25 taxa, and this proportion increases with the number of taxa (Nelesen et al. 2008). Several studies measured alignment accuracy in terms of the percentage of correctly aligned residues by comparing a reconstructed MSA with a reference benchmark MSA (e.g., Nelesen et al. 2008; Landan and Graur 2009). These studies concluded that the accuracy of the guide tree has a negligible effect on the accuracy score of the alignment. However, as we will show here, perturbations in the tree affect significant portions of the alignment, shifting residues one way or the other, even though the overall accuracy score does not change significantly. Therefore, we argue that guide tree uncertainty is an important source of alignment uncertainty.
All the above factors contribute to substantial errors in alignments produced by state-of-the-art MSA algorithms. Equally troubling is the fact that, with the notable exception of T-COFFEE (Notredame et al. 2000), most of the widely used MSA programs do not provide information regarding the reliability of different regions in the alignment, for example, ClustalW, MUSCLE, MAFFT, and PRANK (Thompson et al. 1994; Edgar 2004; Katoh et al. 2005; Loytynoja and Goldman 2008). Distinguishing between accurate and noisy alignment regions is important for MSA-dependent analyses, which should try to avoid alignment regions of low quality. Only a few confidence measures for alignments have been published. In phylogeny reconstruction, it is common practice to remove alignment blocks suspect of low quality using the Gblocks program, which defines various cutoffs on the number of gapped sequences in an alignment column (Talavera and Castresana 2007). However, these criteria may excessively filter out regions with insertion/deletion events that can be aligned reliably. A few alignment algorithms output site-specific scores that allow the selection of high-confidence regions. Such a service was first offered by the SOAP program (Loytynoja and Milinkovitch 2001), which tests the robustness of each column to perturbation in the parameters of the popular alignment program ClustalW. The T-COFFEE Web server (Poirot et al. 2003) uses a library of alignments in the construction of the final MSA, and its output MSA is colored according to confidence scores that reflect the agreement between different alignments in the library regarding each aligned residue. Another alignment program that can output an MSA with confidence scores is FSA (Bradley et al. 2009), which uses a statistical model that allows calculation of the uncertainty in the alignment. Similarly, the Heads-or-Tails (HoT) score can be used as a measure of site-specific alignment uncertainty due to the co-optimal solutions problem mentioned above (Landan and Graur 2007, 2008). However, none of these confidence measures account for uncertainties in the guide tree.
Perhaps the most statistically justified approach to assess alignment uncertainty is the use of probabilistic evolutionary models accounting jointly for phylogeny and alignment, as in the programs BEAST and BAli-Phy (Lunter et al. 2005; Redelings and Suchard 2005). These methods use a Bayesian approach that allows calculation of posterior probabilities of the estimated phylogeny and alignment, which is a measure of the confidence in these estimates across the whole solution space. In comparison, in the approach presented here and the previously published HoT score, perturbations are made to the input of deterministic alignment algorithms, such as ClustalW, which were not designed to consider suboptimal solutions. Therefore, in theory, we should prefer the Bayesian approach. However, in practice, the Bayesian approach is infeasible for all but the smallest data sets. For example, the README page of the BAli-Phy Web site recommends “using 12 or fewer taxa in order to limit the time required … .” Even for data sets of few taxa, when genome-wide analyses are concerned, the computational burden of Bayesian algorithms may not be affordable. At least in the near future, it is unlikely that the Bayesian approach will be used in more than a small fraction of comparative genetic research.
In this paper, we show that uncertainties in the guide tree have a considerable effect on the robustness of the MSA. Subsequently, we develop a measure quantifying this effect as a confidence score for each column and for each residue in the alignment based on the robustness of their alignment with respect to perturbations in the guide tree. Our measure is based on the bootstrap (BP) method, which is widely used for assigning confidence scores to branches in reconstructed phylogenetic trees. Benchmark studies with BAliBASE as well as with simulated sequences show that our alignment confidence scores are a good predictor of alignment accuracy, significantly improving on the HoT scores. Therefore, we conclude that guide tree uncertainty is an important source of error in sequence alignment and that MSA-based analyses should take into account site-specific confidence scores in order to avoid artifacts.
Methods
Construction of Perturbed MSAs
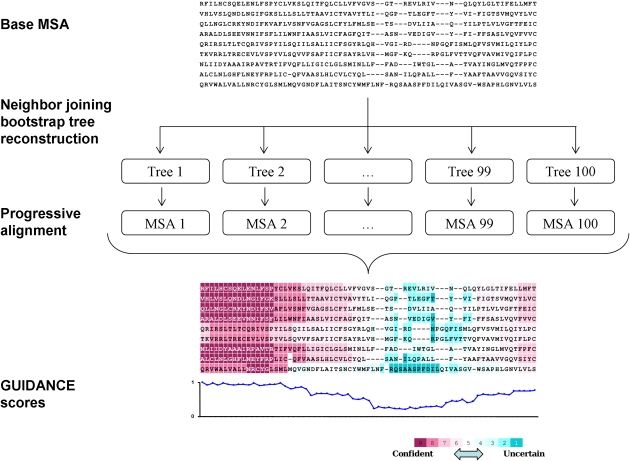
We begin with a standard MSA generated by any progressive alignment program, hereby termed “base MSA.” Similar to the common practice in phylogeny reconstruction, we use the BP approach (Felsenstein 1985) to obtain a set of trees that can be used as a proxy to a confidence interval around the inferred tree. These trees are obtained using the neighbor joining (NJ) algorithm (Saitou and Nei 1987). The pairwise distances used as input to the NJ algorithm are maximum likelihood estimates computed using the Jones, Taylor, and Thornton amino acid replacement matrix (Jones et al. 1992). Next, each BP tree is given as an input guide tree to the alignment program. The resulting set of perturbed MSAs is used for estimating the confidence level of the base MSA. As in the BP test for tree branches, the larger the number of perturbed guide trees, the more accurate is the estimated confidence score. In all our analyses, we used 100 BP replicates. The flow of the algorithm is shown in figure 1.
FIG. 1.
The “GUIDANCE” measure. A base MSA is produced by any progressive alignment method. Bootstrap NJ trees are reconstructed and given as guide trees to the progressive alignment program, producing a set of perturbed MSAs. Sum-of-pairs scores are then calculated by comparing each perturbed MSA with the base MSA and are color coded on each residue in the alignment.
GUIDANCE Confidence Score Calculation
The main goal of our method is to assign a confidence score for each column of the base MSA, which we name “GUIDe tree–based AligNment ConfidencE” (GUIDANCE) scores. To this end, we define a set of distances that measure the dissimilarity between a specific perturbed MSA and the base MSA. Specifically, three widely used distances are computed:
CS: Each column of the base MSA that is identically aligned in the perturbed MSA is given a score of 1; all other columns are given the score 0.
SP: Each pair of residues in the base MSA that is identically aligned in the perturbed MSA is given a score of 1; all other residue pairs are given the score 0.
Sum-of-pairs column score (SPC): The score of each column is simply the average of the SPs over all pairs in it.
The CS cannot distinguish between a column with one error and a column with many errors. In contrast, the SPC can better quantify the difference between a column in the base MSA and a column in the perturbed MSA. Subsequently, unless stated otherwise, we only use SP and SPC.
Each residue pair in the base MSA can have a score of 1 or 0 in each of the perturbed MSAs. The average score over all perturbed MSAs is a measure of the confidence in aligning these two residues and is termed here the GUIDANCE residue pair score. The average SPC over all perturbed MSAs is termed here the GUIDANCE CS.
Furthermore, we define a confidence score for a specific residue in a specific alignment column, the GUIDANCE residue score. This score is calculated by averaging the GUIDANCE residue pair scores over all pairs that include the residue in question. This score reflects the confidence of aligning this specific residue in this column.
Benchmark Data
The BAliBASE benchmark database (Thompson et al. 2005) consists of MSAs that are based on structural alignments and are specifically designed for the evaluation and comparison of MSA programs. The database is categorized into several reference sets according to types of alignment problems. Here, we use BAliBASE reference sets 1–5, which include 218 data sets.
We applied the GUIDANCE method to each data set, using the MAFFT alignment program (version 6.711), generating GUIDANCE residue pair scores for each pair of aligned residues in the base MSA. We then used the BAliBASE reference alignments in order to assess the predictive power of the GUIDANCE score to identify alignment errors. Each aligned residue pair in the MAFFT base MSA was classified as correct/incorrect by comparing it with the reference MSA. A receiver operating characteristic (ROC) analysis (Green and Swets 1966; Fawcett 2006) was conducted using the R package ROCR (Sing et al. 2005) to evaluate the specificity and sensitivity of the GUIDANCE confidence measure. The performance of the GUIDANCE predictor was measured by the area under the ROC curve (AUC). The BAliBASE reference provides annotations of alignment regions for which the alignment is verified by superposition of protein structures, named core blocks. Therefore, we limited all the BAliBASE analyses to columns belonging to these core blocks only.
Simulations
The advantage of simulation is that the evolutionary history of insertion and deletion events is absolutely known. We used the ROSE program (Stoye et al. 1998) to simulate protein alignments based on BAliBASE data sets. Each data set of genuine protein sequences was used to reconstruct a phylogenetic tree using NJ. Site-specific evolutionary rates were estimated using rate4site (Pupko et al. 2002). We fed the tree and the rates as input to ROSE, thereby producing a simulated data set for each of the original BAliBASE data sets, mimicking the biological characteristics of these proteins. These simulated data sets were used to conduct the ROC analysis as described above, except that here all columns in the reference alignment were used.
To supplement these simulations in an independent approach that is not based on the BAliBASE data, we also used the INDELible program (Fletcher and Yang 2009) to simulate 100 protein data sets of 50 sequences using a root sequence length of 300, random trees, a power law model of indel distribution with indelrate = 0.1, gamma-distributed among-site rate variation (α = 1), and the LG replacement matrix.
Comparison with the HoT Confidence Measure
We compared the performance of the GUIDANCE measure with the HoT score, as described in Landan and Graur (2008), using the same MAFFT version (6.711). ROC analysis was performed as described above.
Results
Most Alignment Columns Are Sensitive to Guide Tree Uncertainty
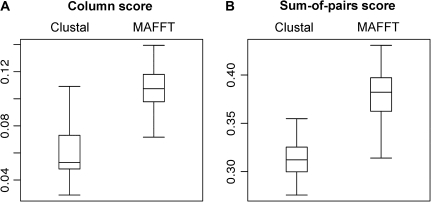
We applied the GUIDANCE method, using both MAFFT (Katoh et al. 2005) and ClustalW (Thompson et al. 1994), to an exemplary protein data set consisting of 130 homologous chemoreceptors from Drosophila melanogaster (Robertson et al. 2003). The purpose of this analysis was to study the effect of the guide tree on the resulting MSA for a typical alignment problem. Figure 2 shows the level of agreement between the perturbed MSAs, generated by the GUIDANCE method, and the base MSA, generated by either ClustalW or MAFFT, using either CS or SP. For ClustalW, the CS vary between 0.029 and 0.11, with a median of 0.053 (fig. 2A). That is, in a typical perturbed MSA, less than 6% of the columns are identically aligned as in the base MSA. For MAFFT alignments, the median is 11%. Taken together, these results suggest that alignment columns are highly sensitive to uncertainties in the guide tree. We next tested the sensitivity of aligned residue pairs in terms of the average SP of each perturbed MSA (fig. 2B). For ClustalW, the SPs vary between 0.28 and 0.36, with a median of 0.31. For MAFFT, the SPs vary between 0.31 and 0.43, with a median of 0.38. These results imply that in any perturbed MSA, less than 50% of residue pairs are aligned as in the base MSA.
FIG. 2.
Agreement between MSAs built based on perturbed bootstrap trees and the base MSA for MAFFT and ClustalW alignments of Drosophila melanogaster chemoreceptor sequences. Box plots summarize medians, quartiles, and range of (A) column scores and (B) sum-of-pairs scores.
GUIDANCE Scores Can Identify Alignment Errors
Because uncertainty in the guide tree results in alignment uncertainty (as shown above), we hypothesized that alignment errors can be detected by searching for those alignment regions that are sensitive to guide tree perturbations. To this end, we used a continuous range of cutoffs for the GUIDANCE scores. The cutoff was used as a classification criterion to separate columns or residue pairs into reliable and unreliable. In order to test how well this classification correctly detects actual alignment errors, the columns and residue pairs of the inferred alignment should be compared with a known true one. Such comparison will reveal the proportions of true-positive (correctly aligned residues that are marked as reliable by the GUIDANCE classifier) and false-positive (erroneously aligned residues that are marked as reliable by the GUIDANCE classifier) predictions. Because, in most cases, the true alignment is unknown, two approaches were used here to test the performance of the GUIDANCE classifier: 1) comparison against a reference benchmark of curated MSAs and 2) simulation studies. In addition, we compare the performance of the GUIDANCE classifier with the previously published HoT score, which was shown to be a highly accurate predictor of alignment errors (Landan and Graur 2008).
BAliBASE Benchmark
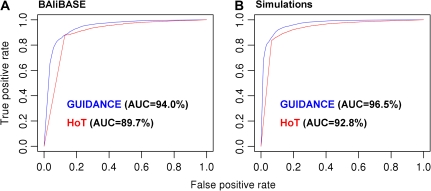
We applied the GUIDANCE measure, using the MAFFT alignment algorithm, to the BAliBASE benchmark (Thompson et al. 2005), which is based on structural homology of protein families. We used BAliBASE reference sets 1–5, consisting of 218 protein sequence alignments. Figure 3A presents a ROC analysis of GUIDANCE scores and HoT scores for residue pairs, as classifiers of alignment errors relative to the BAliBASE reference. Both methods accurately identified alignment errors, with an advantage to GUIDANCE over HoT, giving an AUC of 94.0% and 89.7%, respectively.
FIG. 3.
Accuracy of GUIDANCE scores in identifying alignment errors. ROC curves for HoT scores (red) and GUIDANCE scores (blue) of aligned residue pairs relative to the BAliBASE benchmark (A) and the simulation benchmark (B).
Simulation Benchmark
Simulation studies provide further support for the higher accuracy of GUIDANCE scores compared with HoT (fig. 3B). As opposed to real protein benchmarks, in which one can never be absolutely sure of the true alignment, the exact locations of gaps are known with certainty in alignments of sequences generated by simulation. However, one has to make sure that the simulation settings reflect as much as possible true evolutionary dynamics. To this end, our simulations were based on the BAliBASE reference MSAs. That is, we simulated a reference alignment based on the phylogenetic tree and site-specific evolutionary rates inferred for each of the 218 data sets in BAliBASE in order to replicate the natural evolutionary dynamics of protein families. The GUIDANCE classifier accurately identified alignment errors with an AUC of 96.5%, improving on the 92.8% of the HoT classifier. An example demonstrating the difference between GUIDANCE and HoT is given in figure 4, which plots the distribution of GUIDANCE and HoT CS compared with the actual alignment accuracy in the first 260 columns of a typical alignment of 11 simulated sequences. Both GUIDANCE and HoT scores correlate with the actual alignment errors, giving Pearson correlation coefficients of 0.81 and 0.50, respectively.
FIG. 4.
An example from the simulation benchmark. Distribution of GUIDANCE column scores (blue) compared with HoT scores (red) and the actual alignment accuracy (green) in the first 260 columns of a typical simulated alignment.
Independent simulations of 100 data sets using the INDELible program (Fletcher and Yang 2009), which were not based on BAliBASE data, gave comparable results—an AUC of 90.1% for GUIDANCE and 88.4% for HoT. To summarize, the results obtained for the simulated data are in line with those obtained for the BAliBASE benchmark.
A Combined GUIDANCE–HoT Score
One would expect that GUIDANCE and HoT identify different types of alignment errors. We thus tried to combine the two scores in order to produce an even more powerful predictor. We investigated several approaches in combining the two scores, including weighted average and a minimum function. However, they all produced similar ROC performance as the GUIDANCE measure alone.
Comparison with Gblocks
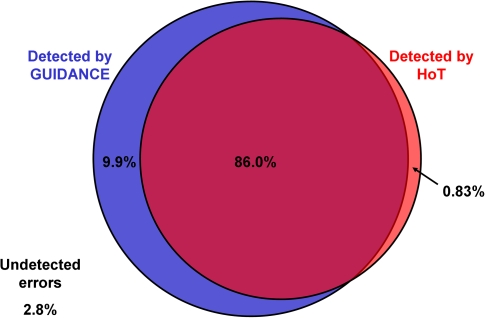
Figure 5 summarizes the overlap between alignment errors that were detected by GUIDANCE and HoT scores as a Venn diagram. A total of 1,914,804 incorrectly aligned residue pairs in the MAFFT reconstruction of the BAliBASE benchmark were classified as detected by either method if their confidence score was less than 1. Almost 10% of the alignment errors were detected by GUIDANCE and not by HoT. In contrast, less than 1% of alignment errors were detected by HoT and not by GUIDANCE. Only 2.8% of alignment errors were not detected by either method.
FIG. 5.
Venn diagram of alignment error detection by the GUIDANCE and HoT scores. A total of 1,914,804 incorrectly aligned residue pairs in the BAliBASE benchmark were classified as detected by either method if their confidence score was less than 1. GUIDANCE detected 95.9% of the errors, whereas HoT detected less than 87%, and the HoT-detected errors are nearly a subset of the GUIDANCE-detected errors.
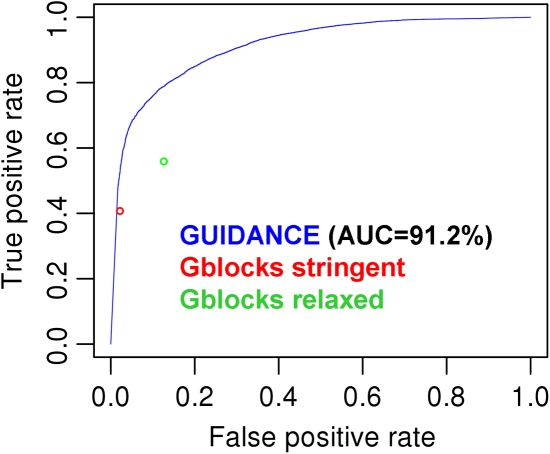
The Gblocks program (Castresana 2000) is designed to eliminate poorly aligned regions of the MSA, effectively giving a binary score for every column. To compare the performance of Gblocks and our method, we ran Gblocks on the simulation benchmark using two sets of parameters, “stringent” and “relaxed,” as defined in Talavera and Castresana (2007). Figure 6 presents the false-positive and the true-positive rates of Gblocks together with a ROC analysis of GUIDANCE CS. The results show that for the same proportion of false-positives, GUIDANCE provides more true-positives for both the stringent and the relaxed conditions.
FIG. 6.
Comparison with Gblocks. The false-positive and true-positive rates of Gblocks “stringent” (red) and “relaxed” (green) parameter sets in comparison with a ROC curve for GUIDANCE column scores (blue) for the simulation benchmark.
Visualization of Alignment Uncertainty
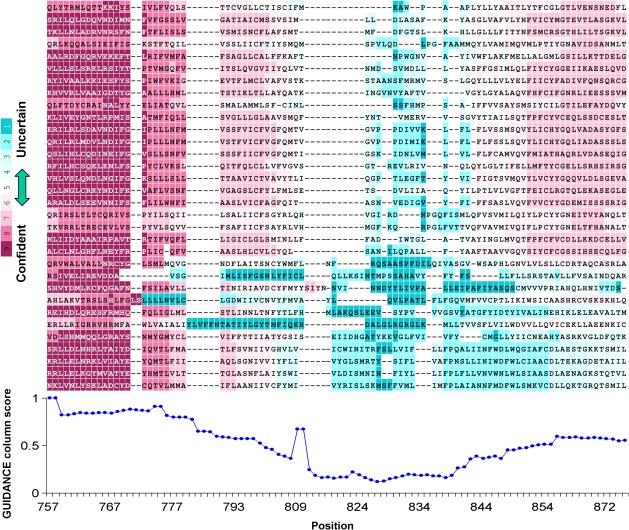
To facilitate examination of a specific MSA of interest, we suggest a graphic visualization of alignment uncertainty by coloring the MSA according to the GUIDANCE scores, similar to the coloring of the output MSA given by the T-COFFEE web server (Poirot et al. 2003). As an example, figure 7 shows a colored portion of the same MSA of chemoreceptor sequences that was used in figure 2 above. The GUIDANCE residue scores are color coded on the MSA. This is a convenient way to inspect the implications of low-confidence regions on subsequent analysis. Magenta-colored residues can be considered reliable, whereas blue-colored residues should be avoided. In addition, a plot of the GUIDANCE CS is presented.
FIG. 7.
Color-coded GUIDANCE scores for Drosophila melanogaster chemoreceptor sequences. A portion of the MSA is presented (columns 757–875 of 32 sequences). Confidently aligned residues are colored in shades of magenta and pink, whereas uncertain residues are colored in shades of blue. GUIDANCE column scores are plotted below the alignment.
As expected, wide gapless blocks such as the first from the left score close to 100% certainty. Note the alignment is confident, even though the sequences are variable. Downstream, the second and third blocks score significantly lower, even though they similarly appear to be solid blocks. Furthermore, the GUIDANCE residue scores discriminate between the majority of sequences in the third block that are reliably aligned and two sequences that stand out in unreliable blue. Such a case of a divergent badly aligned sequence can be easily discovered using GUIDANCE.
Discussion
In this paper, we demonstrated that alignment reliability is dramatically affected by uncertainties in the guide tree. Based on this observation, we devised a new measure for alignment confidence, which uses BP trees to test the robustness of the alignment to perturbations in the guide tree. This methodology produces confidence GUIDANCE scores for each alignment column and each aligned residue. Thereby, any MSA-based analysis can now take into consideration the alignment reliability of every residue.
The use of BP trees as guide trees for progressive sequence alignment may seem ill advised. The BP sampling technique deliberately introduces noise into the reconstruction of the tree, creating trees with some errors in the branching order of the internal nodes. When the process of progressive alignment reaches an erroneously reconstructed internal node, the alignment effectively represents an ancestral sequence that did not exist in the true evolutionary history. However, the fundamental assumption of our approach is that the conventionally used guide tree most often contains numerous errors (Nelesen et al. 2008). Therefore, the BP sampling of perturbed trees provides a statistically justified representation of the level of error in the guide tree.
Ideally, alignment and tree should be reconstructed simultaneously taking into account uncertainties in all related parameters: tree topology, branch lengths, indel probabilities, substitution models, and so forth. In Bayesian methods (see Introduction) that use the Markov Chain Monte Carlo (MCMC) approach, a by-product of the method may be a confidence measure in terms of the posterior probabilities of each alignment column. Our approach can be viewed as related to this MCMC approach, except only uncertainty in tree topology is accounted for (and all other parameters are fixed). In our method, the set of BP trees is a sample from the space of possible tree topologies. A trivial extension of our method would be to consider a set of MCMC trees with their associated posterior probabilities as the set of guide trees instead of the BP trees used here. Although this will clearly be more accurate, it is likely to prohibit the use of our method for large data sets.
Another point worth noting is that the GUIDANCE confidence score is absolutely dependent on uncertainty in the guide tree. In principle, it is possible to have 100% BP support for the guide tree, in which case the GUIDANCE support will be 100% for every alignment column. However, in practice, one rarely sees 100% support for all tree branches. Indeed, this does not happen in any of the 218 data sets in the BAliBASE benchmark, even though many of them contain fewer than ten taxa.
A practical consideration with our approach is the increased running time required for (typically 100) BP repeats, reconstructing many guide trees and MSAs. However, because we use simple NJ BP trees, and the relatively fast MAFFT alignment algorithm, this increased running time will often be negligible in comparison with the running time of downstream analysis, such as Bayesian phylogeny reconstruction or positive selection inference.
We evaluated the predictive power of GUIDANCE scores to identify alignment errors both for the BAliBASE benchmark of real protein alignments and for simulated alignments. We also compared the new GUIDANCE measure with the previously published HoT score, which is a measure of alignment unreliability due to the co-optimal solutions problem (Landan and Graur 2007, 2008). Notably, the HoT score was previously shown to be highly successful in predicting residue pairs that are erroneously aligned, and in this paper, we report an AUC of 89.7% for HoT scores applied to the BAliBASE benchmark. The GUIDANCE scores make a substantial improvement on top of that, reaching an AUC value of 94.0%. Simply put, if we pick a point along the ROC plot in figure 3A, we could use GUIDANCE scores to identify 80% of the correctly aligned residues in an average MSA while “suffering” from only a 5% rate of false-positives.
Interestingly, an average or a minimum of the two scores does not improve the AUC any further. This is surprising because one could expect some alignment columns that are uncertain in terms of co-optimal solutions but not in terms of the robustness to the guide tree. If such columns existed in sufficient numbers, then the combination of HoT and GUIDANCE measures should improve the prediction accuracy relative to the GUIDANCE measure alone. Because this is not the case, we conclude that most columns affected by the co-optimality issue are also affected by uncertainty in the guide tree. This does appear to be the case because less than 1% of alignment errors were detected by the HoT score and not by the GUIDANCE score (fig. 5). Clearly, while GUIDANCE focuses only on the effect of guide tree on alignment uncertainty, research on other sources of errors beside the guide tree can lead to better detection and quantification of alignment errors.
We conclude that the new alignment confidence measure is a highly accurate predictor for the correctness of specific MSA columns. As such, it is valuable for any MSA-based analysis. We encourage researchers to use the GUIDANCE confidence measure before any downstream analysis rather than to rely on alignments as unqualified truths.
Acknowledgments
T.P. is supported by the Israel Science Foundation grant 878/09. D.G. and G.L. are supported by the US National Library of Medicine grant LM010009-01. O.P. is a fellow of the Converging Technologies Program. E.P. is a fellow of the Edmond J. Safra Bioinformatics Program. We thank Nimrod D. Rubinstein, David Zeevi, David Burstein, and two anonymous referees for critically reading the manuscript.
References
- Bradley RK, Roberts A, Smoot M, Juvekar S, Do J, Dewey C, Holmes I, Pachter L. Fast statistical alignment. PLoS Comput Biol. 2009;5:e1000392. doi: 10.1371/journal.pcbi.1000392. [DOI] [PMC free article] [PubMed] [Google Scholar]
- Carrillo H, Lipman D. The multiple sequence alignment problem in biology. SIAM J Appl Math. 1988;48:1073–1082. [Google Scholar]
- Castresana J. Selection of conserved blocks from multiple alignments for their use in phylogenetic analysis. Mol Biol Evol. 2000;17:540–552. doi: 10.1093/oxfordjournals.molbev.a026334. [DOI] [PubMed] [Google Scholar]
- Edgar RC. MUSCLE: multiple sequence alignment with high accuracy and high throughput. Nucleic Acids Res. 2004;32:1792–1797. doi: 10.1093/nar/gkh340. [DOI] [PMC free article] [PubMed] [Google Scholar]
- Fawcett T. An introduction to ROC analysis. Pattern Recog Lett. 2006;27:861–874. [Google Scholar]
- Felsenstein J. Confidence limits on phylogenies: an approach using the bootstrap. Evolution. 1985;39:783–791. doi: 10.1111/j.1558-5646.1985.tb00420.x. [DOI] [PubMed] [Google Scholar]
- Feng DF, Doolittle RF. Progressive sequence alignment as a prerequisite to correct phylogenetic trees. J Mol Evol. 1987;25:351–360. doi: 10.1007/BF02603120. [DOI] [PubMed] [Google Scholar]
- Fletcher W, Yang Z. INDELible: a flexible simulator of biological sequence evolution. Mol Biol Evol. 2009;26:1879–1888. doi: 10.1093/molbev/msp098. [DOI] [PMC free article] [PubMed] [Google Scholar]
- Green DM, Swets JA. Signal detection theory and psychophysics. New York: John Wiley & Sons; 1966. [Google Scholar]
- Jones DT, Taylor WR, Thornton JM. The rapid generation of mutation data matrices from protein sequences. Comput Appl Biosci. 1992;8:275–282. doi: 10.1093/bioinformatics/8.3.275. [DOI] [PubMed] [Google Scholar]
- Katoh K, Kuma K, Toh H, Miyata T. MAFFT version 5: improvement in accuracy of multiple sequence alignment. Nucleic Acids Res. 2005;33:511–518. doi: 10.1093/nar/gki198. [DOI] [PMC free article] [PubMed] [Google Scholar]
- Landan G, Graur D. Heads or tails: a simple reliability check for multiple sequence alignments. Mol Biol Evol. 2007;24:1380–1383. doi: 10.1093/molbev/msm060. [DOI] [PubMed] [Google Scholar]
- Landan G, Graur D. Local reliability measures from sets of -optimal multiple sequence alignments. Pac Symp Biocomput. 2008;13:15–24. [PubMed] [Google Scholar]
- Landan G, Graur D. Characterization of pairwise and multiple sequence alignment errors. Gene. 2009;441:141–147. doi: 10.1016/j.gene.2008.05.016. [DOI] [PubMed] [Google Scholar]
- Loytynoja A, Goldman N. Phylogeny-aware gap placement prevents errors in sequence alignment and evolutionary analysis. Science. 2008;320:1632–1635. doi: 10.1126/science.1158395. [DOI] [PubMed] [Google Scholar]
- Loytynoja A, Milinkovitch MC. SOAP, cleaning multiple alignments from unstable blocks. Bioinformatics. 2001;17:573–574. doi: 10.1093/bioinformatics/17.6.573. [DOI] [PubMed] [Google Scholar]
- Lunter G, Miklos I, Drummond A, Jensen JL, Hein J. Bayesian coestimation of phylogeny and sequence alignment. BMC Bioinformatics. 2005;6:83. doi: 10.1186/1471-2105-6-83. [DOI] [PMC free article] [PubMed] [Google Scholar]
- Nelesen S, Liu K, Zhao D, Linder CR, Warnow T. The effect of the guide tree on multiple sequence alignments and subsequent phylogenetic analyses. Pac Symp Biocomput. 2008;13:25–36. doi: 10.1142/9789812776136_0004. [DOI] [PubMed] [Google Scholar]
- Notredame C, Higgins DG, Heringa J. T-Coffee: a novel method for fast and accurate multiple sequence alignment. J Mol Biol. 2000;302:205–217. doi: 10.1006/jmbi.2000.4042. [DOI] [PubMed] [Google Scholar]
- Nuin PA, Wang Z, Tillier ER. The accuracy of several multiple sequence alignment programs for proteins. BMC Bioinformatics. 2006;7:471. doi: 10.1186/1471-2105-7-471. [DOI] [PMC free article] [PubMed] [Google Scholar]
- Poirot O, O’Toole E, Notredame C. Tcoffee@igs: a web server for computing, evaluating and combining multiple sequence alignments. Nucleic Acids Res. 2003;31:3503–3506. doi: 10.1093/nar/gkg522. [DOI] [PMC free article] [PubMed] [Google Scholar]
- Pupko T, Bell RE, Mayrose I, Glaser F, Ben-Tal N. Rate4Site: an algorithmic tool for the identification of functional regions in proteins by surface mapping of evolutionary determinants within their homologues. Bioinformatics. 2002;18(Suppl 1):S71–S77. doi: 10.1093/bioinformatics/18.suppl_1.s71. [DOI] [PubMed] [Google Scholar]
- Redelings BD, Suchard MA. Joint Bayesian estimation of alignment and phylogeny. Syst Biol. 2005;54:401–418. doi: 10.1080/10635150590947041. [DOI] [PubMed] [Google Scholar]
- Robertson HM, Warr CG, Carlson JR. Molecular evolution of the insect chemoreceptor gene superfamily in Drosophila melanogaster. Proc Natl Acad Sci U S A. 2003;100(Suppl 2):14537–14542. doi: 10.1073/pnas.2335847100. [DOI] [PMC free article] [PubMed] [Google Scholar]
- Saitou N, Nei M. The neighbor-joining method: a new method for reconstructing phylogenetic trees. Mol Biol Evol. 1987;4:406–425. doi: 10.1093/oxfordjournals.molbev.a040454. [DOI] [PubMed] [Google Scholar]
- Sing T, Sander O, Beerenwinkel N, Lengauer T. ROCR: visualizing classifier performance in R. Bioinformatics. 2005;21:3940–3941. doi: 10.1093/bioinformatics/bti623. [DOI] [PubMed] [Google Scholar]
- Stoye J, Evers D, Meyer F. Rose: generating sequence families. Bioinformatics. 1998;14:157–163. doi: 10.1093/bioinformatics/14.2.157. [DOI] [PubMed] [Google Scholar]
- Talavera G, Castresana J. Improvement of phylogenies after removing divergent and ambiguously aligned blocks from protein sequence alignments. Syst Biol. 2007;56:564–577. doi: 10.1080/10635150701472164. [DOI] [PubMed] [Google Scholar]
- Thompson JD, Higgins DG, Gibson TJ. CLUSTAL W: improving the sensitivity of progressive multiple sequence alignment through sequence weighting, position-specific gap penalties and weight matrix choice. Nucleic Acids Res. 1994;22:4673–4680. doi: 10.1093/nar/22.22.4673. [DOI] [PMC free article] [PubMed] [Google Scholar]
- Thompson JD, Koehl P, Ripp R, Poch O. BAliBASE 3.0: latest developments of the multiple sequence alignment benchmark. Proteins. 2005;61:127–136. doi: 10.1002/prot.20527. [DOI] [PubMed] [Google Scholar]
- Thompson JD, Plewniak F, Poch O. A comprehensive comparison of multiple sequence alignment programs. Nucleic Acids Res. 1999;27:2682–2690. doi: 10.1093/nar/27.13.2682. [DOI] [PMC free article] [PubMed] [Google Scholar]


