

Abstract
Background
The Gail model has been commonly used to estimate a woman’s breast cancer risk in a certain time period. High bone mineral density (BMD) is also a significant risk factor for breast cancer, but it plays no role in the Gail model. The objective of this study was to investigate whether hip BMD predicts postmenopausal breast cancer risk independently of the Gail score.
Methods
In this prospective study, postmenopausal women (N = 9,941) who had baseline hip BMD and Gail score from the Women’s Health Initiative were included in the analysis. Their average age was 63.0 ± 7.4 years at baseline.
Results
After an average of 8.43-years of follow-up, 327 incident breast cancer cases were reported and adjudicated. In a multivariate Cox proportional hazards model, the hazard ratios (95%CI) for incident breast cancer were 1.35 (1.05–1.73) for high Gail score (≥1.67%), and 1.25 (1.11–1.40) for each unit of increase in total hip BMD T-score. Restricting the analysis to women with both BMD and Gail score above the median, a sharp increase in incident breast cancer for women with the highest BMD and Gail scores was found (p<0.05).
Conclusions
The contribution of BMD to the prediction of incident postmenopausal breast cancer across the entire population is independent from Gail score. However, among women with both high BMD and high Gail score there appears to be an interaction between these two factors. These findings suggest that BMD and Gail score may be used together to better quantify risk of breast cancer.
Keywords: breast cancer, postmenopausal women, Gail score, bone mineral density, Women’s Health Initiative, ROC
Introduction
Identifying women at elevated risk is a critical step for breast cancer risk reduction.1 Recently, there has been increasing attention to developing statistical models to estimate breast cancer risk more accurately.2 Bone mineral density (BMD) is routinely measured by dual-energy x-ray absorptiometry (DXA) to identify women with low bone density (osteopenia) or osteoporosis that places them at increased fracture risk requiring medical intervention. Recently, some studies3–7 have found an association between higher BMD and higher breast cancer risk. As a result, BMD has been proposed as a potential addition to breast cancer risk models. However, relationships among BMD, traditional breast cancer risk assessment tool results, such as the Gail risk model, and breast cancer incidence have not yet been examined.
The Gail risk model is a well known tool that estimates five year and lifetime risk of invasive breast cancer for women 35 years of age or older.8 Factors in the original Gail model include the number of first-degree relatives with breast cancer, current age, age at first menstrual period, number of breast biopsies, and age at first live birth.8 Since it’s inception, the Gail score has been continually improved upon, the version of the Gail score mostly widely used currently includes race/ethnicity, history of atypical hyperplasia and a history of lobular carcinoma in situ.9 The Gail score has been commonly used as a clinical and research indicator of breast cancer risk and was employed to enroll high risk women into breast cancer prevention trials.
In this paper, we have assessed the relationships between Gail scores, baseline hip BMD and breast cancer in a large cohort of postmenopausal women from the Women’s Health Initiative (WHI). The primary objective of this study was to investigate whether baseline hip BMD contributes to breast cancer risk prediction independently from Gail score. Additional analyses were also conducted to examine the accuracy of prediction of BMD and Gail score for incident breast cancer in postmenopausal women.
Method
Population
The study was conducted based on data from participants at three Women’s Health Initiative BMD clinical centers where bone density scans were performed using DXA. The WHI is a large (n = 161,809) prospective study conducted in 40 clinical centers throughout the United States. The WHI cohort comprised non-Hispanic White, Hispanics, Black, American Indian, and Asian/Pacific Islander postmenopausal women. There were one observational study and four clinical trials in the WHI. Details about the WHI study design10 and exclusion and inclusion criteria11 have been reported elsewhere.
Study procedure
At baseline, self-administered or interviewer administered questionnaires were completed by each participant. All women had physical examinations at the time of enrollment. During the follow-up, WHI-Observational Study (WHI-OS) women completed questionnaires annually to update medical and other lifestyle information and WHI-Clinical Trial (WHI-CT) participants completed the questionnaires every 6 months. The WHI study protocol was reviewed and approved by Human Subjects Review Committees at each participating institution and all women provided written informed consent.
DXA measurements
BMD was measured at three WHI BMD clinic centers (Pittsburgh, PA, Birmingham, AL, and Tucson/Phoenix, AZ) using dual-energy x-ray absorptiometry (DXA QDR, Hologic Inc., Waltham, MA). The positioning and analysis of DXA scans were performed according to standard WHI protocols by radiology technicians who were trained and certified by both the Hologic Company and the WHI Bone Density Coordinating Center at the University of California, San Francisco. The ongoing WHI quality assurance program monitored machine and technician performance by reviewing phantom scans, a random sample of all scans, flagging scans with specific problems, and by controlling hardware and software changes. In addition to daily and weekly phantom scans at each clinic, a set of calibration phantoms were also periodically circulated and scanned across DXA instruments in the WHI. DXA-derived BMD, body composition and T-scores were used in the analyses. Osteoporosis and low bone density were defined by the World Health Organization (WHO) criteria based on DXA-derived T-scores (< − 2.5 = osteoporosis, −1 to −2.5 = low bone density, > −1 = normal) for total hip. National Health and Nutrition Examine Survey (NHANES III) was used as the reference for hip T-score.
Variables from baseline
Questionnaires were administrated to collect information on race/ethnicity; ages at enrollment, menarche, and first birth; number of breast biopsies; number of first-degree relatives with breast cancer; years since menopause; menopausal hormone therapy (MHT) use (never MHT user, past MHT user, current MHT user); dietary intakes; energy expenditures; lifestyle factors (such as smoking etc); osteoporosis medication; osteoporosis diagnosis; previous breast and other cancer diagnoses. Physical measurements, including weight and height were conducted using standard protocols at the WHI clinic where the participants were enrolled. Body mass index (BMI) was calculated as weight (kg)/height (m) 2. Gail 5-year breast cancer risk estimate was calculated with the following factors: age, age at menarche, age at first live birth, number of breast biopsies, number of first degree relatives with breast cancer, and race (defined as White, Black/African American, Hispanic/Latino, or Other). History of atypical hyperplasia and history of lobular carcinoma in situ were not collected hence were not included in the WHI calculation, although they are in the Gail model.9
Follow-up data
Self-report of breast cancer diagnosis was first verified at each local clinical center using medical records, then reviewed and adjudicated centrally by trained WHI physicians. Cancer stages and receptor status of the tumor were recorded at the WHI Clinical Coordinating Center using the Surveillance, Epidemiology and End Results Program (SEER) coding system.12, 13
Statistical methods
Statistical analyses were done using Stata (College Station TX, version: 9.0). Women with a cancer history at baseline were excluded from the analysis. Descriptive analyses by incident breast cancer status were conducted. The relationships between Gail Score, osteoporosis, and BMD were examined using ANOVA and logistic regression analysis. BMD was used either as a continuous variable, T-score, or a categorical variable (osteoporosis, low BMD, or normal defined by WHO).
To investigate the association between Gail score, BMD and incident invasive breast cancer, delayed entry Cox proportional hazards models were utilized, in which age at the enrollment was used as the entry time in the Cox models and the age at the event or loss to follow up was used as the exit time. It should be noted that with the delayed entry model, the incidence of breast cancer was expressed in terms of the actual ages of the participants, not as time under observation. We first used Gail Score and BMD each alone as the predictor in separate univariate models. Then we included both Gail score and BMD in the Cox models as main effects. Final models with other covariates were also developed based on forward selection and backward elimination stepwise regressions, which yielded models with the same covariates. The following variables were examined as potential covariates: CT versus OS, race/ethnicity, education, and baseline BMI, weight, percent body fat, prior hormone use, total energy intake, energy expenditure (METs), smoking status, and alcohol intake. Schoenfeld’s residuals were used to test the proportional hazards assumption in the Cox models and the test results showed that the proportional hazards assumption was not violated in this sample (p=0.4653).
Receiver-operator characteristic (ROC) curve analyses were conducted to examine different prediction properties of each Cox model. Testing for significant interactions was conducted to explore the effect of race/ethnicity and BMI on the relationship between Gail score, BMD and incident breast cancer. An interaction term of BMD and Gail score was also examined in the entire sample and in a post hoc analysis with women who had both BMD and Gail score above the median value for the respective measurement. For a more detailed analysis, the sample was simultaneously partitioned by deciles of Gail score and BMD T-score, yielding 100 cells. In each cell the incidence rate per 10,000 person-years was calculated, and then these rates were smoothed and displayed as a contour plot by the Gri software (http://gnuwin32.sourceforge.net/packages/gri.htm).
Results
Excluding 1450 women who had cancer history at baseline, the final results included 9941 women with BMD. Among them, 5516 women were enrolled in the WHI-OS and 4425 women in the WHI-CT. The average age was 63.0 ± 7.4 years (mean ± SD). The mean total hip BMD was 0.853 ± 0.139 g/cm3 (T-score = −0.818 ± 1.054). The median 5-year Gail score was 1.42%. After an average of 8.43-years of follow-up, 327 incident breast cancer cases were identified.
Table 1 presents the baseline characteristics of the study participants. Breast cancer cases were more likely to be white and more likely to have had prior biopsies. As expected, breast cancer risk factors, including baseline hormone use, earlier menarche, family history of breast cancer, smoking, high consumption of alcohol, higher BMD, high Gail score, high BMI, high percent body fat, high energy intake, and low physical activity levels, were more prevalent in the incident cases than in the no breast cancer group.
Table 1.
Baseline Characteristics of the Participants
| Categorical Variables | |||
|---|---|---|---|
| No Incident Breast Cancer (N = 9614) | Incident Breast Cancer (N = 327) | ||
| n (%) | n (%) | P value | |
| Age | |||
| 50–59 | 3404 (35.4) | 102 (31.2) | |
| 60–69 | 4140 (43.1) | 139 (42.5) | |
| 70–79 | 2070 (21.5) | 86 (26.3) | 0.085 |
| Ethnicity | |||
| White (non Hispanic) | 7388 (76.9) | 270 (82.6) | |
| Black or African American | 1397 (14.6) | 35 (10.7) | |
| Hispanic/Latino | 628 (6.5) | 17 (5.2) | |
| American Indian/Alaskan Native | 114 (1.2) | 3 (0.9) | |
| Other | 76 (0.8) | 2 (0.6) | 0.219 |
| Baseline HRT Use | |||
| Never Used | 4547 (47.3) | 167 (51.2) | |
| Past User | 1550 (16.1) | 39 (12.0) | |
| Current User | 3513 (36.6) | 120 (36.8) | 0.108 |
| Age at First Birth (GM) | |||
| Less than 19 | 1603 (16.7) | 57 (17.4) | |
| 20–24 | 3739 (38.9) | 109 (33.3) | |
| 25–29 or nulliparious | 2823 (29.4) | 114 (34.9) | |
| 30 or older | 589 (6.1) | 21 (6.4) | |
| Unknown | 860 (9.0) | 26 (8.0) | 0.180 |
| Number of Biopsies (GM) | |||
| None | 6469 (67.3) | 196 (59.9) | |
| 1 | 1229 (12.8) | 73 (22.3) | |
| 2 or more | 550 (5.7) | 20 (6.1) | |
| Unknown | 1366 (14.2) | 38 (11.6) | < 0.001 |
| Age at Menarche | |||
| 14 Years or Older | 2413 (25.1) | 76 (23.2) | |
| 12–13 Years | 5200 (54.1) | 177 (54.1) | |
| 11 Years or Younger | 1959 (20.4) | 72 (22.0) | |
| Unknown | 42 (0.4) | 2 (0.6) | 0.784 |
| First Degree Relatives w/Breast Cancer | |||
| 0 | 7878 (82.0) | 240 (73.6) | |
| 1 | 1100 (11.5) | 53 (16.3) | |
| 2 or more | 117 (1.2) | 12 (3.7) | |
| Unknown | 511 (5.3) | 21 (6.4) | < 0.0001 |
| Smoking | |||
| Never Smoked | 5204 (54.9) | 154 (47.5) | |
| Past Smoker | 3513 (37.1) | 141 (43.5) | |
| Current Smoker | 763 (8.1) | 29 (9.0) | 0.031 |
| Alcohol Consumption | |||
| Non drinker | 1577 (16.6) | 50 (15.4) | |
| Past drinker | 2122 (22.3) | 54 (16.7) | |
| <1 drink per month | 1254 (13.2) | 44 (13.6) | |
| <1 drink per week | 1874 (19.7) | 60 (20.4) | |
| 1 to <7 drinks per week | 1957 (20.5) | 70 (21.6) | |
| 7+ drinks per week | 745 (7.8) | 40 (12.4) | 0.023 |
| Osteoporosis (measured at Hip) | |||
| Normal | 5323 (55.4) | 210 (64.2) | |
| Low bone density | 3813 (39.7) | 107 (32.7) | |
| Osteoporosis | 478 (5.0) | 10 (3.1) | 0.005 |
| High Risk Gail Score | |||
| < 1.67% | 6258 (65.1) | 180 (55.1) | |
| ≥ 1.67% | 3356 (34.9) | 147 (45.0) | < 0.0001 |
| Continuous Variables | |||
| No Incident Breast Cancer mean (95% CI) | Incident Breast Cancer mean (95% CI) | P value | |
| BMI (kg/m2) | 28.2 (28.1, 28.3) | 29.0 (29.4, 29.7 | 0.014 |
| % Fat | 43.8 (43.7, 44.0) | 44.3(43.5, 45.1 | 0.270 |
| Total Energy Intake (kcal) | 1661.5 (1645.2, 1677.9) | 1676.4(1598.3, 1754.4) | 0.747 |
| METs per week | 11.4 (11.1, 11.7) | 11.3(9.9 12.7) | 0.905 |
| Years Since Menopause | 16.1 (15.9, 16.3) | 15.7 (14.6 16.8) | 0.527 |
Overall, osteoporosis was more common in women with a higher Gail score (p < 0.0001) (table 2). Hip BMD was inversely related to Gail score regardless of whether osteoporotic categories or continuous measures of BMD (T-score) were used. However, after controlling for age, the magnitude of this inverse relationship became much weaker (Table 3).
Table 2.
Percent of Women at High Risk of Breast Cancer by Osteoporosis
| Categories Osteoporosis Categories based on Hip T score* | Gail Score | Total | |
|---|---|---|---|
| Low Gail Score (< 1.67%) | High Gail Score (≥1.67%) | ||
| n = 6,438 | n = 3,503 | n = 9941 | |
| N (%) | N (%) | N (%) | |
| Normal | 3,862 (60.0) | 1,671 (47.6) | 5,533 (55.7) |
| Low BMD | 2,328 (36.1) | 1,592 (45.5) | 3,920 (39.4) |
| Osteoporosis | 248 (3.9) | 240 (6.9) | 488 (4.9) |
P <0.001 in Chi square test for difference in osteoporosis categories by Gail score group
Table 3.
Association between Hip T-score and Gail Score*
| Crude | Age-Adjusted | |||
|---|---|---|---|---|
| OR | 95% CI | OR | 95% CI | |
| Model 1 – Osteoporosis Category** | ||||
| Normal | Reference | -- | Reference | -- |
| Low bone density | 1.59 | 1.45, 1.72 | 1.09 | 1.00, 1.20 |
| Osteoporosis | 2.22 | 1.85, 2.68 | 1.05 | 0.86, 1.29 |
| Model 2 – Continuous Variable | ||||
| T-score | 0.76 | 0.73, 0.79 | 0.96 | 0.92, 1.01 |
Results from logistic regression predicting high risk Gail score (≥ 1.67%)
T-score < − 2.5 = osteoporosis, −1 to −2.5 = low bone density, > −1 = normal
The age-adjusted incident rate of breast cancer was 33.1 per 10,000 person-years for women with a low Gail score (< 1.67) and 47.8 per 10,000 person-years for women with a high Gail score (≥1.67). The age-adjusted incident rate of breast cancer was higher in women with a higher T-score: 45.5 per 10,000 person-years, 29.5 per 10,000 person-years, and 11.0 per 10,000 person-years respectively for women with a hip BMD T-score in the Normal, Low BMD, and Osteoporosis range. Table 4 shows the results from Cox proportional hazards models. Gail score and hip BMD (T-score) each was used separately as the predictor of incident breast cancer in model 1 or model 2 respectively. Model 3 included both Gail score and Hip BMD (T-score). Model 4 was built on Model 3 by including additional major risk factors for breast cancer (baseline BMI, race/ethnicity, baseline hormone use, education, smoking and alcohol consumption) in the multivariate model. In Model 4, the association between BMD, Gail score and incident breast cancer did not appreciably or significantly change, suggesting the relationships between BMD, Gail Score and incident breast cancer were not confounded by these known breast cancer risk factors.
Table 4.
Cox Proportional Hazards Models for Incident Breast Cancer
| HR | 95% CI | P- values | |
|---|---|---|---|
| Model 1: Gail Score | |||
| Gail score (≥1.67%) | 1.44 | 1.14, 1.83 | 0.002 |
| Model 2: Hip T-score | |||
| Hip T – score | 1.26 | 1.13, 1.39 | < 0.001 |
| Model 3: Gail & Hip T-score | |||
| Gail score (≥1.67%) | 1.47 | 1.17, 1.86 | 0.001 |
| Hip T-score | 1.26 | 1.14, 1.40 | < 0.001 |
| Model 4: Gail, Hip T-score & Covariates* | |||
| Gail score (≥1.67%) | 1.35 | 1.05, 1.73 | 0.02 |
| Hip T-score | 1.25 | 1.11, 1.40 | < 0.001 |
Adjusted for Ethnicity, BMI, Baseline Hormone Use, Education, Smoking, and Alcohol Consumption in the multivariate model.
Race/ethnicity and BMI did not significantly modify the prediction of BMD or Gail score for incident breast cancer. Hence none of the results reported in the following tables were stratified by these variables. Although we did not find significant interactions between the Gail score and BMD T-score for predicting breast cancer in the entire sample, a more detailed examination in Figure 1 suggests a slightly more complex story. For those below the median Gail score or below the median total hip BMD T-score, the breast cancer incidence rates are relatively flat, and do not indicate an interaction. Among those above the median on both measures, however, there is an interaction, in which high values on both measures are indicative of sharply increased breast cancer risk. When we restricted the analysis to women with both Gail score and hip T-score above the median, we indeed observed a significant interaction between Gail score and hip T-score (p= 0.002) in the Cox proportional hazards regression.
Figure 1.
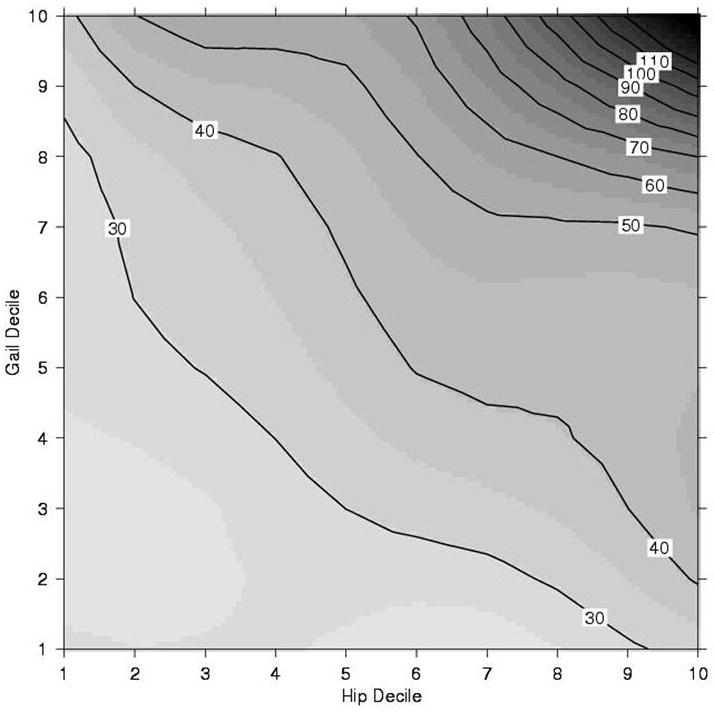
Contour Plot of Breast Cancer Incidence (per 10,000 Person Years) by Decile of Hip T Score and Gail Score
- Hip T –score decile = −2.19, −1.75, −1.43, −1.15, −0.87, −0.59, −0.28, 0.08, 0.57 (10th -90th percentiles, by 10, respectively)
- Gail score (%) decile = 0.75, 0.96, 1.13, 1.27, 1.42, 1.56, 1.78, 2.01, 2.68 (10th -90th percentiles, by 10, respectively)
- The numbers in the boxes (such as 30, 40…110) are the numbers of incidence breast cancer per 10,000 person-years.
Figure 2 is ROC analysis results for models 1–3 in table 4. The area under the curve for the Gail model and BMD model were 0.5502 and 0.5565 respectively, which were not significantly different from each other (P = 0.77). Including both BMD and Gail score in the same prediction model for predicting incident breast cancer only increased the area under the curve slightly to 0.5779, but the change from the Gail score alone model to both BMD and Gail score model is statistically significant (p = 0.049). Including additional covariates, the ROC area further increased to 0.62 with the 4th Model in table 4 (figure not shown).
Figure 2.
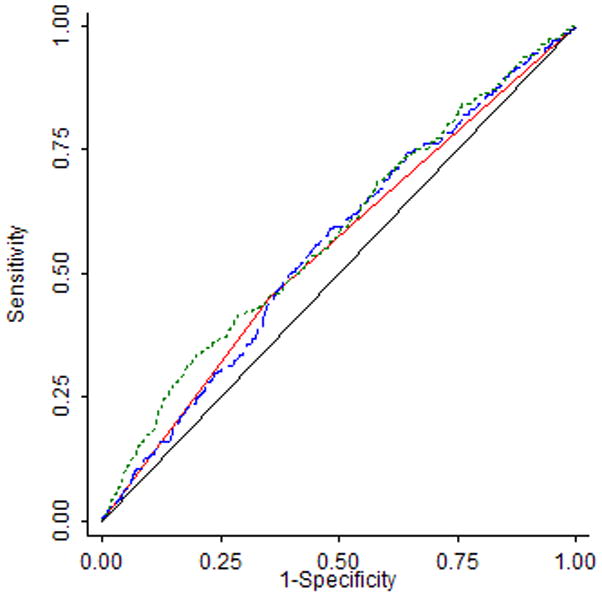
ROC for Predicting Incident Breast Cancer by Gail Score (Model 1), BMD (Model 2) and both Gail Score and BMD (Model 3)
 Gail score > 1.67 0.5502
 Hip T Score 0.5565
 Gail + Hip T Score 0.5779
 Reference
| Model | ROC | SE | P value* |
|---|---|---|---|
| Model 1 – Gail (≥ 1.67%) | 0.5502 | 0.0140 | |
| Model 2 – Hip T score | 0.5565 | 0.0159 | 0.7721 |
| Model 3 – Gail + Hip T score | 0.5779 | 0.0166 | 0.0490 |
Sensitivity analysis
When the above analyses were restricted to a subgroup with only white women or a subgroup with just the WHI-OS participants, the results were similar to findings from the entire sample. The number of incident breast cancers was only 35 in African Americans, and 17 in the Hispanic women, so stratified analyses were not conducted in the minority subgroups.
Discussion
This is the first study investigating the relationship between BMD, Gail score and breast cancer risk in a same cohort of postmenopausal women. The results from this prospective study show that BMD and Gail score are independent predictors for incident breast cancer in postmenopausal women. However, the relationship between Gail score and BMD with breast cancer may not be linear and women with both high BMD and Gail score may be at high risk for breast cancer. The observed inverse relationship between BMD and Gail score can be largely explained by age. This may be due to the fact that both osteoporosis (low bone density) and breast cancer (higher Gail score) risks increase in older women.
Since its first publication in 1989, the Gail model has by far been the most popular algorithm in breast cancer prediction in the United States and has contributed to breast cancer research and clinical management in a significant way. Considering other risk factors and ethnic variations, the Gail model has been tested and modified in many previous studies throughout the years.9, 14, 15 It is a general consensus that the prediction accuracy of the original Gail model is moderate at the population level. Based on the area under the curve, the prediction accuracy was low (ROC area = 0.55) in this current study. Most published studies reported ROC area of 0.6 or larger.14, 16, 17 One explanation of this lower prediction accuracy in the current study may be related to both the relatively small number of breast cancer cases and the diverse multiethnic cohort in this study. Indeed, after controlling for some selected characteristics of the women, such as BMI and race/ethnicity, the ROC area was improved to 0.62 in this study. The best published ROC area is only 0.6817, much less than the prediction models for other health outcomes, such as cardiovascular disease18 and osteoporosis.19
Results from this study confirm and extend the findings in a number of previously published large prospective studies, suggesting that postmenopausal women with high bone mass or bone mineral density were more likely to develop breast cancer in comparison to women with low BMD. 3, 6, 20, 21 More interestingly, we found that this relationship is independent from Gail score.. Previously the Study of Osteoporotic Fractures3 reported that among postmenopausal women in the U.S., those with BMD above the 25th percentile had a 2–2.5 fold increased risk of developing breast cancer compared with women with BMD below the 25th percentile. The underlying factors linking BMD with breast cancer may include body size and life-long estrogen exposures, as adjusting for current circulating estrogen level and BMI, the relationship between BMD and breast cancer disappeared.21 However, another study found that adjusting for BMI and lifetime ovulation did not completely explain the association between BMD and breast cancer risk.4 In our study, adjusting for BMI, baseline hormone use and a number of other variables did not significantly alter the relationship between BMD and breast cancer risk either. It must be pointed out that we did not have direct measurements on endogenous estrogen in our study, so residual confounding may exist in the analysis. In addition, the difference in the findings from previous studies may be due to the fact that the relationship between BMD and current circulating estrogen level is stronger than the relationship between BMD and lifetime ovulation (or baseline hormone use). Hence, adjusting for the later factors could not disassociate the connection between BMD and breast cancer risk.
Our results suggest that when BMD is available it is an attractive alternative measure in assessing breast cancer risk. Since BMD was similar to the Gail model in predicting breast cancer risk in our study, this information could be of additional use to women receiving DXA scanning for osteoporosis diagnosis, particularly if this finding can be confirmed by other cohort studies. Clinicians and researchers would then be able to identify a group of women at high risk for breast cancer using multiple approaches, such as Gail score, BMD or breast density as suggested by another investigation.17 Our results and Tice’s study17 both indicated that even when Gail score is available, adding other variables, such as BMD or breast density may still significantly improve the prediction of the models.
The interrelationships between Gail score, BMD and breast cancer risk were not significantly confounded by BMI, race/ethnicity, baseline hormone use, or physical activity. However, considering these factors may enhance the prediction. Whether the prediction for breast cancer can be significantly improved by including breast density measures in the BMD and Gail combined model is an interesting question for future research.
We did not observe any significant effect modification by race/ethnicity, or BMI on the relationship between BMD, Gail score and incident breast cancer. However, due to the small number of breast cancer cases in the minority groups, these questions should be tested in other studies with larger number of minority breast cancer cases. The other limitations of this study include healthy volunteer phenomena. WHI study is not a population-based study and the women who are willing to participate in a long cohort study may be healthier than the general population. Therefore whether our finding is generilizable to other populations will need to be found out in future studies. Since this study used information from the WHI, the data collection is restricted by the WHI study design. So, there may be residual confounding from either unmeasured variables (such as genetic factors and life time estrogen exposure) or measurement errors in the covariates (such as baseline hormone use) that were included in the models.
Women with both very high Gail score and BMD are at exceptional high risk for breast cancer in this study. However, the interaction between the Gail score and BMD T-score is confined to the higher risk groups on both measures. Since the number of women in the doubly-higher risk category is relatively small, the statistical interaction analysis in the entire sample may be mainly driven by the women with low to average Gail score or BMD, and so significant interactions of BMD and Gail score were not detected there. Only a large cohort, such as WHI, allows investigating these associations in the extreme group of women, and this intriguing finding would be missed in smaller studies. Cautions should be given to intemperate this finding since it was derived from a post hoc analysis and needs to be confirmed by other studies.
There are number of major strengths in this study, such as the prospective study design and adjudicated incident breast cancer cases. In addition, this study also benefits from the comprehensive measurements of BMD using a state-of -the-art technique and the availability of measurements on many risk factors for breast cancer. However, due to the large number of incident cases from white women, the study results are likely driven by white women and this is a limitation of this study. Whether there is any effect modification of race/ethnicity on the relationship between Gail score, BMD and breast cancer needs further investigation.
In conclusion, the association between BMD and incident breast cancer is independent from Gail score. Hip BMD and Gail score were similar in predicting incident breast cancer. Using both BMD and Gail score together may improve the performance of the prediction model on incident breast cancer in postmenopausal women, but the gain in accuracy of the prediction is small. The prediction model seems most applicable to the women with both extremely high Gail score and BMD. Future studies should investigate whether incorporating BMD and Gail score with other risk factors, such as breast density, can further improving the identification of women at high risk for developing breast cancer.
Acknowledgments
Financial Support Information: The Women’s Health Initiative Program is supported by the National Heart, Lung and Blood Institute, U.S Department of Health and Human Services. This project was funded by Eli Lilly.
SHORT LIST OF WHI INVESTIGATORS
Program Office: (National Heart, Lung, and Blood Institute, Bethesda, Maryland) Elizabeth Nabel, Jacques Rossouw, Shari Ludlam, Linda Pottern, Joan McGowan, Leslie Ford, and Nancy Geller.
Clinical Coordinating Center: (Fred Hutchinson Cancer Research Center, Seattle, WA) Ross Prentice, Garnet Anderson, Andrea LaCroix, Charles L. Kooperberg, Ruth E. Patterson, Anne McTiernan; (Wake Forest University School of Medicine, Winston-Salem, NC) Sally Shumaker; (Medical Research Labs, Highland Heights, KY) Evan Stein; (University of California at San Francisco, San Francisco, CA) Steven Cummings.
Clinical Centers: (Albert Einstein College of Medicine, Bronx, NY) Sylvia Wassertheil-Smoller; (Baylor College of Medicine, Houston, TX) Jennifer Hays; (Brigham and Women’s Hospital, Harvard Medical School, Boston, MA) JoAnn Manson; (Brown University, Providence, RI) Annlouise R. Assaf; (Emory University, Atlanta, GA) Lawrence Phillips; (Fred Hutchinson Cancer Research Center, Seattle, WA) Shirley Beresford; (George Washington University Medical Center, Washington, DC) Judith Hsia; (Los Angeles Biomedical Research Institute at Harbor- UCLA Medical Center, Torrance, CA) Rowan Chlebowski; (Kaiser Permanente Center for Health Research, Portland, OR) Evelyn Whitlock; (Kaiser Permanente Division of Research, Oakland, CA) Bette Caan; (Medical College of Wisconsin, Milwaukee, WI) Jane Morley Kotchen; (MedStar Research Institute/Howard University, Washington, DC) Barbara V. Howard; (Northwestern University, Chicago/Evanston, IL) Linda Van Horn; (Rush Medical Center, Chicago, IL) Henry Black; (Stanford Prevention Research Center, Stanford, CA) Marcia L. Stefanick; (State University of New York at Stony Brook, Stony Brook, NY) Dorothy Lane; (The Ohio State University, Columbus, OH) Rebecca Jackson; (University of Alabama at Birmingham, Birmingham, AL) Cora E. Lewis; (University of Arizona, Tucson/Phoenix, AZ) Tamsen Bassford; (University at Buffalo, Buffalo, NY) Jean Wactawski-Wende; (University of California at Davis, Sacramento, CA) John Robbins; (University of California at Irvine, CA) F. Allan Hubbell; (University of California at Los Angeles, Los Angeles, CA) Howard Judd; (University of California at San Diego, LaJolla/Chula Vista, CA) Robert D. Langer; (University of Cincinnati, Cincinnati, OH) Margery Gass; (University of Florida, Gainesville/Jacksonville, FL) Marian Limacher; (University of Hawaii, Honolulu, HI) David Curb; (University of Iowa, Iowa City/Davenport, IA) Robert Wallace; (University of Massachusetts/Fallon Clinic, Worcester, MA) Judith Ockene; (University of Medicine and Dentistry of New Jersey, Newark, NJ) Norman Lasser; (University of Miami, Miami, FL) Mary Jo O’Sullivan; (University of Minnesota, Minneapolis, MN) Karen Margolis; (University of Nevada, Reno, NV) Robert Brunner; (University of North Carolina, Chapel Hill, NC) Gerardo Heiss; (University of Pittsburgh, Pittsburgh, PA) Lewis Kuller; (University of Tennessee, Memphis, TN) Karen C. Johnson; (University of Texas Health Science Center, San Antonio, TX) Robert Brzyski; (University of Wisconsin, Madison, WI) Gloria E. Sarto; (Wake Forest University School of Medicine, Winston-Salem, NC) Denise Bonds; (Wayne State University School of Medicine/Hutzel Hospital, Detroit, MI) Susan Hendrix.
References
- 1.Chlebowski RT, Col N, Winer EP, et al. American Society of Clinical Oncology technology assessment of pharmacologic interventions for breast cancer risk reduction including tamoxifen, raloxifene, and aromatase inhibition. J Clin Oncol. 2002 Aug 1;20(15):3328–3343. doi: 10.1200/JCO.2002.06.029. [DOI] [PubMed] [Google Scholar]
- 2.Freedman AN, Seminara D, Gail MH, et al. Cancer risk prediction models: a workshop on development, evaluation, and application. J Natl Cancer Inst. 2005 May 18;97(10):715–723. doi: 10.1093/jnci/dji128. [DOI] [PubMed] [Google Scholar]
- 3.Cauley JA, Lucas FL, Kuller LH, Vogt MT, Browner WS, Cummings SR. Bone mineral density and risk of breast cancer in older women: the study of osteoporotic fractures. Study of Osteoporotic Fractures Research Group. Jama. 1996 Nov 6;276(17):1404–1408. [PubMed] [Google Scholar]
- 4.Nguyen TV, Center JR, Eisman JA. Association between breast cancer and bone mineral density: the Dubbo Osteoporosis Epidemiology Study. Maturitas. 2000 Jul 31;36(1):27–34. doi: 10.1016/s0378-5122(00)00133-x. [DOI] [PubMed] [Google Scholar]
- 5.van der Klift M, de Laet CE, Coebergh JW, Hofman A, Pols HA. Bone mineral density and the risk of breast cancer: the Rotterdam Study. Bone. 2003 Mar;32(3):211–216. doi: 10.1016/s8756-3282(02)00972-9. [DOI] [PubMed] [Google Scholar]
- 6.Zhang Y, Kiel DP, Kreger BE, et al. Bone mass and the risk of breast cancer among postmenopausal women. N Engl J Med. 1997 Feb 27;336(9):611–617. doi: 10.1056/NEJM199702273360903. [DOI] [PubMed] [Google Scholar]
- 7.Kerlikowske K, Shepherd J, Creasman J, Tice JA, Ziv E, Cummings SR. Are breast density and bone mineral density independent risk factors for breast cancer? J Natl Cancer Inst. 2005 Mar 2;97(5):368–374. doi: 10.1093/jnci/dji056. [DOI] [PubMed] [Google Scholar]
- 8.Gail MH, Brinton LA, Byar DP, et al. Projecting individualized probabilities of developing breast cancer for white females who are being examined annually. J Natl Cancer Inst. 1989 Dec 20;81(24):1879–1886. doi: 10.1093/jnci/81.24.1879. [DOI] [PubMed] [Google Scholar]
- 9.Costantino JP, Gail MH, Pee D, et al. Validation studies for models projecting the risk of invasive and total breast cancer incidence. J Natl Cancer Inst. 1999 Sep 15;91(18):1541–1548. doi: 10.1093/jnci/91.18.1541. [DOI] [PubMed] [Google Scholar]
- 10.Anderson GL, Manson J, Wallace R, et al. Implementation of the Women’s Health Initiative study design. Annals of Epidemiology. 2003 Oct;13(9 Suppl):S5–17. doi: 10.1016/s1047-2797(03)00043-7. [DOI] [PubMed] [Google Scholar]
- 11.Hays J, Hunt JR, Hubbell FA, et al. The Women’s Health Initiative recruitment methods and results. Annals of Epidemiology. 2003 Oct;13(9 Suppl):S18–77. doi: 10.1016/s1047-2797(03)00042-5. [DOI] [PubMed] [Google Scholar]
- 12.SEER Program code manual. Washington DC: Cancer Statistics Branch, Surveillance Program, Division of Cancer Prevention and Control, National Cancer Institute. US Department of Health and Human Services Public Health Service, National Institutes of Health; Jun, 1992. NIH Publ No92–1999. [Google Scholar]
- 13.SEER program: Comparative staging guide for cancer. Version1.1. Washington DC: U.S Department of Health and Human Services, National Institutes of Health; Jun, 1993. Report No: NIH Publ No93–3640. [Google Scholar]
- 14.Rockhill B, Spiegelman D, Byrne C, Hunter DJ, Colditz GA. Validation of the Gail et al. model of breast cancer risk prediction and implications for chemoprevention. J Natl Cancer Inst. 2001 Mar 7;93(5):358–366. doi: 10.1093/jnci/93.5.358. [DOI] [PubMed] [Google Scholar]
- 15.Spiegelman D, Colditz GA, Hunter D, Hertzmark E. Validation of the Gail et al. model for predicting individual breast cancer risk. J Natl Cancer Inst. 1994 Apr 20;86(8):600–607. doi: 10.1093/jnci/86.8.600. [DOI] [PubMed] [Google Scholar]
- 16.Chen J, Pee D, Ayyagari R, et al. Projecting absolute invasive breast cancer risk in white women with a model that includes mammographic density. J Natl Cancer Inst. 2006 Sep 6;98(17):1215–1226. doi: 10.1093/jnci/djj332. [DOI] [PubMed] [Google Scholar]
- 17.Tice JA, Cummings SR, Ziv E, Kerlikowske K. Mammographic breast density and the gail model for breast cancer risk prediction in a screening population. Breast Cancer Res Treat. 2005 Nov;94(2):115–122. doi: 10.1007/s10549-005-5152-4. [DOI] [PubMed] [Google Scholar]
- 18.Liao Y, McGee DL, Cooper RS, Sutkowski MB. How generalizable are coronary risk prediction models? Comparison of Framingham and two national cohorts. Am Heart J. 1999 May;137(5):837–845. doi: 10.1016/s0002-8703(99)70407-2. [DOI] [PubMed] [Google Scholar]
- 19.Robbins J, Aragaki A, Kooperberg C, et al. Factors Associated with Five Year Risk of Hip Fracture in Postmenopausal Women: From the Women’s Health Initiative. Submitted to JAMA. 2007 doi: 10.1001/jama.298.20.2389. [DOI] [PubMed] [Google Scholar]
- 20.Buist DS, LaCroix AZ, Barlow WE, White E, Weiss NS. Bone mineral density and breast cancer risk in postmenopausal women. J Clin Epidemiol. 2001 Apr;54(4):417–422. doi: 10.1016/s0895-4356(00)00301-2. [DOI] [PubMed] [Google Scholar]
- 21.Buist DS, LaCroix AZ, Barlow WE, et al. Bone mineral density and endogenous hormones and risk of breast cancer in postmenopausal women (United States) Cancer Causes Control. 2001 Apr;12(3):213–222. doi: 10.1023/a:1011231106772. [DOI] [PubMed] [Google Scholar]