Abstract
This paper presents a new imaging method based on the classical Hall effect (HE), which describes the origin of a detectable voltage from a conductive object moving in a magnetic field. HE images are formed using ultrasound imaging techniques in a magnetic field. These images reflect the electrical properties of the sample. To demonstrate the feasibility of this method, images of plastic and biological samples are collected. The contrast mechanism and signal-to-noise issues are discussed. Since electrical parameters vary widely among tissue types and pathological states, HE imaging may be a useful tool for biological research and medical diagnosis.
Index Terms: Biomedical, characterization, conductivity, diagnostic, dielectric, electric, Hall, imaging, magnetic, tissue, ultrasound
I. INTRODUCTION
Herein is described a method of imaging a material’s electrical and mechanical properties using the classical Hall effect (HE). The classical HE describes the charge separation phenomenon in a conductive object moving in a magnetic field [1]. This charge separation is the result of the opposing Lorentz forces on the positive and negative charges, and leads to an externally detectable voltage, the Hall voltage. The Hall voltage amplitude is determined by the strength of the Lorentz force and the charge density and mobility. The Lorentz force is proportional to the magnetic field B0 and the velocity of motion ν, while the charge density and mobility are characterized by the overall conductivity σ of the object, including the dielectric contribution. Thus, the Hall voltage Vh α σνB0.
To create a HE image, spatial information must be encoded in Vh. An effective method to achieve this is to use an ultrasound pulse to localize motion and, therefore, Vh, to specific regions in the sample. An ultrasound pulse produces a localized packet of acoustic vibration that propagates through the sample. This vibration generates a Hall voltage which tracks the progression of the wave packet. The time record of the Hall voltage constitutes a one-dimensional (1-D) profile along the ultrasound path. Thus, instead of monitoring the time course of the reflected acoustic signal, as is done in echo ultrasound imaging, one uses the Hall voltage to construct an image weighted by the HE. This image contains information on the conductivity σ as well as the acoustic parameters affecting ν. Since spatial information in Hall effect imaging (HEI) is encoded in the time domain similar to conventional ultrasound, the same methods of image reconstruction apply.
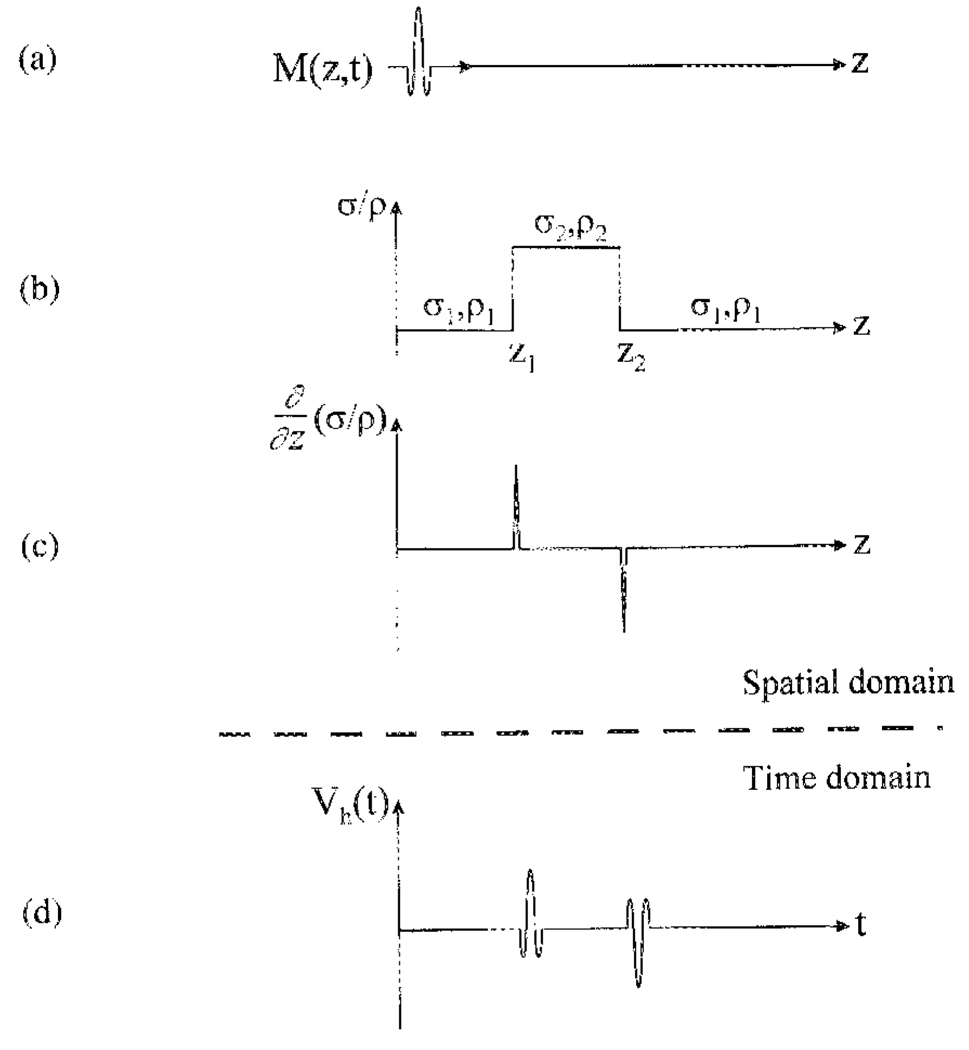
To illustrate the dependence of the Hall voltage on the electrical and acoustic properties of the sample, consider a 1-D example (Fig. 1). An ultrasound transducer generates a longitudinal wave packet along the “Z” axis perpendicular to the magnetic field B0 [Fig. l(a)]. A step change in conductivity σ and mass density ρ occurs between positions z1 and z2 [Fig. l(b)]. If the velocity of the ultrasound vibration at position z and time t is ν(z, t), a charge q at that position experiences a Lorentz force qν(z,t)B0. This force is equivalent to that of an electric field ν(z, t)B0, which in turn establishes a current density σ(z)ν(z, t)B0 in the sample. The net current derives from integrating this over the ultrasound beam width W and the ultrasound path
| (1) |
Fig. 1.
Relation between the Hall voltage and the σ/ρ gradient in a sample. (a) The ultrasound wave packet propagates along the Z axis, carrying the momentum M(z, t). (b) The conductivity σ and mass density ρ in the sample has a step change between z1 and z2. (c) The abrupt changes of σ/ρ at z1 and z2 results in two peaks of opposite sign in the σ/ρ gradient, (d) The Hall voltage Vh is a convolution of the ultrasound momentum M(z, t) with the σ/ρ gradient (3). Thus, Vh has two peaks of opposite polarity corresponding to the two interfaces.
If a portion α of the current is collected by electrodes into a detection circuit of impedance Rd, the detected Hall voltage Vh(t) is then
| (2) |
Using the equation of wave propagation, the Hall voltage can be expressed in terms of the ultrasound momentum M(z, t) and the spatial gradient of σ/ρ (see Appendix)
| (3) |
In applying (3) to the example above, the gradient of σ/ρ is nonzero only at the interfaces z1 and z2 [Fig. l(c)]. The ultrasound momentum M(z, t) is carried by the wave packet as it travels along the Z axis. When the packet passes the two interfaces successively, the integrand in (3) becomes nonzero, giving rise to a Hall voltage. Thus, the time course of the Hall voltage contains two peaks representing the two interfaces [Fig. l(d)]. The time of each peak marks the position of its corresponding interface. The polarity of the two peaks are opposite, because the σ/ρ gradient at z1 and z2 are in opposite directions. In this fashion HEI converts spatial information into the time domain much like conventional echo ultrasound. Many methods used in echo ultrasound to collect two-dimensional (2-D) or three-dimensional (3-D) images, such as line scan and phased-array detection, also apply to HEI. Similarly, motion measurements based on Doppler effect in echo ultrasound can be readily implemented in HEI.
II. EXPERIMENTAL METHODS
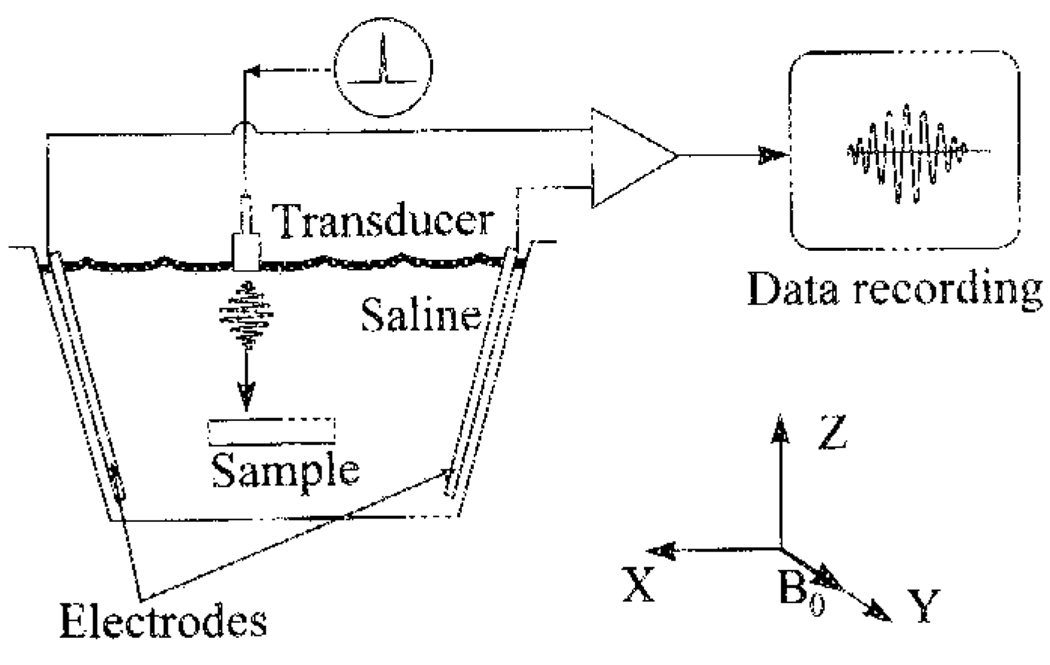
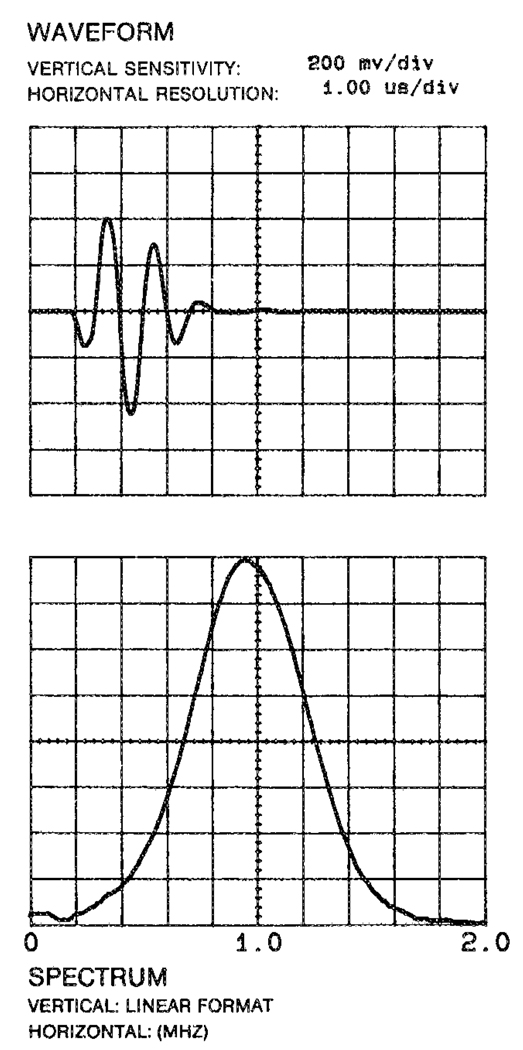
To demonstrate the feasibility of HEI, a simple device was constructed to form cross-sectional images containing an object suspended in a plastic chamber of saline solution, placed in the field of a 4-T magnet (Fig. 2). The chamber was filled with 0.4% NaCl solution. A rectangular polycarbonate block (cross section 6.0 cm × 1.2 cm) was immersed in the saline. The magnetic field B0 was in the “Y” direction. A piezoelectric transducer (Panametric V314) emitted longitudinal ultrasound waves, with both the wave vector and the physical vibration in the “Z” direction. The transducer was nonfocused (planar), with a nominal element size of 1.9 cm and a 6-dB bandwidth of 0.60 MHz. Its spectral characteristics and pulse shape are shown in Fig. 3. The transducer was driven with a 500-V unipolar pulse of 150 µs nominal pulse width (Panametric pulser model 5058PR). The Lorentz force from the ultrasonic vibration was in the “X” direction, and the resulting Hall voltage was detected with electrodes placed in the chamber. Preamplification was realized with a 60-dB broadband (10 kHz–10 MHz) low-noise preamplifier (Miteq). After a passive bandpass filter and another 30-dB gain, the signal was recorded with a PC-based digital oscilloscope (Gage Model 1012).
Fig. 2.
Diagram of the experiment to image with HEI a sample immersed in a saline chamber. The dimensions of the chamber are 27 cm (X dimension) × 17 cm (Y)× 22 cm (Z). The electrodes are two exposed copper wire segments. The piezoelectric ultrasound transducer has a center frequency of 1 MHz, and a 6-dB bandwidth of 0.6 MHz. An electrical pulser inputs single-phase electrical pulses of approximately 0.15-µs duration into the transducer, which in turn emits ultrasound pressure pulses into the chamber. The Hall voltage is amplified by 60-dB gain, filtered by a 0.1–3-MHz bandpass filter, and digitized at 5 megasample/s for data storage.
Fig. 3.
The response spectrum and pulse shape of the ultrasound transducer used in the HEI experiments.
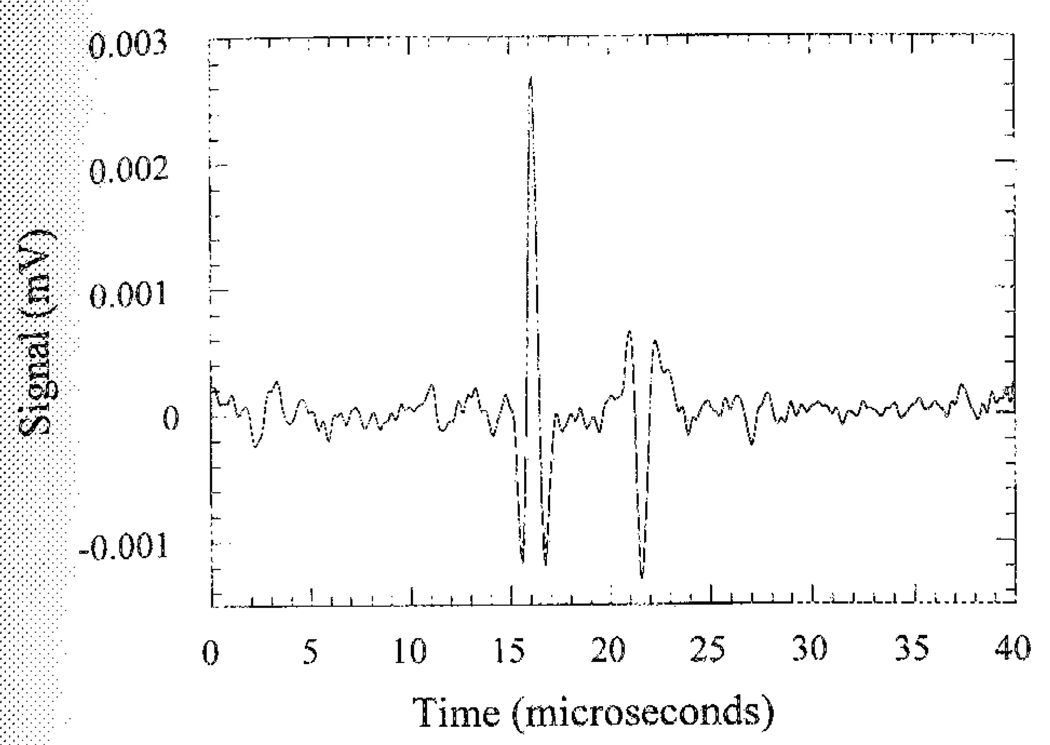
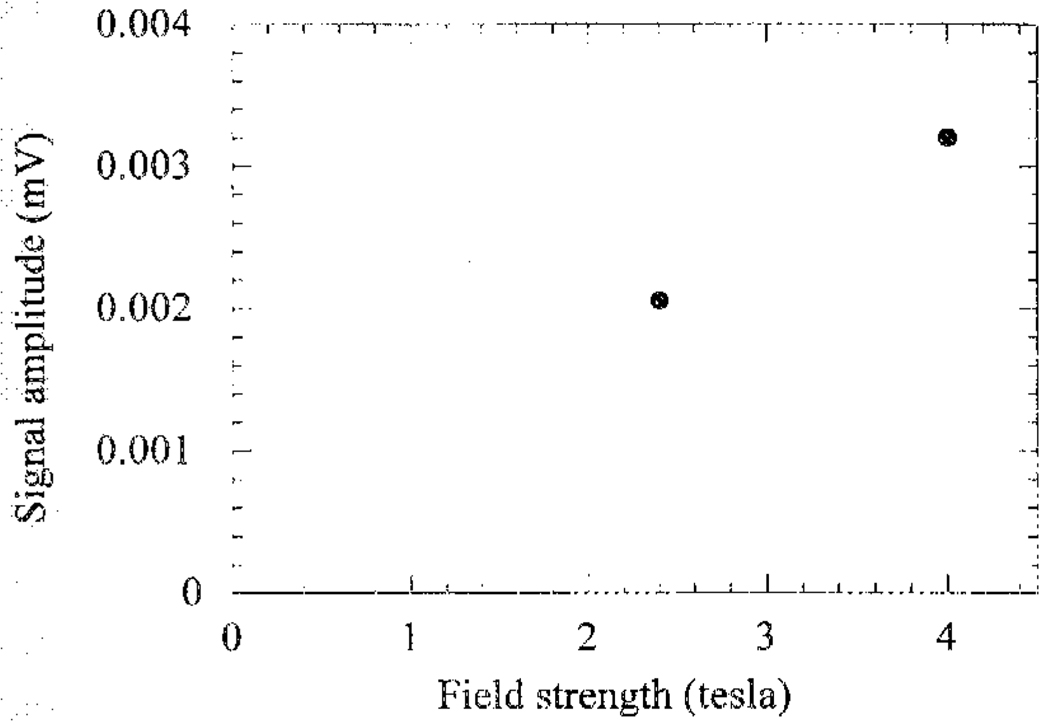
Immediately after the onset of the ultrasound pulse, the Hall voltage was recorded for up to 100 µs (Fig. 4), the time required for the ultrasound wave packet to traverse the chamber. The two peaks in the time trace represent the upper and lower surfaces of the polycarbonate block. The amplitude of the second peak is lower than the first peak due to attenuation and acoustic reflection at the upper surface. As described in (3), the opposite polarity of the peaks resulted from the opposite σ/ρ gradient at the two interfaces. Assuming the ultrasound wave is planar in the region of the block, the ratio between the amplitudes of the two peaks can be calculated based on the mechanical constants of polycarbonate (speed of sound 2270 m/s, density 1.2 × 10³ kg/m3, attenuation approximately 1 dB/cm at 1 MHz). The estimated ratio is 0.60, in rough agreement with the measured value of 0.51. Also according to (3), the Hall voltage is proportional to the magnetic-field strength. This is demonstrated in Fig. 5, where the signal amplitude measured at 2.4 and 4 T are plotted versus field strength.
Fig. 4.
A Hall voltage time trace collected from a rectangular polycarbonate block immersed in saline. The two peaks represent the upper and lower surfaces of the block.
Fig. 5.
The amplitude of the first peak in Fig. 3 versus the magnetic-field strength, measured at 4.0 and 2.4 T. The different field strengths were achieved by moving the saline chamber within the bore of the magnet.
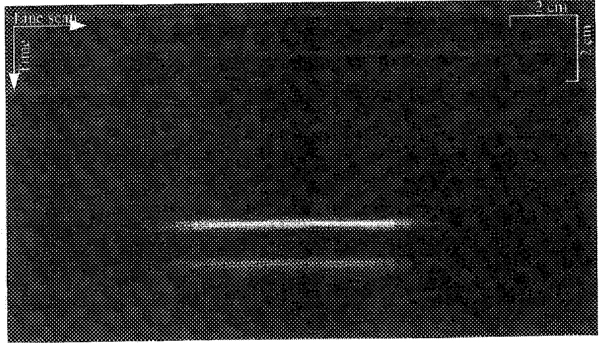
A 2-D image was formed with the line-scan method by moving the transducer in 0.5-cm increments across the chamber, while recording the time course of the Hall voltage at each position. These traces were displayed side-by-side in grey scale after a magnitude calculation, to form a 2-D image. Fig. 6 shows such an image of the polycarbonate block. The interfaces between the block and the saline solution are readily observed.
Fig 6.
An HE image of a polycarbonate block immersed in saline after magnitude calculation. The time axis is in the vertical direction and the horizontal axis is scanned by moving the ultrasound transducer across the chamber at 0.5-cm intervals.
The method described above is the voltage detection method of HEI. Based on the reciprocity relation of a linear electro-mechanical system [2], HEI can also be carried out in the reverse. In the reverse mode, or ultrasound detection mode, the pulser that was used to drive the ultrasound transducer is now connected to the pair of electrodes that were used to detect the Hall voltage in the forward mode, and the signal-sensing electronics are connected to the transducer. When the pulser generates a voltage pulse across the electrodes, an electric field is setup in the chamber. Any location in the chamber responds to the local electric field with a current density proportional to the local apparent conductivity. At interfaces of changing conductivity the current density becomes discontinuous, and so are the Lorentz forces on the currents. The discontinuities of the Lorentz forces result in ultrasound pulses emanating from these interfaces. These pulses are then received by the ultrasound transducer if they fall within its beam profile, thus, giving lateral spatial resolution. Axial spatial resolution is represented by the times of arrival of the pulses. Physically, the driving electric field between the electrodes in the reverse mode corresponds to the sensitivity profile of these electrodes as Hall voltage detectors in the forward mode; the process by which the currents in the chamber give rise to ultrasound pulses in the reverse mode corresponds to the conversion from ultrasound vibration to Hall currents in the forward mode; the propagation of ultrasound pulses to the transducer in the reverse mode corresponds to the propagation of the driving ultrasound pulse from the transducer into the chamber in the forward mode. Theoretically, these two modes are reciprocal to each other in a linear system, therefore, they produce the same images.
The ultrasound detection method does have some practical advantages over the voltage detection mode. It is less prone to electromagnetic interference in the environment, since the signal is acoustic and the level of external acoustic noise in the MHz range is usually low. Ultrasound detection also enables the use of phased-array transducers and fast 2-D or 3-D image formation.
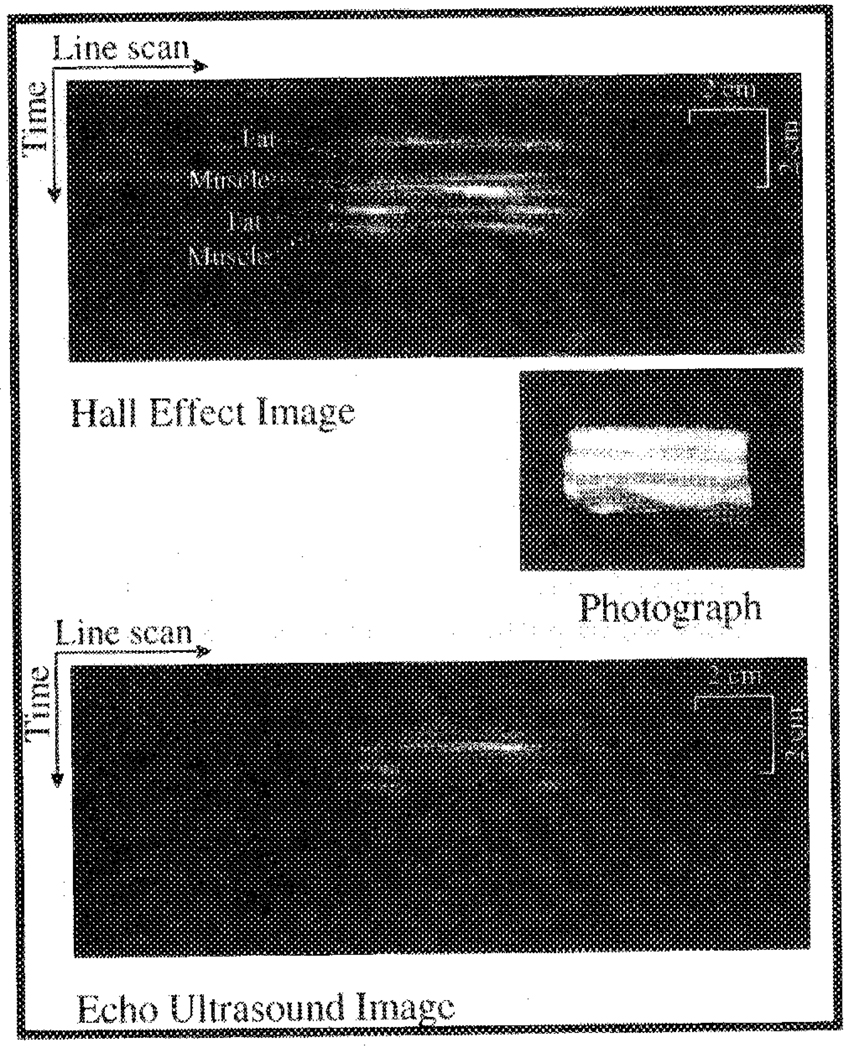
The ultrasound detection method was used to image a slab of bacon, with the same saline chamber, electrodes, and transducer described above. The high-voltage pulser was connected to the electrodes, while the signal amplification and receiving electronics were connected to the transducer. Bacon was chosen as an example of a biological structure since it has layers of high (muscle)- and low (fat)- conductivity soft tissue. The HE image of a cross section of the bacon block is shown in Fig. 7, along with a photograph and an echo ultrasound image generated using the same transducer and line scan procedure. Because the same instrumentation was used to collect both images, the difference between them can be attributed to the different imaging methods. In comparison, HEI depicts the soft tissue interfaces between the fat and muscle layers better than echo ultrasound because of the significant changes in conductivity among the layers.
Fig. 7.
A photograph of the cross section of a block of bacon, an image of the bacon collected with HEI, and an echo ultrasound image of the same cross section. The layers of fat and muscle are better differentiated in the HE image in comparison to the echo image.
III. DISCUSSION
As shown in Section I, the contrast of HE images reflects the density-weighted apparent conductivity of the material. However, the images do not give absolute measurements of the conductivity, since the Hall signal is also weighted by several other factors, including the ultrasound field profile of the transducer, the electric field profile between the electrodes, and the orientation of the magnetic field. In complex objects, such as biological samples, knowledge about these factors are often limited, thus, HEI can only provide information about the phase or sometimes the relative amplitude of conductivity changes across interfaces. The apparent conductivity of biological tissues at ultrasound frequencies span from mostly resistive (blood) to mostly dielectric (fat) [3], thus, the signal phase of HE images may contain meaningful information.
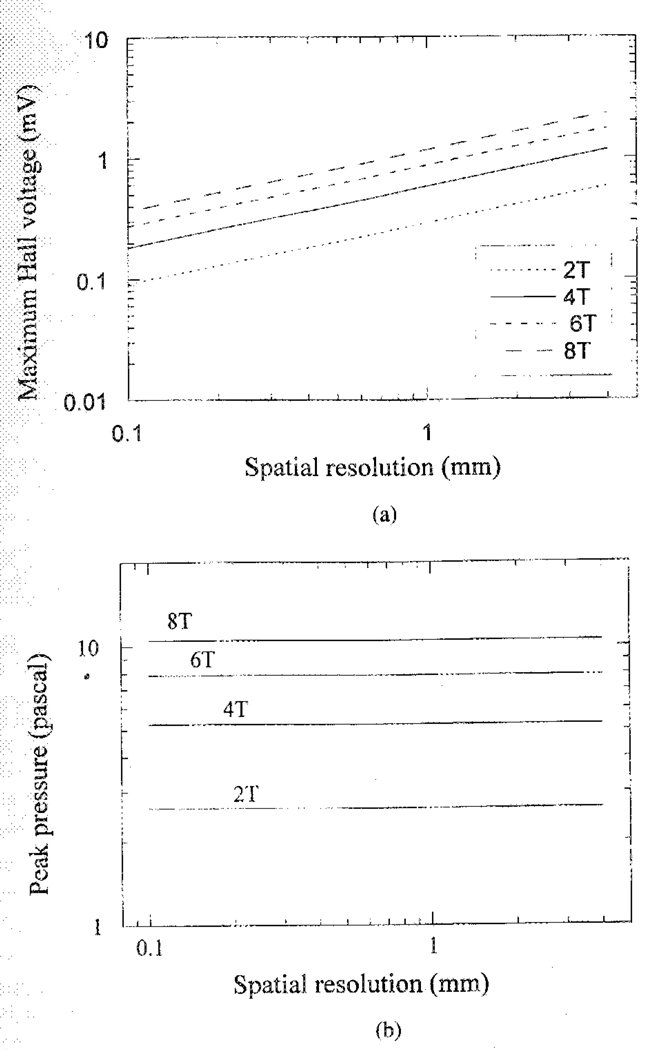
Although the forward and reverse modes produce the same images, their sensitivity and spatial resolution are determined by two different sets of parameters. In the Hall voltage detection mode, the limiting factor is the ultrasound pulse intensity, which in biological structures must not exceed the cavitation threshold. The cavitation threshold for soft tissue has been established empirically as the ratio (peak pressure)2/(ultrasound frequency) ~0.5 (MPa2/MHz) [4], [5]. Based on this index an estimate of the maximum Hall voltage from a muscle-fat interface can be made for the line scan method. Using (3), assuming that the width of the ultrasound beam W = 1 cm, the current collection factor α = 100%, Rd = 50 Ω, the maximum Hall voltage for a range-of-field strength and spatial resolution is estimated in Fig. 8(a). This voltage is on the order of 1 mV. In practice, the signal level is lower because the ultrasound pressure is below the cavitation threshold, the detection electrodes are usually remote from the scanned region, and the ultrasound beam may not be perpendicular to the magnetic field. In the polycarbonate block experiment (axial resolution 2 mm, beam width approximately 2.5 cm from the nominal size of the transducer) the measured Hall voltage was about 10−3 of its theoretical maximum. Several factors contributed to the low signal level: from the available parameters of common PZT materials, the ultrasound pulse from the transducer was estimated to be below one-tenth of the cavitation threshold; the electrodes were relatively far from the sample and, therefore, could only collect a fraction of the HE currents. In the forward mode the thermal noise level is determined by the impedance across the electrodes. In the experiments above the impedance was approximately 60 Ω. The noise level at 1-MHz bandwidth and room temperature was 1-µV rms. For application on human or animal body, the electrical impedance is on the same order or slightly higher, depending on the electrode geometry, the noise level should be comparable. Signal averaging over multiple acquisitions may be used to improve the signal-to-noise ratio (SNR). In biomedical imaging this is applicable when acquiring 1-D profiles or 2-D images with phased-array detection, since each scan is on the order of 200 µs or less, and the required frame rate is often less than 50 frames/s (20 ms/frame). Physiological motions such as heartbeat and blood flow induce Hall voltages in the DC ~ 100-Hz range, therefore, they do not contribute to the noise in HEI (MHz).
Fig. 8.
Sensitivity of the voltage detection and ultrasound detection modes of HEI, illustrated by the signal from a muscle-fat interface. (a) Maximum Hall voltage versus spatial resolution from a fat-muscle interface in the voltage detection mode of HEI, for different magnetic field strengths. These estimates are based on cavitation thresholds in soft tissue. (b) Maximum ultrasound pressure versus spatial resolution from a fat-muscle interface in the ultrasound detection mode, based on sensory-nerve-stimulation thresholds.
In the ultrasound detection mode of HEI, the limit on sensitivity is the maximum current allowed in the object. In biological tissue the threshold is set by nerve stimulation. The duration of the electrical impulse determines the length of the ultrasound pulse it produces, and, therefore, the spatial resolution of the image. To achieve millimeter or higher resolution, the pulse duration must be on the order of a microsecond, or one-hundredth the strength-duration time constant of human sensory and muscular nerves [6]. In this short time limit, the nerve-stimulation threshold is established as the product (electric field) × (pulse duration) ~ 2 × 10⁻³ Vs/m [7]. Based on this index, the peak pressure of the ultrasound signal from a fat-muscle interface can be estimated for a range of B0 and spatial resolution. In the millimeter resolution range the peak pressure was found to be on the order of 5 pascal, and dependent only on B0 [Fig. 8(b)]. In practice, the signal level is further reduced by acoustic scattering and attenuation. The intrinsic noise level can be calculated based on the thermal distribution of phonons in the sample. In water-like samples at room temperature, the rms noise level for 1-MHz bandwidth centered at 3 MHz is 0.16 pascal/radian)1/2. One way to improve the SNR without causing nerve stimulation is to use bipolar excitation pulses, e.g., a complete sine wave cycle. For in vivo applications signal averaging may be necessary to achieve sufficient sensitivity.
In biomedical imaging ultrasound has been very effective, although it has inherent difficulties in differentiating soft tissue, since muscle, fat, and blood differ in their acoustic impedances by less than 10% [8]. In comparison, the conductivities of soft tissue at ultrasound frequencies range over a factor of four [9], while their mass densities are very similar. This enables HEI to differentiate soft tissue based mainly on conductivity differences. The acoustic path length in HEI is also half that of ultrasound, greatly reducing the acoustic attenuation and dispersion. These characteristics of HEI may potentially improve the penetration depth, tissue contrast, and characterization in an ultrasound exam.
With regard to new diagnostic information, the electrical constants of tissue reflect their physiological state, such as water content and adiposity [9], [10]. It has been shown that tumors and especially necrotic regions have up to ten times higher conductivity than normal tissue [11], providing a good contrast mechanism in HEI.
Toward future applications, real-time imaging would require a high magnetic field in the region to be scanned. This field does not require the high homogeneity and stability necessary in magnetic resonance imaging (MRI), allowing greater flexibility in design and decreasing the cost of the magnets. With the use of high-field MRI scanners and open architecture, it is also conceivable that HEI could be added to provide complementary diagnostic information. With regard to transducers, fiberoptic ultrasonic sensors [12]—[14], and photoacoustic transducers [14], [15] could be the basis for high-sensitivity sensors and efficient transmitters which are not affected by the magnetic field, and immune to any electromagnetic interference. With the development of working ultrasound array sensors, it is conceivable that HEI be used for mammography or imaging of skin and subcutaneous structures, where it is relatively easy to arrange the magnet, the electrodes, and the ultrasound sensors, and the entire device can be relatively compact.
Besides real-time applications, the microscopy form of HEI, in conjunction with atomic-force microscopy techniques, may be feasible for biological sciences as well as material sciences. Here, shear wave is likely to be the motion of choice since the wave length is much shorter for a given frequency, yielding higher spatial resolution.
IV. CONCLUSION
It has been demonstrated that an imaging method using the classical HE is able to form images of the internal structure of an object based on the apparent conductivity distribution. Images of plastic phantoms and tissue samples are collected with this method. Their contrast and signal dependence on the magnetic-field strength are in agreement with theoretical calculations. The basic idea can be implemented in two modes, the voltage detection mode and the ultrasound detection mode. Spatial resolution and SNR are analyzed for the two modes. This imaging method may potentially be a useful tool for medical diagnostics and biological research, there are many possibilities of specific imaging devices based on the idea. The conductivity-related contrast may provide new information about the physiological processes of the body, and may also be useful in other areas of noninvasive testing such as material and geological sciences.
Biographies
Han Wen received the Ph.D. degree in biophysics at the University of Maryland, College Park, in 1994.
Currently a staff fellow at the Laboratory of Cardiac Energetics, National Heart, Lung and Blood Institute, his research areas include magnetic resonance imaging, fiberoptic ultrasound and electric-field sensors, and new imaging methods.

Jatin Shah received the B.S. degree in mechanical engineering at the Ohio State University. Columbus, in 1997. He is currently enrolled in the College of Medicine of the Ohio State University.
Robert S. Balaban received the Ph.D. degree in physiology and pharmacology at Duke University Durham. NC, in 1979.
He was NATO Fellow at University of Oxford, Oxford, U.K., 1980–1981 in Biochemistry. He is currently Chief of the Laboratory of Cardiac Energetics, National Heart, Lung, and Blood Institute National Institutes of Health, Bethesda, MD.
APPENDIX
Denote the ultrasound pressure wave as p(z, t). Using the linear inviscid force equation
| (4) |
the Hall voltage in (2) can be expressed as
| (5) |
Integration by parts yields
| (6) |
where
| (7) |
is the ultrasound momentum transmitted across position z at time t. Practical ultrasound transducers emit little energy in the audio and DC frequency range. The lack of a DC component means that the net momentum of the wave packet is zero. Under this condition, it can be shown that the surface term in (6) is zero during the time the wave packet is somewhere within the ultrasound path. Hence, the Hall voltage can be expressed as in (3). This expression shows that a nonzero Hall voltage only comes from positions where a gradient of σ/ρ exists. This point can be visualized by observing the total HE current in (1), while following the progression of the ultrasound wave packet. When the wave packet is in a homogeneous region, the total current is proportional to the average vibration velocity in the packet (1), which is zero due to the absence of a DC component. When the wave packet passes an interface of different conductivities, the portion inside the high σ region contributes more current with the same velocity; thus, the integral in (1) is no longer zero. When the wave packet passes an interface of different mass densities, but no change in conductivity, the portion in the low-density region has higher vibration velocities, therefore, the integral in (1) is also nonzero. In both cases the total HE current becomes nonzero and the resulting Hall voltage marks the presence of the interface.
Contributor Information
Han Wen, Laboratory of Cardiac Energetics, National Heart, Lung and Blood Institute National Institutes of Health, Bethesda, MD 20892 USA wen@zeus.nhlbi.nih.gov.
Jatin Shah, Laboratory of Cardiac Energetics, National Heart, Lung, and Blood Institute National Institutes of Health, Bethesda, MD 20892 USA..
Robert S. Balaban, Laboratory of Cardiac Energetics, National Heart, Lung, and Blood Institute National Institutes of Health, Bethesda, MD 20892 USA.
REFERENCES
- 1.Jackson JD. Classical Electrodynamics. New York: Wiley; 1975. ch. 6; p. 266. [Google Scholar]
- 2.Ballantine S. Reciprocity in electromagnetic, mechanical, acoustical, and interconnected systems. Proc. of the Institute of Radio Engineers. 1929;Vol. 17:929–951. [Google Scholar]
- 3.Reily JP. Electrical Stimulation and Electropathology. New York: Cambridge Univ. Press; 1992. ch. 2; p. 20. [Google Scholar]
- 4.Apfel RE, Holland CK. Gauging the likelihood of cavitation from short-pulse, low-duty cycle diagnostic ultrasound. Ultrasound Med. Biol. 1991;vol. 17:179–185. doi: 10.1016/0301-5629(91)90125-g. [DOI] [PubMed] [Google Scholar]
- 5.Crum LA, Roy RA, Dinno MA, Church CC, Apfel RE, Holland CK, Madanshetty SI. Acoustic cavitation produced by microsecond pulses of ultrasound: A discussion of some related results. J. Acoust. Soc. Amer. 1992 Feb.vol. 91:1113–1119. doi: 10.1121/1.402638. [DOI] [PubMed] [Google Scholar]
- 6.Reily JP. Electrical Stimulation and Electropathology. New York: Cambridge Univ. Press; 1992. ch. 7; p. 238. [Google Scholar]
- 7.Reily JP. Electrical Stimulation and Electropathology. New York: Cambridge Univ. Press; 1992. ch. 4; p. 119. [Google Scholar]
- 8.Goss SA, Johnston RL, Dunn F. Comprehensive compilation of empirical ultrasound properties of mammalian tissues. J. Acoust. Soc. Amer. 1978;vol. 64:423–457. doi: 10.1121/1.382016. [DOI] [PubMed] [Google Scholar]
- 9.Foster KR, Schwan HP. In: CRC Handbook of Biological Effects of Electromagnetic Fields. Part I. Polk C, Postow E, editors. Boca Raton, FL: CRC; 1986. p. 27. [Google Scholar]
- 10.Burdette EC, Cain FL, Seals J. In: Medical Applications of Microwave Imaging. Larsen LE, Jacobi JH, editors. Piscataway, NJ: IEEE Press; 1986. p. 23. [Google Scholar]
- 11.Foster KR, Schwan HP. In: CRC Handbook of Biological Effects of Electromagnetic Fields Part I. Part I. Polk C, Postow E, editors. Boca Raton, FL: CRC; 1986. p. 68. [Google Scholar]
- 12.Bucaro JA, Cole JH, Dandridge AD, Giallorenzi TG, Lagakos N. Optical Testing and Metrology. Bellingham, WA: Soc. Photo-Optical Instrum. Engineers; 1986. Fiber optic acoustic sensors; p. 182. [Google Scholar]
- 13.Knudsen S, Yurck AM, Tveten AB, Dandridge AD. High-sensitivity fiber optic planar ultrasonic microphone. Proc. Int. Soc. Opt. Eng. 1994;vol. 2360:396. [Google Scholar]
- 14.Dorighi JF, Krishnaswamy S, Achenbach JD. Embedded fiber optic ultrasonic sensors and generators. Proc. Int. Soc. Opt. Eng. 1995;vol. 2574:46. [Google Scholar]
- 15.Chen QX, Dewhurst RJ, Payne PA, Wood B. A new laser-ultrasound transducer for medical applications. Ultrson. 1994;vol. 32:309–313. doi: 10.1016/0041-624x(94)90011-6. [DOI] [PubMed] [Google Scholar]


