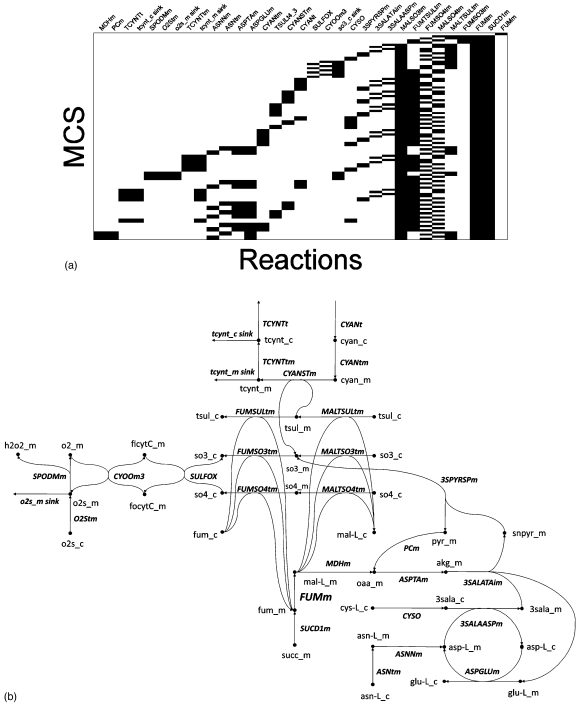
Figure 9.
(a) Membership map depicting 97 MCS and corresponding network of reactions predicted to be k-essential for mitochondrial fumarase (FUMm) flux. The sparsity pattern of each row in the map represents reaction membership in a single MCS. (b) In the corresponding network diagram, round shaded nodes represent species and labeled hyperedges represent network reactions. Abbreviations used in this figure are listed in Table 1.

