

Abstract
Rabbit anti-thymocyte globulins (rATG) induce CD4+CD25+forkhead box P3 (FoxP3+) regulatory T cells that control alloreactivity. In the present study, we investigated whether rATG convert T cells into functional CD4+CD25+FoxP3+CD127−/low regulatory T cells in the presence of drugs that may hamper their induction and function, i.e. calcineurin inhibitors. CD25neg T cells were stimulated with rATG or control rabbit immunoglobulin G (rIgG) in the absence and presence of tacrolimus for 24 h. Flow cytometry was performed for CD4, CD25, FoxP3 and CD127 and the function of CD25+ T cells was examined in suppression assays. MRNA expression profiles were composed to study the underlying mechanisms. After stimulation, the percentage CD4+CD25+FoxP3+CD127−/low increased (from 2% to 30%, mean, P < 0·01) and was higher in the rATG samples than in control rIgG samples (2%, P < 0·01). Interestingly, FoxP3+T cells were also induced when tacrolimus was present in the rATG cultures. Blockade of the interleukin (IL)-2 pathway did not affect the frequency of rATG-induced FoxP3+ T cells. The rATG tacrolimus-induced CD25+ T cells inhibited proliferative responses of alloantigen-stimulated effector T cells as vigorously as rATG-induced and natural CD4+CD25+FoxP3+CD127−/low T cells (67% ± 18% versus 69% ± 16% versus 45% ± 20%, mean ± standard error of the mean, respectively). At the mRNA-expression level, rATG-induced CD25+ T cells abundantly expressed IL-10, IL-27, interferon (IFN)-γ, perforin and granzyme B in contrast to natural CD25+ T cells (all P = 0·03), while FoxP3 was expressed at a lower level (P = 0·03). These mRNA data were confirmed in regulatory T cells from kidney transplant patients. Our findings demonstrate that tacrolimus does not negatively affect the induction, phenotype and function of CD4+CD25+ T cells, suggesting that rATG may induce regulatory T cells in patients who receive tacrolimus maintenance therapy.
Keywords: calcineurin inhibitors, rabbit immunoglobulins, regulatory T cells
Introduction
The major goal of transplantation immunobiology is to prevent alloreactivity by inducing a state of donor-specific hyporesponsiveness in order to acquire graft acceptance. There are several protocols to establish this. First, a straightforward way of inhibiting alloreactivity can be accomplished by immunosuppressive therapy. However, a major limitation of the most common immunosuppressive regimens is that they lack specificity, as they not only dampen the immune responses against the allograft. Secondly, apart from mechanisms such as clonal deletion, anergy or activation-induced cell death (AICD), the in vivo skewing of the immune system towards the regulatory T cells (Tregs) that control alloreactivity seems to be promising in obtaining donor-specific hyporesponsiveness as demonstrated in experimental transplantation models [1,2].
It is tempting to speculate that immunosuppressive drugs may also contribute to the development of donor-specific hyporesponsiveness via the active induction of Tregs. Indeed, experimental studies analysing the effects of various immunosuppressive agents suggest that these drugs contribute beneficially to immunoregulatory mechanisms [3–5]. For instance, rabbit anti-thymocyte globulin (rATG), which is given as induction therapy after transplantation, convert human CD25neg T cells into functional suppressive CD4+CD25+forkhead box P3 (FoxP3+) T cells in vitro[5,6]. Previously, we have reported that the number of CD4+CD25bright regulatory T cells recovered slowly and incompletely in kidney transplant recipients within 6 months after rATG-induction therapy when given in combination with a calcineurin inhibitor (CNI) and mycophenolate mofetil (MMF) [7]. Nevertheless, the donor-specific suppressive properties of these peripheral CD4+CD25bright T cells were equivalent to that of the CD4+CD25bright T cells before transplantation. In line with these results, it has been shown that steroids do not hamper the recovery of CD4+CD25+ regulatory T cells after treatment of kidney transplant patients with a non-depletive rATG-solution [8]. Moreover, the patient group that received rATG-treatment without steroids did not show enhanced levels of Tregs after treatment. Our study and the latter imply that CNIs might be responsible for the lack of enhanced Treg numbers after rATG therapy compared to pretreatment.
As CD4+CD25+ regulatory T cells require interleukin (IL)-2 and other members of the IL-2 cytokine family for their development, homeostasis and function [9–12], their frequency or function might be affected by CNIs that inhibit the transcription nuclear factor of activated T cells (NFAT) required for IL-2 transcription [13–15] or by anti-IL-2 receptor antibodies (daclizumab/basiliximab) that block IL-2 signalling [15]. This may imply that in patients, these agents may influence negatively the beneficial effects of rATG on the induction of Tregs.
To understand the factors that enhance or harm the development of functional rATG-induced Tregs, we investigated the induction of rATG-induced Tregs in the presence and absence of a CNI (tacrolimus), antibodies that abolish IL-2 (anti-IL-2) and block IL-2R signalling (daclizumab) on human peripheral blood cells. Furthermore, the rATG-treated cells were analysed functionally and characterized according to their gene-expression patterns to reveal their underlying mechanisms. The gene-expression profiles obtained in vitro were verified in kidney transplant patients who received rATG induction therapy and CNI maintenance therapy and were compared to a non-rATG group. These findings may have important implications for understanding one of the mechanisms of action of rATG in transplanted patients after rATG induction therapy which is followed by concomitant immunosuppression.
Materials and methods
Induction of Tregs
Peripheral blood mononuclear cells (PBMC) were isolated by density gradient centrifugation over Ficoll-Paque (Amersham Pharmacia Biotech, Uppsala, Sweden) from buffy coats of five blood bank donors (Sanquin Blood Bank, Rotterdam, the Netherlands). PBMC were washed twice and resuspended in 10% human cell medium (HCM), which consisted of RPMI-1640 medium with L-glutamine (BioWhittaker, Verviers, Belgium) supplemented with 10% pooled human serum and 100 IU/ml penicillin and 100 µg/ml streptomycin (GIBCO, BRL, Scotland, UK). The CD25+ T cells were depleted of the PBMC by incubation with anti-CD25 microbeads (Miltenyi Biotech, Bergisch Gladbach, Germany) followed by negative selection on the autoMACS (Miltenyi Biotech; deplete-s program). The untouched residual fraction consisted of CD25neg cells (>95% Fig. 1a). To induce Tregs with rATG, the residual (CD25neg) fraction was washed and resuspended in HCM to a final concentration of 5·105/ml. RATG (10 µg/ml, thymoglobulin; Genzyme Corporation, Cambridge, MA, USA), a control polyclonal rabbit IgG antibody (rIgG, 10 µg/ml, Sigma-Aldrich, St Louis, MO, USA), was added for 24 and 72 h. Tacrolimus (10 ng/ml; Astellas, Tokyo, Japan), monoclonal anti-human IL-2 Rα antibody (1 µg/ml; R&D Systems, Minneapolis, MN, USA) or anti-human IL-2 antibody (1 µg/ml; R&D Systems) was added to the rATG-treated cultures for 24 h.
Fig. 1.
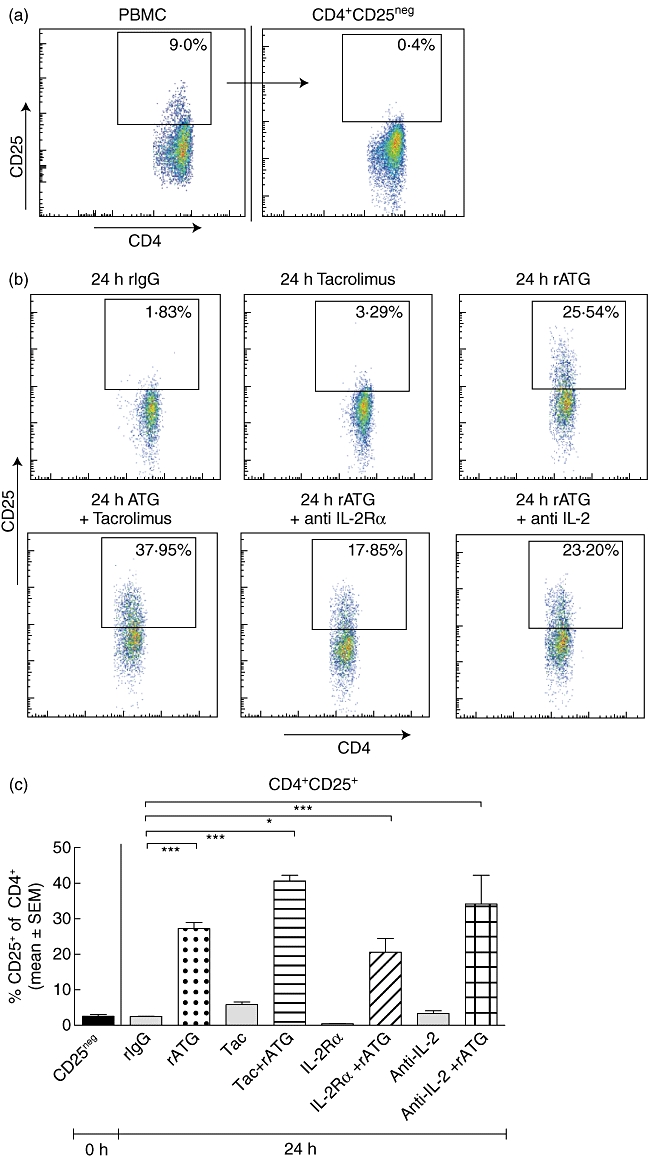
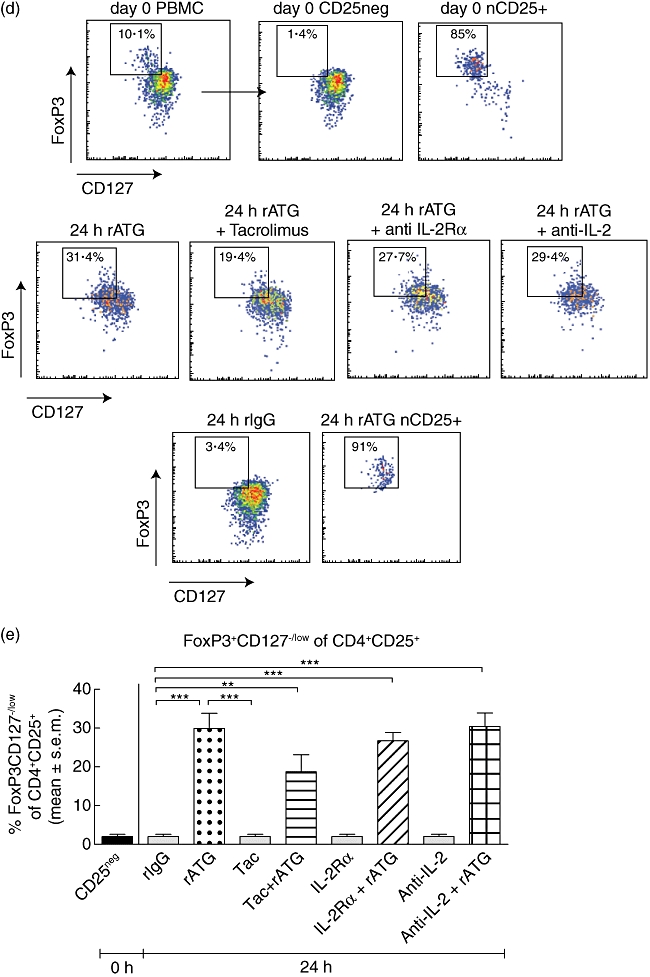
Induction of regulatory T cells. (a) Depletion of CD25+ T cells from peripheral blood mononuclear cells (PBMC). (b) Incubation of CD25neg T cells with rabbit immunoglobulin G (rIgG), tacrolimus, rabbit anti-thymocyte globulins (rATG), rATG + tacrolimus, rATG + interleukin (IL)-2 receptor (R)-α and rATG + anti-IL-2. Gate shows the percentage of CD25+ of CD4+ T cells. (c) Percentage of CD25+ T cells of CD4+, n = 3. Differences were tested statistically by analysis of variance (anova), P < 0·0001. (d) Representative example of percentage of forkhead box P3 (FoxP3+)CD127−/lowI within the induced CD25+ T cells of all cultures in the presence of rATG. CD25neg cells from PBMC (top panels) were stimulated for 24 h with rATG, rATG + tacrolimus, rATG + anti-IL-2Rα and rATG + anti-IL-2. After 24 h, induced CD25+ T cells were gated and analysed for their FoxP3+CD127−/low expression (middle panels). Gates for positivity were set on FoxP3+CD127−/low cells within natural (nCD25+) T cells after 24 h of incubation with rATG. FoxP3+CD127−/low cells were absent within CD25neg cells incubated with control rIgG (lower panels). (e) Percentage of FoxP3+CD127−/low of induced CD25+ T cells, three healthy individuals. Error bars represent mean ± standard error of the mean. Differences were tested statistically by anova. P < 0·0001; *P < 0·05; ***P < 0·001.
Flow cytometry
Flow cytometry was performed using antibodies conjugated directly to fluorescein isothiocyanate (FITC), phycoerythrin (PE), allophycocyanin (APC) or peridinin chlorophyll protein (PerCP) and Amcyan. After incubation with rATG or rIgG, PBMC were harvested and FoxP3-intracellular staining was performed according to the manufacturer's instructions (FoxP3-APC, clone PCH101; eBioscience, San Diego, CA, USA). Extracellular staining was conducted prior to intracellular staining with FITC-conjugated CD127 (eBioscience), IgG1, PerCP-conjugated CD4, PE-conjugated CD25 epitope B (clone M-A251; BD Biosciences, San Jose, CA, USA), PE-conjugated CD25 and Amcyan-conjugated CD3 at 4°C for 30 min (BD Biosciences). In a separate plate, PE-conjugated granzyme B (Pelicluster, clone CLB-GB11; CLB, Amsterdam, the Netherlands) was added simultaneously during incubation with the FoxP3-antibody. Prior to this intracellular staining, extracellular staining with PE-Cy7-conjugated CD25 epitope B (clone M-A251; BD Biosciences) and PerCP-conjugated CD4 was performed. Flow cytometry was performed on an eight-colour fluorescence activated cell sorter (FACS) Canto II supplemented with diva software (BD Biosciences). Isotype controls IgG1-FITC and IgG1-PE for CD25 and granzyme B and CD127 and IgG2a-APC were included at each staining as controls as well as the fluorescence minus one (FMO) controls [16].
Phosphospecific flow cytometry was performed according to the manufacturer's specifications (BD Biosciences) on CD25neg cells (blood bank donor buffy coats n = 3; Sanquin) before (unstimulated) and after 24 h of rATG (10 µg/ml) and rATG–tacrolimus (10 ng/ml) stimulation. PBMC and CD25neg cells (1·106) that were stimulated with PMA–ionomycin for 10 min at 37°C served as positive controls. Phosphorylation of P38 in CD3+CD4+, CD4+CD25+ and CD4+CD25neg gated cells was determined by five-colour flow cytometry using the following antibodies: mitogen-activated protein kinase (MAPK)-P38-PE (clone 36/p38 pT180/pY182; BD Biosciences), CD3-PerCP, CD4-PB and CD25-PE-Cy7 epitope B (clone M-A251; BD Biosciences). Cells were analysed on a FACSCanto II flow cytometer (BD Biosciences) for data analysis. Twenty thousand gated lymphocyte events were acquired from each tube. Median fluorescent intensity values (MFI) were generated by analysing the data with diva version 6·0 software (BD Biosciences). FMO controls and unstained control tubes were also included.
Isolation of human natural and induced Tregs and suppression assays
To test their function, natural and induced CD25+ T cells were isolated from the PBMC after incubation with anti-CD25 microbeads; Miltenyi Biotech) followed by a positive selection (posseld program) on the autoMACS (Miltenyi Biotech), as described previously [17]. The isolated and residual fractions were washed and resuspended in HCM for functional analysis. The untouched residual fraction consisted for ≥98% of CD25−/dim effector cells. The purity of the CD25+ isolated fraction was ≥90% [17].
The function of CD25+ T cells was determined by mixed lymphocyte reactions in which their suppressive capacities were measured by their ability to inhibit the proliferative response of autologous CD25neg effector T cells (CD25neg Teff). CD25neg Teff were co-cultured in triplicate with natural CD25+ T cells or with induced CD25+ T cells. Irradiated (40 Gy) 2-2-2 HLA mismatched allogeneic PBMC were used as stimulator cells (105 cells/100 µl) and co-cultured with 5·104 cells/100 µl of a CD25+: CD25neg mixture at 1:10 in triplicate wells in round-bottomed 96-well plates (Nunc, Roskilde, Denmark). Moreover, the natural and rATG-induced CD25+ T cells were co-cultured with irradiated CD25−/dim Teff in the presence of alloantigens to confirm their anergic state.
After 7 days of incubation at 37°C in a humidified atmosphere of 5% CO2, proliferation was measured after [3H]-thymidine (0·5 µCi/well; Amersham Pharmacia Biotech, Buckinghamshire, UK) incubation for the last 16 h before harvesting. [3H]-thymidine incorporation into DNA was assessed using a Betaplate counter (LKB-Wallac, Turku, Finland).
Patient samples
Six kidney transplant patients were enrolled in this study and were part of a feasibility study. Three patients were given one infusion of 1·5 mg/kg anti-thymocyte globulin (rabbit) (Thymoglobulin®, Genzyme Corporation, Cambridge, MA, USA) each day at days 1, 2 and 3 after transplantation followed by a triple therapy maintenance regimen consisting of tacrolimus, MMF and prednisone. MMF and prednisone were given from day 1 and tacrolimus was given from day 2 after transplantation. A control non-rATG group (three patients) was treated with tacrolimus, MMF and prednisone. Heparinized blood was drawn at 12 weeks (median) post-transplant, when median T cell numbers were 400 T cells/µl (three rATG patients). PBMC were isolated as described above by density gradient centrifugation over Ficoll-Paque. Subsequently, CD4+CD25+CD127−/low and CD4+CD25negCD127+ T cells were sorted with the FACSAria II (BD Biosciences) on PerCP-conjugated 7AAD, Pacific Blue-conjugated CD4, PE-Cy7-conjugated CD25 and PE-conjugated CD127 (BD Biosciences). The purity of CD25+ within sorted cells was ≥98%. After isolation, T cell subsets were snap-frozen for polymerase chain reaction (PCR) analyses.
Quantitative (Q) PCR
To analyse the gene expression patterns of the samples obtained from healthy individuals and patients, the CD25neg T cells on day 0, rATG-induced and rATG–tacrolimus-induced CD25+ and CD25neg T cells after 24 h, and natural CD25+ T cells were harvested and total RNA was isolated using the High Pure RNA isolation kit (Roche Applied Science, Penzberg, Germany), according to the manufacturer's instructions. RNA isolation from the patient samples was performed by extraction with phenol. In brief, cDNA was synthesized from total RNA with random primers as described previously [15]. Q-PCR was applied to quantify the mRNA expression levels of IL-4, retinoic acid-related orphan receptor (ROR)γt, perforin and granzyme B using the primer express software (Applied Biosystems, Foster City, CA, USA). Assay-on-demand products for the detection and quantification of 18S (Hs99999901_s1), CD25 (Hs00166229.m1), FoxP3 (Hs00203958_m1), IL-2 (Hs00174114.m1), IL-10 (Hs00174086.m1), Epstein–Barr virus-induced gene 3 (EBI3) (Hs01057148.m1), IL27p28 (Hs00377366.m1) and interferon (IFN)-γ (Hs00174143.m1) mRNA was designed by Applied Biosystems. The PCR reactions were performed using a StepOnePlus real-time PCR system (Applied Biosystems). The amount of each target molecule was quantified by measuring the cycle threshold (Ct) values, which were transformed to the number of cDNA copies [2(40−Ct)][18]. Each run contained several negative controls (no template) and two positive reference samples to check intra- and interassay variations. The same reference samples were used in all experiments. There were no significant differences in Ct values of reference samples within and between the experiments (all <0·25 Ct). The relative concentrations of the analysed markers were normalized to the relative concentration of the housekeeping gene 18S that was present in each sample and multiplied by 106 due to the lower concentration of the target gene compared with the concentration of 18S [18].
Cytotoxic T lymphocyte-mediated lysis (CML) assay
Activated CD25−/dim T cells (six blood bank donors) that served as target cells were isolated by autoMACS as described above and were stimulated with 200 IU/ml recombinant IL-2 (proleukin; Chiron BV, Amsterdam, the Netherlands), 2 µg/ml of the mitogen phytohaemaagglutinin (PHA) and 100 ng/ml IFN-γ[to up-regulate human leucocyte antigen (HLA) class II, U-Cytech, the Netherlands, Fig. 5d] in 24-well plates (Greiner) for 7 days at 37°C. On day 7, these autologous or allogeneic target blasts (target; T) were labelled with Europium-DTPA. HLA-class II expression by the target cells was analysed after staining with HLA D-regulated (HLA-DR) FITC and CD4-PerCP by flow cytometry (BD Biosciences).
Fig. 5.
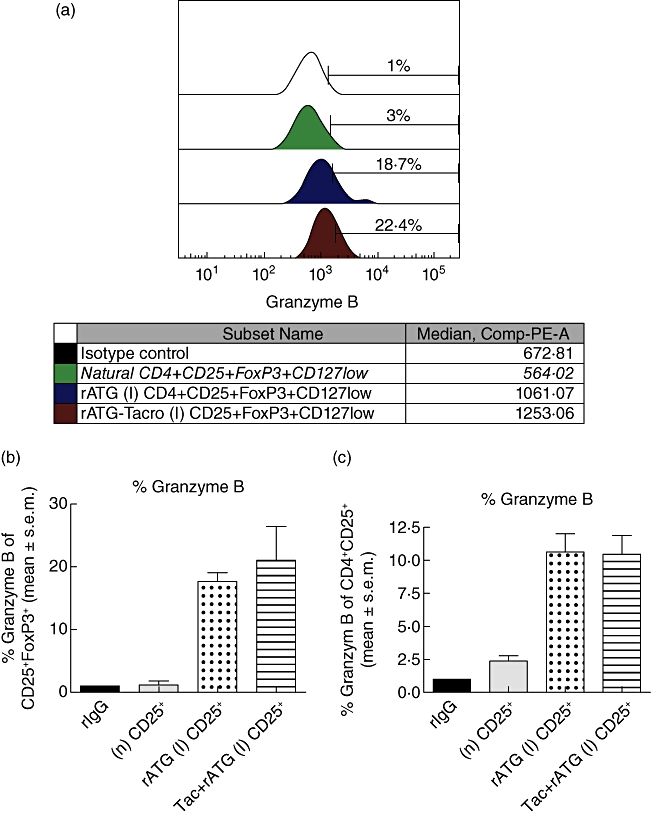
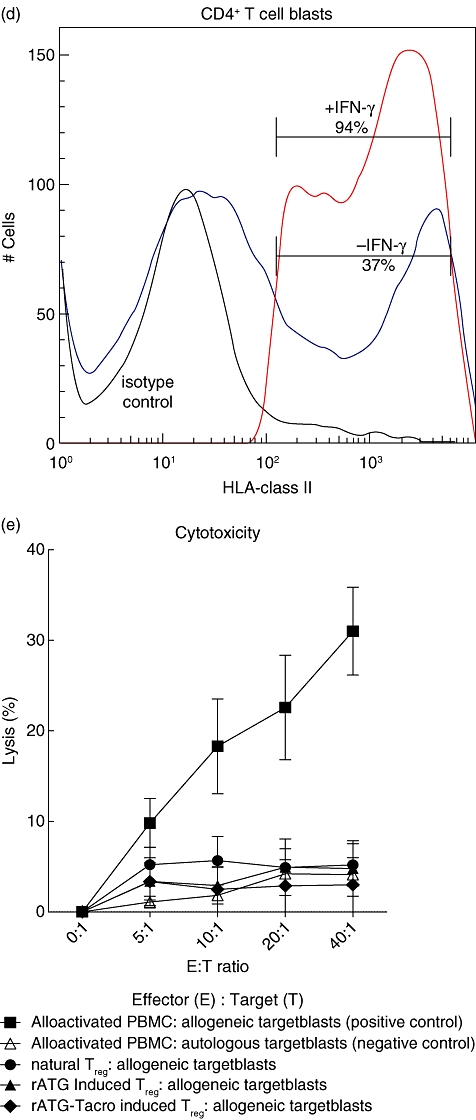
Flow cytometric analyses of granzyme B expression (a) within natural (green curve), rabbit anti-thymocyte globulins (rATG) (I) (dark blue curve) and rATG–tacrolimus (I) (red curve) CD25+FoxP3+CD127low T cells. The marker represents the percentage of granzyme B-positive cells. The table shows the median fluorescence of granzyme B. (b) Percentage of granzyme B-positive cells for three healthy individuals and (c) percentage of granzyme B-positive cells within CD4+CD25+ T cells of three healthy individuals. Mean ± standard error of the mean (s.e.m.) is shown. (d) One example of up-regulation of human leucocyte antigen (HLA) class II on CD4+ T cell blasts (gated on CD3+CD4+ T cells) in the presence of interferon (IFN)-γ. (e) Cytotoxicity assay with natural, rATG and rATG–tacrolimus-induced regulatory T cells (Treg) as effector cells (E) and Europium-labelled target blasts (T). Natural and induced Tregs are co-cultured with allogeneic target blasts. Means ± s.e.m. are shown for six healthy controls.
For effector cells we used PBMC that were stimulated with allogeneic irradiated PBMC and 200 IU/ml IL-2 for 7 days at 37°C. At day 7, these activated cells (effector; E) were co-cultured in 96-well plates for 4 h with autologous or allogeneic target blasts and served as the negative and positive control for cytotoxicity, respectively. Natural CD25+ T cells, rATG-induced and rATG–tacrolimus-induced CD25+ T cells were also used as effector cells and co-cultured with autologous and allogeneic target blasts at different effector : target (E : T) ratios (40:1, 20:1, 10:1, 5:1). After 4 h of incubation, the plates were centrifuged and 20 µl of the supernatant was harvested. Enhancement solution (100 µl; PerkinElmer, Groningen, the Netherlands) was added to the wells. Fluorescence of the released Europium was measured and expressed in counts per second (cps). The percentage lysis was calculated by [measured E:T Europium release – background Europium release (0:1)/(maximum Europium release – background Europium release) (×100%)]. Maximum Europium release was measured by incubation of target cells with 1% Triton (Sigma-Aldrich, Zwijndrecht, the Netherlands).
Calculations and statistical analyses
Statistical analysis of flow cytometry was performed using Graphpad Prism (version 5). To test if the values have normal distribution, the Kolmogorov–Smirnov test was used. For the determination of statistically significant levels, two-sided probability values were used according to the Mann–Whitney U-test. One-way analysis of variance (anova) was performed for multiple testing and post hoc analyses were performed using Bonferroni's test for multiple comparisons. P-values ≤0·05 were considered statistically significant.
Results
Induction of human CD4+CD25+FoxP3+CD127–/low Tregs with rATG
We performed induction experiments with rATG by the incubation of human CD25neg T cells that were depleted from PBMC (Fig. 1a). A typical example of induced CD25 expression after stimulation with rATG is shown in Fig. 1b. CD25+ T cells were induced in the rATG-treated samples [27% ± 1·7%, mean ± standard error of the mean (s.e.m.), n = 5, Fig. 1c] and the percentage CD25+ was significantly higher than in the rIgG-treated samples (2·6% ± 0·5%, Fig. 1c). Also, when incubated with rATG in the presence of tacrolimus, the proportion of CD25+ T cells was significantly higher compared to the rIgG-treated samples (41% ± 1·6%, Fig. 1c), while tacrolimus alone had no effect on the percentage of CD25+ T cells compared to the rIgG-treated samples.
To evaluate the effect of IL-2, we subsequently inhibited the IL-2 pathway. Incubation of CD25neg T cell cultures in the presence of an IL-2Rα inhibitor and rATG for 24 h also resulted in a significantly higher percentage of CD25-expressing CD4+ T cells than in the rIgG-treated samples (IL-2Rα: 21% ± 3·9% and anti-IL-2: 34% ± 8·1%, Fig. 1c). Next, the percentage of FoxP3+CD127−/low T cells was assessed within the CD4+CD25+ T cells. FoxP3+CD127−/low T cells were induced within the CD25+ T cells in all cultures with rATG (Fig. 1d). The percentages of FoxP3+CD127−/low of CD4+CD25+ T cells for the rIgG, rATG, rATG–tacrolimus, IL-2Rα and anti-IL-2 antibody were 2% ± 0·6%, 30% ± 3·9%, 19% ± 4·4%, 27% ± 2·2% and 30% ± 3·5%, respectively (Fig. 1e).
It has been reported that phosphorylation P38, an important component of the MAPK pathway that is linked to NFAT, can be inhibited by CNI [19–21]. Interestingly, P38 phosphorylation is required for transforming growth factor (TGF)-β-induced conversion of CD4+CD25neg cells into CD4+CD25+FoxP3+ Tregs[22]. Therefore, we questioned whether P38 phosphorylation was also induced after stimulation of CD25neg cells with rATG to induce FoxP3 expression. We found that phosphorylation was present at low levels in unstimulated CD25neg cells (Fig. 2a) and increased after 10 min of stimulation with PMA–ionomycin. Subsequently, the phosphorylation level of P38 was measured in the total CD4+ population after 24 h of incubation of CD25neg cells with rATG and rATG–tacrolimus. Phosphorylation of P38 was increased in the rATG-treated samples and the rATG–tacrolimus incubated samples. We did not find a difference in P38 phosphorylation level between rATG- and rATG–tacrolimus-treated samples (Fig. 2b). When gated on the rATG-induced CD25+ T cells, the level of phosphorylated P38 was comparable with that in natural CD25+ (Fig. 2b). Moreover, the level of phosphorylated P38 was higher in natural and rATG-induced CD25+ than in CD25neg.
Fig. 2.
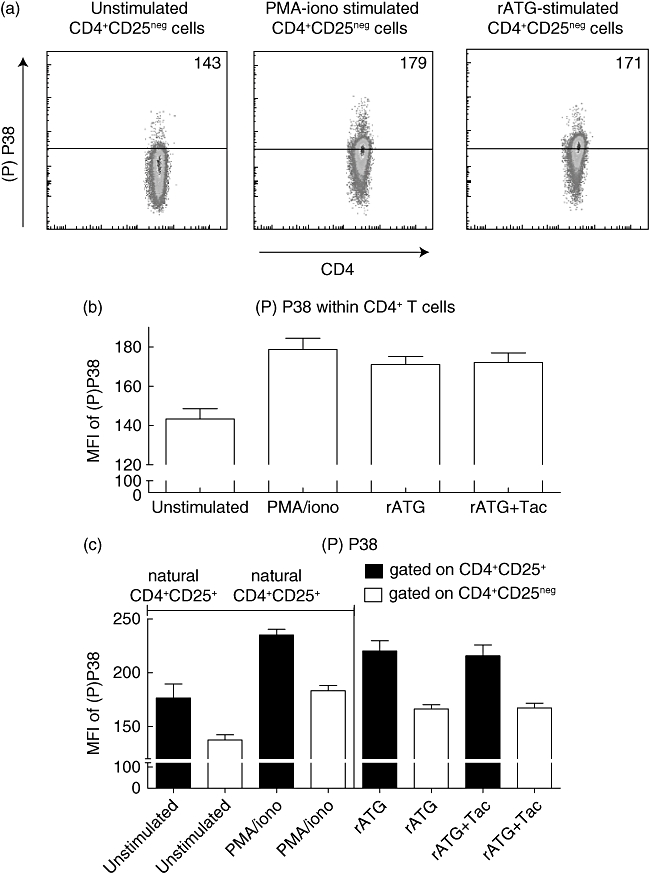
P38 phospho-specific flow cytometry. (a) Representative example of P38 phosphorylation levels in unstimulated, phorbol myristate acetate (PMA)–ionomycin-stimulated, rabbit anti-thymocyte globulins (rATG)-stimulated CD4+CD25neg cells. Median fluorescence intensities are depicted of phosphorylated P38 in CD4+ T cells after 24 h of culture. (b) P38 phosphorylation in unstimulated CD4+CD25neg cells, PMA–ionomycin-stimulated CD4+CD25neg cells, rATG-stimulated CD4+CD25neg cells and rATG–tacrolimus-stimulated CD4+CD25neg cells, n = 3. (c) phosphorylation of P38 in unstimulated and PMA–ionomycin-stimulated natural CD4+CD25+ (nCD4+CD25+) and CD4+CD25neg cells from PBMC and rATG-induced CD4+CD25+ and CD25neg cells.
Functional analysis of Tregs
Subsequently, we studied the suppressive capacity of rATG- and rATG–tacrolimus-induced CD4+CD25+ T cells. Therefore, these induced CD4+CD25+ T cells were isolated from the total PBMC population after 24 h and co-cultured in a suppression assay with autologous CD25neg T cells during stimulation with alloantigen.
After co-culture with natural CD25+, rATG-induced CD25+ or rATG–tacrolimus-induced CD25+ T cells, the proliferative responses by CD25neg T cells were lower (Fig. 3a). The rATG-induced CD25+ T cells that were induced in the presence or absence of tacrolimus inhibited the response at a comparable level to natural CD25+ T cells (mean ± s.e.m.) at a 1:10 ratio (rATG-induced CD25+ 69% ± 16%, rATG–tacrolimus-induced CD25+ 67% ± 18% versus natural CD25+ 45% ± 20%, Fig. 3b). The analogous suppressive capacities of the rATG-induced and the rATG–tacrolimus-induced CD25+ T cells suggest that rATG promotes bona fide regulatory T cells even in the presence of tacrolimus.
Fig. 3.
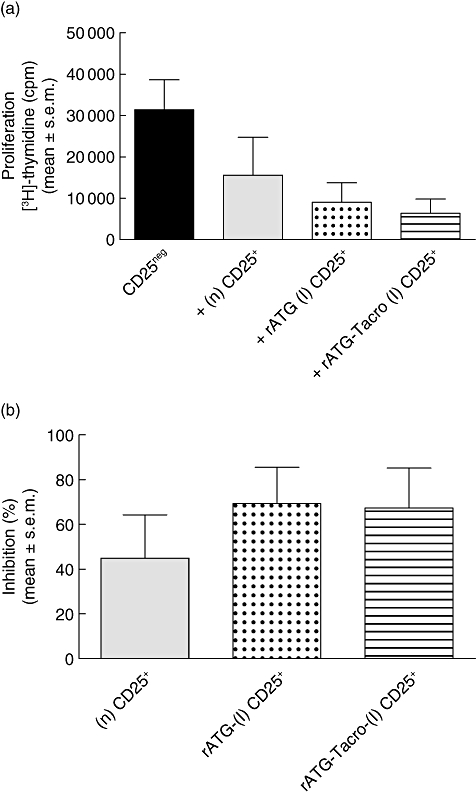
Suppression assays with natural (n) and rATG-induced (I) and rATG-tacrolimus-induced CD25+ T cells. (a) Proliferative responses after [3H]-thymidine incorporation are shown in counts per minute (cpm) of CD25neg T cells in response to alloantigen (black bar) and of CD25neg T cells in the presence of (n) CD25+ T cells (grey bar), rATG (I) (dotted bar) and rATG–tacrolimus-induced (striped bar) CD25+ T cells. (b) Percentage inhibition of the proliferation of CD25neg T cells by (n) (grey bar), rATG-(I) (dotted bar) and rATG–tacrolimus-induced (striped bar) CD25+ T cells. Mean ± standard error of the mean are shown for five healthy individuals.
A key characteristic of natural CD25+ suppressor T cells is that they do not proliferate upon stimulation with alloantigen. We found that the rATG-induced and rATG–tacrolimus-induced CD25+ T cells also did not show a proliferative response upon stimulation with alloantigen for 7 days, suggesting that the cells are anergic (rATG; 487 ± 153, rATG–tacrolimus; 369 ± 186, mean ± s.e.m.).
Gene expression profile of rATG-induced Tregs in the absence and presence of tacrolimus
To reveal the key molecules involved in the mechanism of action of rATG–tacrolimus-induced CD25+ T cells, we investigated their gene expression profiles on these T cells and compared them with rATG-induced and natural CD25+ T cells. The purity of CD25+ within sorted cells was ≥98%.
The mRNA expression of FoxP3 was significantly lower in the rATG-induced and rATG–tacrolimus-induced CD25+ T cells compared with natural CD25+ T cells (Fig. 4). IL-10, IL-27p28 and EBI3, IFN-γ, perforin and granzyme B were all expressed abundantly in the rATG- and rATG–tacrolimus-induced CD25+ T cells compared to natural CD25+ T cells (Fig. 4).
Fig. 4.

Relative mRNA expression patterns of (n) (grey bar), rabbit anti-thymocyte globulins (rATG) (I) (dotted bar) and rATG–tacrolimus (I) (striped bar) CD25+ T cells for forkhead box P3 (FoxP3), interleukin (IL)-10, Epstein–Barr virus-induced gene 3 (EBI3), IL-27p28, interferon (IFN)-γ, perforin and granzyme B for four healthy individuals. Error bars represent mean ± standard error of the mean. Significance was tested by analysis of variance (anova); FoxP3; P < 0·0001, IL-10; P = 0·0007, EBI3; P < 0·0001, IL-27p28; P = 0·01, IFN-γ. P = 0·0008, perforin;P < 0·0001, granzyme B; P = 0·0014, *P < 0·05.
Next, we compared the profiles of the rATG-induced CD25+ T cells in the presence and absence of tacrolimus and it appeared that the mRNA expression of all tested genes, with the exclusion of FoxP3 and IL-27p28, were significantly higher in the rATG-(I) CD25+ T cells in the presence of tacrolimus (Fig. 4). Overall, the gene expression profile of the rATG–tacrolimus-induced CD25+ T cells was comparable to the rATG-induced CD25+ T cells while distinct from that of natural CD25+ T cells (Fig. 4). IL-2, IL-4 and the transcription factor for T helper type 17 (Th17) cells RORγT were undetectable.
Flow cytometric analyses of granzyme B and cytotoxic activities by induced Tregs
The finding that granzyme B mRNA levels were up-regulated in the rATG-induced and more than 80-fold in rATG–tacrolimus-induced CD25+ T cells compared to natural CD25+ T cells prompted us to link the results on the transcriptional level with the translational level. Therefore, we also investigated the expression of this protein in these T cells. The percentages and fluorescence intensities of granzyme B+ T cells within the CD4+CD25+FoxP3+ T cells were measured to determine co-expression of granzyme B and FoxP3. A representative example of granzyme B+ T cells within CD4+CD25+FoxP3+ T cells is shown in Fig. 5a. A considerably higher percentage was granzyme B+ of the rATG–tacrolimus-induced CD4+CD25+FoxP3+ T cells, compared with natural CD25+FoxP3+ T cells (Fig. 5a,b). The fluorescence intensities of granzyme B were also higher in the rATG–tacrolimus- and rATG-induced CD25+FoxP3+ T cells compared to the natural CD25+FoxP3+ T cells, suggesting a higher per-cell expression (Fig. 5a). The percentage of granzyme B+ T cells was the same between rATG and rATG–tacrolimus-induced CD25+ T cell populations, whether defined as CD4+CD25+FoxP3+ (Fig. 5b) or CD4+CD25+ T cells (Fig. 5c).
To check whether the rATG-induced and rATG–tacrolimus-induced CD25+ T cells have cytotoxic activities, we performed a CML assay. Natural, rATG-induced and rATG–tacrolimus-induced CD25+ T cells were used as effector cells and target blasts were generated in the presence of IL-2 and IFN-γ from autologous and allogeneic PBMC and labelled with Europium. First, we checked the HLA-class II expression on T cell blasts. In the presence of IFN-γ, T cell blasts abundantly up-regulated HLA-class II (Fig. 5d). Allogeneic-stimulated PBMC were able to lyse allogeneic but not autologous target blasts. The percentage lysis of allogeneic target blasts by natural, rATG and rATG–tacrolimus-induced CD25+ was comparable to that of the autologous control, showing that they do not lyse allogeneic target blasts (Fig. 5e).
Gene expression profile of Tregs in kidney transplant patients after rATG induction therapy
To confirm expression levels found in vitro in cells from healthy individuals, the mRNA expression patterns of the same set of genes on CD25+ T cells from kidney transplant patients who received rATG induction therapy were followed by maintenance therapy consisting of tacrolimus. A non-rATG group who received maintenance therapy alone served as control, because their PBMC are composed of only natural Tregs and are not heterogeneous, as expected for the rATG-treated patients. The FACS-sorted CD4+CD25+CD127−/low T cells of patients within the rATG group showed significantly higher expression of CD25 and FoxP3 than the same T cell subset from patients in the non-rATG group (Fig. 6). Moreover, the mRNA-expression levels of IL-10, IL-2, IFN-γ, perforin and granzyme B were also expressed highly in the CD4+CD25+CD127−/low from rATG-treated patients compared with the CD4+CD25+CD127−/low T cells from the control group (Fig. 6). The mRNA levels of IL-27p28 and EBI3 were not detectable in the patient samples.
Fig. 6.
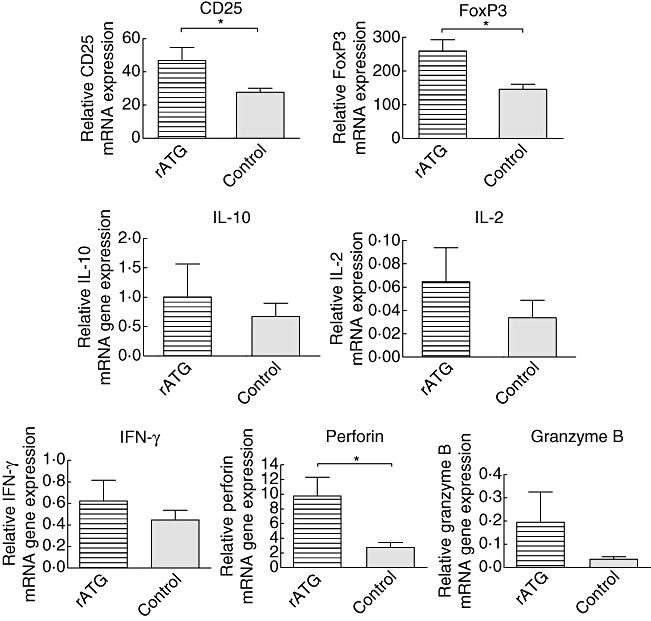
Relative mRNA expression patterns of CD25, forkhead box P3 (FoxP3), interleukin (IL)-10, IL-2, interferon (IFN)-γ, perforin and granzyme B within CD25+ T cells that were isolated from peripheral blood mononuclear cells (PBMC) of rabbit anti-thymocyte globulins (rATG) (striped bars, n = 3) and control patients (grey bars, n = 3). Data are shown as mean ± standard error of the mean. Statistical significance was tested by Mann–Whitney U-test, *P < 0·05.
Discussion
The main mechanism of action of most immunosuppressive drugs is to down-regulate immune responses against alloantigen by effector T cells. However, it became apparent that immunoglobulins can serve as the trigger for cytokines as, for example, IL-10 or TGF-β in the microenvironment of T cells to induce or expand Tregs.
In the present study, we explored the effect of immunosuppressants that hamper the IL-2 pathway on inducible regulatory T cells by rATG. We show that rATG induce CD25 and FoxP3 expression both in the presence and absence of tacrolimus and Daclizumab (Fig. 1). These rATG–tacrolimus CD25+ T cells have the same phenotype (Fig. 1) and P38-phosphorylation levels (Fig. 2), exhibit equal suppressive activities (Fig. 3) and have similar gene expression patterns (Fig. 4) compared to rATG-induced CD25+ T cells, showing that tacrolimus does not affect Treg induction negatively by rATG. The gene expression levels of rATG-induced CD25+ T cells in the presence of tacrolimus even seem to be enhanced. When the gene expression levels were verified in kidney transplant patients who received rATG-induction therapy, the in vitro data were confirmed (Fig. 6).
As it is well known that IL-2 expands CD4+CD25brightFoxP3+ T cells in vitro[23–25], the role of IL-2 in the development and homeostasis of FoxP3+ T cells with suppressive function is inconclusive. Incubation of human CD4+CD25neg T cells with IL-2 does not necessarily result in induction of CD25 or FoxP3 [26,27]. After activation with anti-CD3/CD28 and IL-2, the FoxP3neg T cells express FoxP3 only transiently but do not exhibit suppressive properties, showing that FoxP3 has to be expressed constitutively to induce regulatory activity [26,28,29]. In contrast to these results, it has been reported that FoxP3 is present in IL-2−/−, IL-2Rα−/− and IL-2Rβ−/− Tregs that have a regulatory function, while T cells from IL-2Rγ−/− mice do not express FoxP3 [9]. Thus, in line with our results using human cells, the direct (anti-IL-2) or indirect blockade of IL-2 (calcineurin inhibitor) still permits T cell signalling by other cytokines of the common γ-chain (CD132) that may compensate for the absence of IL-2 and may provide signals involved in the development, homeostasis and function of Tregs[10]. As it has been reported that blockade of the IL-2 pathway or the expression of Th17-inducing cytokines (IL-6 and IL-23) [30] may lead to the induction of Th17 cells and not of regulatory T cells, we now show that FoxP3+ regulatory T cells are induced even in the presence of IL-2 pathway inhibitors.
Antigenic stimulation alone is sufficient to induce conversion of conventional T cells into Tregs. This conversion takes place at an even higher rate when IL-2 is blocked, resulting in reduced proliferation of naive T cells that will differentiate into FoxP3+ Tregs[31]. Tregs that can be induced in the periphery upon encounter with antigen have been reported previously; for example, the FoxP3+TGF-β-producing Th3 cells and the FoxP3neg IL-10-producing Tr1 cells that up-regulate FoxP3 after antigen stimulation [4]. In our rATG–tacrolimus model, foreign rabbit antigens may serve as TCR trigger. However, although this resulted in an increased proportion of CD25, this was not associated with a higher proportion of FoxP3 positivity when the IL-2 pathway was blocked. Thus, for the induction and development of FoxP3 expression, both γc-cytokines and T cell receptor (TCR) stimulation are required.
Interestingly, the protein levels of other cytokines of the IL-2 family, IL-7 and IL-15, are increased in the serum of renal allografts recipients during the early post-transplant period, as demonstrated by Simon et al. [32]. These other cytokines of the IL-2 family may thus bypass the function of IL-2 itself to facilitate a certain FoxP3 expression and may allow the induction of Tregs in the presence of a calcineurin inhibitor in vitro and in vivo, as shown by our findings. IFN-γ is highly expressed by rATG-induced Tregs. It has been described previously that this cytokine may also play a crucial role in the function of induced Tregsin vivo[33,34]. Furthermore, a convincing role has been attributed to perforin and granzyme B in Tregs to mediate suppression and induce tolerance [35,36]. However, the rATG- and rATG–tacrolimus-induced Tregs do not operate by cytotoxicity, as shown in Fig. 5e. There could be two explanations for the absence of cytotoxic activity by the rATG-induced T cells. First, the frequency of granzyme B-expressing cells is lower in the rATG-induced CD4+CD25+ T cells (11% mean, Fig. 5c) than in cytotoxic CD8+ T cells or natural killer (NK) cells (40% of CD8+ T cells and 50% of NK cells after stimulation [37]). Thus, to accomplish lysis of target blasts, the frequency of granzyme B-expressing cells should be higher. Secondly, granzyme B expression in the induced Tregs is merely a phenotypic marker of T cell activation and is not linked to cytotoxic activities (cell granule exocytosis). The lack of correlation between granzyme B expressing PBMC in enzyme-linked immunospot (ELISPOT) and cytotoxic activities has also been found previously by our group [38], and has been shown in other human non-cytotoxic granzyme B-expressing cells types [39]. In these cells and the rATG-induced Tregs, granzyme B may have other non-apoptotic functions [39].
RATG-induced CD4+ and CD4+CD25+ T cells are characterized by high NFAT1-expression, as has been described by Feng et al. [6]. This observation clarifies the induction of FoxP3 in these cells, thereby confirming FoxP3 expression and regulatory activity. Disruption of the interaction between FoxP3 with NFAT resulted in a graded manner, with the ability of FoxP3 to repress the expression of IL-2 and to up-regulate CTLA-4 and CD25 [40,41]. Thus, it may be speculated that by the addition of a calcineurin inhibitor, NFAT cannot be phosphorylated and is not able to form a complex with FoxP3 [41], resulting in down-regulation of FoxP3. Phosphorylation of MAPK-P38, which regulates the transcription and activation NFAT [19,20], has been shown to be necessary for the in vitro induction of FoxP3+ regulatory T cells with TGF-β[22]. Our results show that the phosphorylation of P38 was induced in rATG-incubated cells and reached almost the same level as after PMA–ionomycin stimulation. Considering that the NFAT and MAPK pathways interact with each other, and both pathways can be inhibited by a calcineurin inhibitor [21], it would be expected that rATG-induced P38 phosphorylation is inhibited in the rATG–tacrolimus-induced Tregs. Our findings show that rATG-induced P38 phosphorylation was not inhibited in the presence of tacrolimus and FoxP3 expression was also not impaired (Fig. 2b). Apparently, rATG is a potent stimulus of this pathway and dominates the inhibitory effect of tacrolimus. Interestingly, the P38 phosphorylation level was higher within the rATG-induced CD25+ cells than within CD25neg cells and comparable to the natural CD25+ level, showing that they are bona fide Tregs (Fig. 2c). Moreover, the suppressive capacities of rATG–tacrolimus-induced CD25+ T cells were the same as rATG and natural CD25+ T cells. There are three possible explanations for this phenomenon. First, it could be that there is Ca2+-independent transcription of IL-2, as a calcineurin inhibitor inhibits IL-2 production for only 70–80% and thus is not the only pathway leading to proliferation [42,43], providing enough IL-2 for Treg homeostasis and function. Secondly, it has been demonstrated that therapeutic levels of cyclosporin A do not inhibit all calcineurin that is present in the cell (only about 50%), thereby allowing strong signals to trigger cytokine expression [44–46]. Thirdly, in a study with atopic dermatitis patients, the authors reasoned that partial T cell activation to induce activation-induced cell death makes Teff more sensitive to cyclosporin A than Treg[47]. This notion is supported by our findings, as tacrolimus apparently affects the signalling of effector T cells only by inhibiting their activation and their IL-2 production. In addition, an important function of calcineurin is to prevent deletion of activated T cells through the inhibition of activation-induced cell death. CNI alleviates this inhibition by transducing a ‘stress’ activation signal into the cell that subsequently triggers apoptosis. The stress activation signal may account for the ‘activated’ T cell gene expression pattern of rATG-induced Treg in the presence of tacrolimus.
In kidney transplant patients with rATG induction therapy and CNI maintenance therapy, Tregs with the memory phenotype recover slowly after rATG induction therapy, as reported previously [7]. This recovery can be attributed to homeostatic proliferation in the presence of low-dose (rabbit) antigen that triggers the output of naive T cells by the thymus and conversion into memory (regulatory) T cells in the periphery. The naive and memory (regulatory) T cells will proliferate to refill the empty space. The latter phenomenon results not only in recovery of Tregs but may also lead to higher Treg numbers or FoxP3 expression compared to baseline. Indeed, in our patients the gene expression of FoxP3 was higher than in the non-rATG control group (Fig. 6).
It should be taken into account that the FoxP3-induced expression in our model may represent a marker not only for Tregs, but also for T cell activation. Our rATG-induced CD25+ cells expressed FoxP3+ at a lower level (19–31%) than natural Tregs (85%). Furthermore, according to their mRNA-pattern they show a somewhat ‘activated T cell’ phenotype. These data emphasize that their phenotype does not fully resemble natural Tregs. However, the suppression assays show that rATG-induced CD25+ cells and natural Tregs have comparable regulatory activities. It is therefore essential to address whether the induced FoxP3+CD25+ T cells within the heterogeneous CD25+ T cell population or CD25+FoxP3neg cells exhibit suppressive activities. To date, it has not been possible to study the function of human FoxP3+ T cells because it is an intracellular marker. Thus, phenotypical analysis or mRNA expression analysis alone is not sufficient to classify cells into a particular T cell subset. It is essential to examine the function of T cells and combine these data with the phenotype analysis, as we have shown in the present study.
Taken together, in the present report we show that in the presence of immunosuppressants that inhibit IL-2 (tacrolimus) or IL-2 pathway inhibitors (anti-IL-2, anti IL-2Rα) indirectly it is still possible to induce Tregs by rATG that are identical phenotypically, functionally and at the gene expression level as Tregs that are induced by rATG in the absence of these immunosuppressants. Furthermore, it remains unclear whether natural or induced Tregs are more important in their contribution to donor-specific hyporesponsiveness after transplantation. More research needs to be conducted to characterize these rATG-induced T cells and to utilize fully their immunosuppressive properties to promote graft acceptance.
References
- 1.Waldmann H, Adams E, Fairchild P, Cobbold S. Infectious tolerance and the long-term acceptance of transplanted tissue. Immunol Rev. 2006;212:301–13. doi: 10.1111/j.0105-2896.2006.00406.x. [DOI] [PubMed] [Google Scholar]
- 2.Walker LS, Chodos A, Eggena M, Dooms H, Abbas AK. Antigen-dependent proliferation of CD4+CD25+ regulatory T cells in vivo. J Exp Med. 2003;198:249–58. doi: 10.1084/jem.20030315. [DOI] [PMC free article] [PubMed] [Google Scholar]
- 3.Bloom DD, Chang Z, Fechner JH, et al. CD4+CD25+FOXP3+ regulatory T cells increase de novo in kidney transplant patients after immunodepletion with Campath-1H. Am J Transplant. 2008;8:793–802. doi: 10.1111/j.1600-6143.2007.02134.x. [DOI] [PubMed] [Google Scholar]
- 4.Battaglia M, Stabilini A, Draghici E, et al. Rapamycin and interleukin-10 treatment induces T regulatory type 1 cells that mediate antigen-specific transplantation tolerance. Diabetes. 2006;55:40–9. [PubMed] [Google Scholar]
- 5.Lopez M, Clarkson MR, Albin M, Sayegh MH, Najafian N. A novel mechanism of action for anti-thymocyte globulin: induction of CD4+CD25+Foxp3+ regulatory T cells. J Am Soc Nephrol. 2006;17:2844–53. doi: 10.1681/ASN.2006050422. [DOI] [PubMed] [Google Scholar]
- 6.Feng X, Kajigaya S, Solomou EE, et al. Rabbit ATG but not horse ATG promotes expansion of functional CD4+CD25highFOXP3+ regulatory T cells in vitro. Blood. 2008;111:3675–83. doi: 10.1182/blood-2008-01-130146. [DOI] [PMC free article] [PubMed] [Google Scholar]
- 7.Sewgobind VD, Kho MM, van der Laan LJ, et al. The effect of rabbit anti-thymocyte globulin induction therapy on regulatory T cells in kidney transplant patients. Nephrol Dial Transplant. 2009;24:1635–44. doi: 10.1093/ndt/gfn778. [DOI] [PubMed] [Google Scholar]
- 8.Louis S, Audrain M, Cantarovich D, et al. Long-term cell monitoring of kidney recipients after an antilymphocyte globulin induction with and without steroids. Transplantation. 2007;83:712–21. doi: 10.1097/01.tp.0000255683.66156.d3. [DOI] [PubMed] [Google Scholar]
- 9.Fontenot JD, Rasmussen JP, Gavin MA, Rudensky AY. A function for interleukin 2 in Foxp3-expressing regulatory T cells. Nat Immunol. 2005;6:1142–51. doi: 10.1038/ni1263. [DOI] [PubMed] [Google Scholar]
- 10.Maloy KJ, Powrie F. Fueling regulation: IL-2 keeps CD4+ Treg cells fit. Nat Immunol. 2005;6:1071–2. doi: 10.1038/ni1105-1071. [DOI] [PubMed] [Google Scholar]
- 11.Wuest TY, Willette-Brown J, Durum SK, Hurwitz AA. The influence of IL-2 family cytokines on activation and function of naturally occurring regulatory T cells. J Leukoc Biol. 2008;84:973–80. doi: 10.1189/jlb.1107778. [DOI] [PMC free article] [PubMed] [Google Scholar]
- 12.Wang H, Zhao L, Sun Z, Sun L, Zhang B, Zhao Y. A potential side effect of cyclosporin A: inhibition of CD4(+)CD25(+) regulatory T cells in mice. Transplantation. 2006;82:1484–92. doi: 10.1097/01.tp.0000246312.89689.17. [DOI] [PubMed] [Google Scholar]
- 13.Demirkiran A, Kok A, Kwekkeboom J, Metselaar HJ, Tilanus HW, van der Laan LJ. Decrease of CD4+CD25+ T cells in peripheral blood after liver transplantation: association with immunosuppression. Transplant Proc. 2005;37:1194–6. doi: 10.1016/j.transproceed.2004.12.095. [DOI] [PubMed] [Google Scholar]
- 14.Segundo DS, Ruiz JC, Izquierdo M, et al. Calcineurin inhibitors, but not rapamycin, reduce percentages of CD4+CD25+FOXP3+ regulatory T cells in renal transplant recipients. Transplantation. 2006;82:550–7. doi: 10.1097/01.tp.0000229473.95202.50. [DOI] [PubMed] [Google Scholar]
- 15.Baan CC, van der Mast BJ, Klepper M, et al. Differential effect of calcineurin inhibitors, anti-CD25 antibodies and rapamycin on the induction of FOXP3 in human T cells. Transplantation. 2005;80:110–17. doi: 10.1097/01.tp.0000164142.98167.4b. [DOI] [PubMed] [Google Scholar]
- 16.Roederer M. Spectral compensation for flow cytometry: visualization artifacts, limitations, and caveats. Cytometry. 2001;45:194–205. doi: 10.1002/1097-0320(20011101)45:3<194::aid-cyto1163>3.0.co;2-c. [DOI] [PubMed] [Google Scholar]
- 17.Sewgobind VD, van der Laan LJ, Klepper M, et al. Functional analysis of CD4+ CD25bright T cells in kidney transplant patients: improving suppression of donor-directed responses after transplantation. Clin Transplant. 2008;22:579–86. doi: 10.1111/j.1399-0012.2008.00827.x. [DOI] [PubMed] [Google Scholar]
- 18.Bustin SA. Absolute quantification of mRNA using real-time reverse transcription polymerase chain reaction assays. J Mol Endocrinol. 2000;25:169–93. doi: 10.1677/jme.0.0250169. [DOI] [PubMed] [Google Scholar]
- 19.Round JL, Humphries LA, Tomassian T, Mittelstadt P, Zhang M, Miceli MC. Scaffold protein Dlgh1 coordinates alternative p38 kinase activation, directing T cell receptor signals toward NFAT but not NF-kappaB transcription factors. Nat Immunol. 2007;8:154–61. doi: 10.1038/ni1422. [DOI] [PubMed] [Google Scholar]
- 20.Wu CC, Hsu SC, Shih HM, Lai MZ. Nuclear factor of activated T cells c is a target of p38 mitogen-activated protein kinase in T cells. Mol Cell Biol. 2003;23:6442–54. doi: 10.1128/MCB.23.18.6442-6454.2003. [DOI] [PMC free article] [PubMed] [Google Scholar]
- 21.Matsuda S, Koyasu S. Regulation of MAPK signaling pathways through immunophilin–ligand complex. Curr Top Med Chem. 2003;3:1358–67. doi: 10.2174/1568026033451916. [DOI] [PubMed] [Google Scholar]
- 22.Huber S, Schrader J, Fritz G, et al. P38 MAP kinase signaling is required for the conversion of CD4+CD25– T cells into iTreg. PLoS One. 2008;3:e3302. doi: 10.1371/journal.pone.0003302. [DOI] [PMC free article] [PubMed] [Google Scholar]
- 23.Hoffmann P, Eder R, Kunz-Schughart LA, Andreesen R, Edinger M. Large-scale in vitro expansion of polyclonal human CD4(+)CD25high regulatory T cells. Blood. 2004;104:895–903. doi: 10.1182/blood-2004-01-0086. [DOI] [PubMed] [Google Scholar]
- 24.Elpek KG, Yolcu ES, Franke DD, Lacelle C, Schabowsky RH, Shirwan H. Ex vivo expansion of CD4+CD25+FoxP3+ T regulatory cells based on synergy between IL-2 and 4-1BB signaling. J Immunol. 2007;179:7295–304. doi: 10.4049/jimmunol.179.11.7295. [DOI] [PubMed] [Google Scholar]
- 25.Hoffmann P, Eder R, Boeld TJ, et al. Only the CD45RA+ subpopulation of CD4+CD25high T cells gives rise to homogeneous regulatory T-cell lines upon in vitro expansion. Blood. 2006;108:4260–7. doi: 10.1182/blood-2006-06-027409. [DOI] [PubMed] [Google Scholar]
- 26.Wang J, Ioan-Facsinay A, van der Voort EI, Huizinga TW, Toes RE. Transient expression of FOXP3 in human activated nonregulatory CD4+ T cells. Eur J Immunol. 2007;37:129–38. doi: 10.1002/eji.200636435. [DOI] [PubMed] [Google Scholar]
- 27.Zorn E, Nelson EA, Mohseni M, et al. IL-2 regulates FOXP3 expression in human CD4+CD25+ regulatory T cells through a STAT-dependent mechanism and induces the expansion of these cells in vivo. Blood. 2006;108:1571–9. doi: 10.1182/blood-2006-02-004747. [DOI] [PMC free article] [PubMed] [Google Scholar]
- 28.Allan se, Crome SQ, Crellin NK, et al. Activation-induced FOXP3 in human T effector cells does not suppress proliferation or cytokine production. Int Immunol. 2007;19:345–54. doi: 10.1093/intimm/dxm014. [DOI] [PubMed] [Google Scholar]
- 29.Zhou X, Bailey-Bucktrout SL, Jeker LT, et al. Instability of the transcription factor Foxp3 leads to the generation of pathogenic memory T cells in vivo. Nat Immunol. 2009;10:1000–7. doi: 10.1038/ni.1774. [DOI] [PMC free article] [PubMed] [Google Scholar]
- 30.Kimura A, Naka T, Kishimoto T. IL-6-dependent and -independent pathways in the development of interleukin 17-producing T helper cells. Proc Natl Acad Sci USA. 2007;104:12099–104. doi: 10.1073/pnas.0705268104. [DOI] [PMC free article] [PubMed] [Google Scholar]
- 31.Kretschmer K, Apostolou I, Hawiger D, Khazaie K, Nussenzweig MC, von Boehmer H. Inducing and expanding regulatory T cell populations by foreign antigen. Nat Immunol. 2005;6:1219–27. doi: 10.1038/ni1265. [DOI] [PubMed] [Google Scholar]
- 32.Simon T, Opelz G, Weimer R, et al. The effect of ATG on cytokine and cytotoxic T-lymphocyte gene expression in renal allograft recipients during the early post-transplant period. Clin Transplant. 2003;17:217–24. doi: 10.1034/j.1399-0012.2003.00031.x. [DOI] [PubMed] [Google Scholar]
- 33.Levings MK, Sangregorio R, Galbiati F, Squadrone S, de Waal Malefyt R, Roncarolo MG. IFN-alpha and IL-10 induce the differentiation of human type 1 T regulatory cells. J Immunol. 2001;166:5530–9. doi: 10.4049/jimmunol.166.9.5530. [DOI] [PubMed] [Google Scholar]
- 34.Wood KJ, Sawitzki B. Interferon gamma: a crucial role in the function of induced regulatory T cells in vivo. Trends Immunol. 2006;27:183–7. doi: 10.1016/j.it.2006.02.008. [DOI] [PubMed] [Google Scholar]
- 35.Grossman WJ, Verbsky JW, Barchet W, Colonna M, Atkinson JP, Ley TJ. Human T regulatory cells can use the perforin pathway to cause autologous target cell death. Immunity. 2004;21:589–601. doi: 10.1016/j.immuni.2004.09.002. [DOI] [PubMed] [Google Scholar]
- 36.Gondek DC, Devries V, Nowak EC, et al. Transplantation survival is maintained by granzyme B+ regulatory cells and adaptive regulatory T cells. J Immunol. 2008;181:4752–60. doi: 10.4049/jimmunol.181.7.4752. [DOI] [PMC free article] [PubMed] [Google Scholar]
- 37.Bratke K, Kuepper M, Bade B, Virchow JC, Jr, Luttmann W. Differential expression of human granzymes A, B, and K in natural killer cells and during CD8+ T cell differentiation in peripheral blood. Eur J Immunol. 2005;35:2608–16. doi: 10.1002/eji.200526122. [DOI] [PubMed] [Google Scholar]
- 38.van Besouw NM, Zuijderwijk JM, de Kuiper P, Ijzermans JN, Weimar W, van der Mast BJ. The granzyme B and interferon-gamma enzyme-linked immunospot assay as alternatives for cytotoxic T-lymphocyte precursor frequency after renal transplantation. Transplantation. 2005;79:1062–6. doi: 10.1097/01.tp.0000161222.03635.86. [DOI] [PubMed] [Google Scholar]
- 39.Romero V, Andrade F. Non-apoptotic functions of granzymes. Tissue Antigens. 2008;71:409–16. doi: 10.1111/j.1399-0039.2008.01013.x. [DOI] [PubMed] [Google Scholar]
- 40.Mantel PY, Ouaked N, Ruckert B, et al. Molecular mechanisms underlying FOXP3 induction in human T cells. J Immunol. 2006;176:3593–602. doi: 10.4049/jimmunol.176.6.3593. [DOI] [PubMed] [Google Scholar]
- 41.Wu Y, Borde M, Heissmeyer V, et al. FOXP3 controls regulatory T cell function through cooperation with NFAT. Cell. 2006;126:375–87. doi: 10.1016/j.cell.2006.05.042. [DOI] [PubMed] [Google Scholar]
- 42.Roifman CM, Mills GB, Cheung RK, Gelfand EW. Mitogenic response of human thymocytes: identification of functional Ca2+-dependent and independent signals. Clin Exp Immunol. 1986;66:139–49. [PMC free article] [PubMed] [Google Scholar]
- 43.Schwarz EC, Kummerow C, Wenning AS, et al. Calcium dependence of T cell proliferation following focal stimulation. Eur J Immunol. 2007;37:2723–33. doi: 10.1002/eji.200737039. [DOI] [PubMed] [Google Scholar]
- 44.Nikolic B, Zhao G, Swenson K, Sykes M. A novel application of cyclosporine A in nonmyeloablative pretransplant host conditioning for allogeneic BMT. Blood. 2000;96:1166–72. [PubMed] [Google Scholar]
- 45.Furtado GC, Curotto de Lafaille MA, Kutchukhidze N, Lafaille JJ. Interleukin 2 signaling is required for CD4(+) regulatory T cell function. J Exp Med. 2002;196:851–7. doi: 10.1084/jem.20020190. [DOI] [PMC free article] [PubMed] [Google Scholar]
- 46.Akl A, Luo S, Wood KJ. Induction of transplantation tolerance – the potential of regulatory T cells. Transpl Immunol. 2005;14:225–30. doi: 10.1016/j.trim.2005.03.011. [DOI] [PubMed] [Google Scholar]
- 47.Brandt C, Pavlovic V, Radbruch A, Worm M, Baumgrass R. Low-dose cyclosporine A therapy increases the regulatory T cell population in patients with atopic dermatitis. Allergy. 2009;64:1588–96. doi: 10.1111/j.1398-9995.2009.02054.x. [DOI] [PubMed] [Google Scholar]