MR imaging permits immediate depiction of ablated tissue zones for intraprocedural monitoring during irreversible electroporation ablation procedures.
Abstract
Purpose:
To test the hypothesis that magnetic resonance (MR) imaging measurements can be used to immediately detect treated tissue regions after irreversible electroporation (IRE) ablation procedures in rodent liver tissues.
Materials and Methods:
All experiments received institutional animal care and use committee approval. In four rats for preliminary studies and 18 rats for formal assessment, MR imaging–compatible electrodes were inserted into the liver and MR imaging–monitored IRE procedures were performed at one of three electrode voltages (1000, 1500, or 2500 V), with T1- and T2-weighted images acquired before and immediately after application of the IRE pulses. MR imaging measurements were compared with both finite element modeling (FEM)-anticipated ablation zones and histologically confirmed ablation zones at necropsy. Intraclass and Spearman correlation coefficients were calculated for statistical comparisons.
Results:
MR imaging measurements permitted immediate depiction of IRE ablation zones that were hypointense on T1-weighted images and hyperintense on T2-weighted images. MR imaging–based measurements demonstrated excellent consistency with FEM-anticipated ablation zones (r > 0.90 and P < .001 for both T1- and T2-weighted images). MR imaging measurements were also highly correlated with histologically confirmed ablation zone measurements (ρ > 0.90 and P < .001 for both T1- and T2-weighted images).
Conclusion:
MR imaging permits immediate depiction of ablated tissue zones for monitoring of IRE ablation procedures. These measurements could potentially be used during treatment to elicit repeat application of IRE pulses or adjustments to electrode positions to ensure complete treatment of targeted lesions.
© RSNA, 2010
Introduction
Electroporation involves the application of a short-lived electric field across the cell membrane to create nanoscale pores, thereby increasing membrane permeability (1). Typically, these pores close shortly after application of the electric field; this reversible electroporation phenomenon has been widely used to facilitate gene transfer (2–4) and drug delivery (5,6). However, when the electric field across the cell membrane is sufficiently strong, the pores do not reseal, leading to a loss of homeostasis and eventual cell death; this process has been described as irreversible electroporation (IRE) (7). IRE has been applied as a tissue ablation modality (7–10). IRE may offer multiple potential advantages compared with commonly used radiofrequency thermal ablation approaches for the treatment of hepatic lesions. Unlike radiofrequency thermal ablation, IRE does not suffer from heat-sink effects that can lead to indistinct margins between treated and untreated tissues (7,8), undertreatment of targeted tissues, and potential damage to adjacent blood vessels (10).
Finite element modeling (FEM) can be used to anticipate IRE ablation volumes on the basis of electrode positions and the applied voltage (11). However, these modeling procedures typically assume homogenous tissue conductivity; unknown anisotropic and/or heterogeneous tissue conductivities within fibrotic, cirrhotic, and/or tumor-containing liver tissues could conceivably lead to erroneous preprocedural approximation of the anticipated ablation volume. Imaging guidance may be important to enable immediate visualization of IRE ablation zones, thereby permitting patient-specific intraprocedural adjustments to the treatment protocol.
Magnetic resonance (MR) imaging guidance methods have already been advocated for intraprocedural monitoring of tumor ablation procedures owing to excellent soft-tissue contrast and the ability to noninvasively monitor temperature changes during radiofrequency thermal ablation and cryotherapy (12–14). Previously, MR imaging has been used to visualize electric shock trauma within muscle tissues; during these studies, muscle tissues subjected to high-voltage electric shocks demonstrated significantly increased signal intensity on T2-weighted MR images (15–17). Hence, we anticipated that MR imaging may also prove effective for immediate intraprocedural monitoring of tissue response during IRE procedures.
Our purpose was to test the hypothesis that MR imaging measurements can be used to immediately detect treated tissue regions after IRE ablation procedures in rodent liver tissues.
Materials and Methods
Experimental Overview
For this study, we performed in vivo intrahepatic IRE procedures in a rat model with multiple electrode voltage levels to achieve a range of different ablation zone sizes. Intraprocedural MR imaging measurements were performed immediately before and after application of the IRE pulses. MR imaging measurements of IRE ablation zone sizes were compared with histologically based ablation zone measurements determind at necropsy. We also simulated the anticipated ablation zone size for each applied voltage level with FEM methods. For outcome measures, we examined the correlation between MR imaging and histologically based ablation zone measurements and the correlation between MR imaging–based and FEM-anticipated ablation zone measurements.
Animal Model
All experiments were approved by the institutional animal care and use committee of Northwestern University. Twenty-two male Sprague-Dawley rats (Charles River, Wilmington, Mass), weighing 300–350 g, were used for these experiments. Four rats were used initially to qualitatively determine the feasibility of using intraprocedural MR imaging to depict the IRE ablation zones with 2500-V pulses applied to the electrodes. These rats were immediately sacrificed after the MR imaging–monitored IRE procedure. Another 18 rats were divided into three groups (six rats per group). Each group underwent IRE procedures with a different electrode voltage (1000, 1500, or 2500 V). These rats were kept alive for 24 hours after the procedure to permit definitive formation of IRE-induced necrotic tissue regions (7,8). Prior to IRE and MR imaging procedures, rats were anesthetized with a hind-limb injection of ketamine (75–100 mg per kilogram of body weight, Ketaset; Fort Dodge Animal Health, Fort Dodge, Iowa) and xylazine (2–6 mg/kg, Isothesia; Abbott Laboratories, North Chicago, Ill). Rats were restrained in the supine position, and the left lateral lobe of the liver was exposed with a midline incision. Two parallel electrodes (platinum-iridium needles; length, 35 mm; diameter, 0.4 mm [1 French]; 10-mm spacing maintained by insertion of the needles through holes drilled in a 15-mm-thick plastic spacing block) were inserted into the center of the left lateral lobe to a depth of approximately 12 mm.
MR Imaging Measurements
All studies were performed by using a 3-T clinical imager (Magnetom Trio; Siemens Medical Solutions, Erlangen, Germany) with four-element carotid array coils used for signal reception. Electrodes remained positioned within the liver throughout the procedure but were disconnected from the function generator during the MR imaging. Prior to application of the IRE pulses, localization imaging was performed to identify separate imaging planes perpendicular to and parallel to the electrodes. Next, we acquired pre-IRE T1-weighted gradient-recalled echo (GRE) images (repetition time msec/echo time msec, 200/2.5; flip angle, 90°; section thickness, 2 mm; field of view, 65 × 150 mm; matrix, 84 × 192; bandwidth, 500 Hz per pixel) and T2-weighted (3500/60), proton-density-weighted (3500/8), and T1-weighted (200/8) turbo spin-echo (TSE) images (section thickness, 2 mm; field of view, 65 × 150 mm; matrix, 84 × 192; bandwidth, 500 Hz per pixel). Images were acquired along orientations both parallel and perpendicular to the electrodes. Immediately following application of the IRE pulses, MR imaging measurements were repeated.
IRE Procedures
After pre-IRE MR imaging, rats were removed from the imaging bore but remained fixed in the supine position within restraint apparatus (strapped to form-fitting backboard). Electrodes were connected to an IRE function generator (Electroporator ECM830; BTX Division of Harvard Apparatus, Holliston, Mass). For IRE procedures, 1000–2500-V square wave pulses were applied to the two parallel electrodes (total number of pulses, 8; duration of each, 100 microseconds; interval between pulses, 100 milliseconds). Immediately after application of the IRE pulses, electrodes were disconnected and animals were returned to the bore for follow-up imaging measurements. For the rats electroporated with 1000-V pulses, the electrodes were removed prior to follow-up T1- and T2-weighted imaging to permit visualization of IRE ablation zones that smaller than the induced magnetic susceptibility–based electrode artifacts.
FEM Simulations
For FEM simulations, we used Comsol Multiphysics software package (Comsol, Burlington, Mass), which implements the finite element method to solve partial differential equations. The anticipated electric field potentials resulting from application of the IRE pulses were determined by solving the Laplace equation: ▽(σ▽Φ) = 0, where Φ is the electric potential and σ is the electric conductivity of surrounding tissues. Our simulations closely followed those described in previous IRE studies (7,9,18). Briefly, the liver was approximated as a cylindrically symmetric disk with a 30-mm diameter and isotropic and homogeneous tissue conductivity of 0.125 S/m (19). For simplicity, this approximation did not include spatially heterogeneous conductivity properties that could be expected in clinical patients owing to the presence of fibrotic and tumor tissues. The parallel two-needle electrode array was positioned at the center of this simulated liver volume. The specified IRE electrode voltage was applied to one of the electrodes while the other electrode was treated as the ground. Liver surfaces were assumed to be electrically insulating. Previous rabbit model studies demonstrated that IRE electric field potentials greater than 63.7 V/mm ± 4.3 (standard deviation) are lethal within hepatic parenchyma (20). Therefore, for our IRE FEM simulations, we assumed that electric field potentials greater than 68.0 V/mm would be sufficient for tissue ablation; for applied electrode voltages of 1000, 1500, and 2500 V, we measured the area (in square millimeters) within a plane perpendicular to the electrodes that was anticipated to achieve this lethal electric field threshold (ie, ablation zone based upon these FEM simulations).
Histologic Evaluation
The initial four animals were euthanized immediately after post-IRE MR imaging. An additional 18 animals were euthanized 24 hours after electroporation. After euthanasia, the livers were harvested for necropsy. Livers were fixed in a 10% buffered formaldehyde solution, sliced at 3-mm intervals, and embedded in paraffin for histologic examination. Liver sections were sliced in 4-μm-thick sections and stained with hematoxylin-eosin (H-E). Histologic slides were digitized with an optical magnification image acquisition system (TissueGnostics, Vienna, Austria). These specimens were evaluated by an attending surgical pathologist (G.Y.Y., with more than 10 years experience in gastrointestinal oncology). Software (ImageJ; National Institutes of Health, Bethesda, Md) was used to manually draw a region of interest that circumscribed areas of cellular necrosis on each image to measure the resulting IRE ablation zone for each animal. The areas of these regions of interest (in square millimeters) were measured for comparison.
Data Analysis
For rats euthanized 24 hours after electroporation, regions of interest were drawn to measure the MR imaging–monitored ablation zones separately on T2-weighted TSE and T1-weighted GRE images in an orientation perpendicular to the IRE electrodes. These regions of interest were drawn with the reviewer blinded to the applied IRE electrode voltage used. The reviewer, a Certificate of Added Qualification–certified attending interventional radiologist (R.J.L., with more than 10 years experience in liver-directed interventional oncology procedures), qualitatively selected hypointense regions on the T1-weighted images and hyperintense regions on the T2-weighted images with visual reference to the corresponding pre-IRE images. The areas of these regions of interest were measured for comparisons. MR imaging–based ablation zone measurements were evaluated with respect to both ablation zones anticipated with FEM simulations and those measured on corresponding histologic slides.
We also measured the diameter of the electrode artifacts on GRE T1-weighted images and TSE T2-weighted images by using images aligned perpendicular to the electrodes.
Statistical Analysis
Analysis of variance methods were used to evaluate between-group differences in MR imaging ablation zone measurements (ie, T1- and T2-weighted) for the different IRE voltage groups. Independent t tests were used to compare T1- and T2-weighted MR imaging–measured IRE ablation zones at each voltage level. Intraclass correlation was used to evaluate the consistency between intraprocedural MR imaging measurements and FEM-anticipated ablation zones for the three voltage levels. Spearman correlation coefficients were used to determine the relationship between MR imaging measurements and histologically confirmed ablation zone measurements (both continuous variables). These analyses were implemented with software (SPSS, version 17; SPSS, Chicago, Ill). P values less than .05 were considered to indicate a significant difference.
Results
MR Imaging Measurements
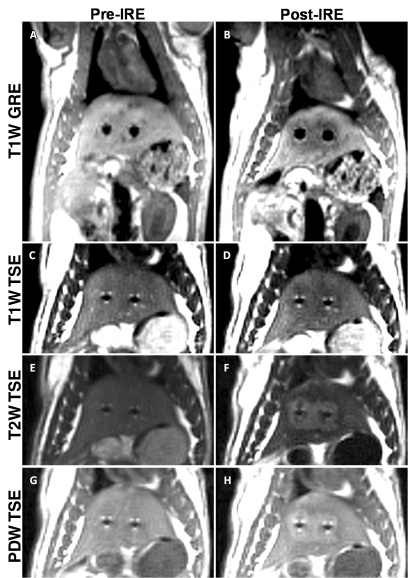
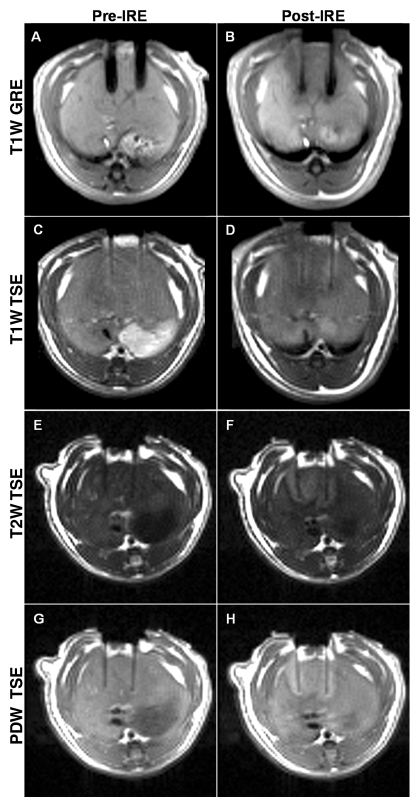
Figures 1 and 2 show representative T1-weighted GRE images and T1-, T2-, and proton-density-weighted TSE images before and immediately after application of 2500-V IRE, obtained perpendicular (Fig 1) and parallel (Fig 2) to the electrodes. Tissues affected by IRE were clearly demarcated from surrounding normal hepatic parenchyma; electroporated tissues were hypointense on T1-weighted GRE and TSE images but were consistently hyperintense on both proton-density- and T2-weighted TSE images. The mean diameter of the electrode artifacts was 3.5 mm ± 0.3 (standard deviation) on T1-weighted GRE images and 1.5 mm ± 0.2 on T2-weighted TSE images.
Figure 1:
Representative MR images acquired perpendicular to the electrodes before (Pre-IRE) and immediately after (Post-IRE) IRE with 2500-V pulses. A, B, T1-weighted (T1W) GRE images; C, D, T1-weighted TSE images; E, F, T2-weighted (T2W) TSE images; G, H, proton-density-weighted (PDW) TSE images. Bipolar electrode positions are depicted as signal voids. Ablation zones are hypointense on T1-weighted images and hyperintense on both T2- and proton-density-weighted images.
Figure 2:
Representative MR images acquired parallel to the electrodes before (Pre-IRE) and immediately after (Post-IRE) IRE with 2500-V pulses. A, B, T1-weighted (T1W) GRE images; C, D, T1-weighted TSE images; E, F, T2-weighted (T2W) TSE images; G, H, proton-density-weighted (PDW) TSE images. Bipolar electrode positions are depicted as signal voids. Ablation zones are hypointense on T1-weighted images and hyperintense on both T2- and proton-density-weighted images.
Histologic Evaluation
For rats euthanized immediately after IRE, H-E slides prepared from corresponding liver specimens showed eosinophilic cytoplasmic changes within the electroporated regions adjacent to the electrode positions; however, no other substantial histologic alterations were observed at this early post-IRE interval. For rats euthanized 24 hours after IRE procedures, histologic slides demonstrated eosinophilic cytoplasmic changes and central necrosis within IRE ablation zones, with congestion in interstitial spaces and a well-delineated boundary between untreated and ablated tissues (Fig 3).
Figure 3a:
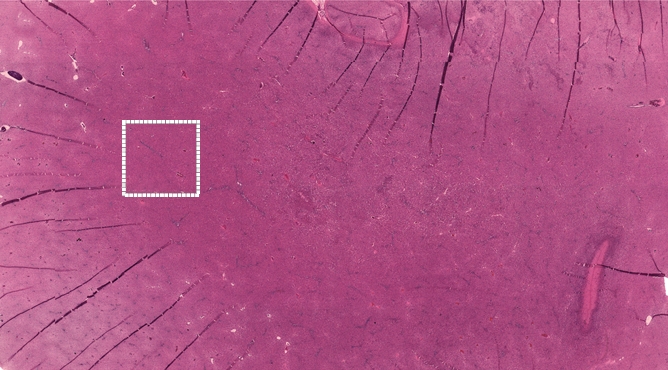
Representative H-E–stained histology slides for rats sacrificed (a, b) immediately and (c) 24 hours after 2500-V IRE procedures. (a) A low magnification image with a large field of view and (b) inset (white box in a) both show no clear morphologic changes but eosinophilic cytoplasmic changes in IRE ablation zone. Image c shows a well-delineated boundary between untreated and ablated tissues, with cellular necrosis in ablation zone. (Original magnification in a, ×2.5; in b and c, ×25.)
Figure 3b:
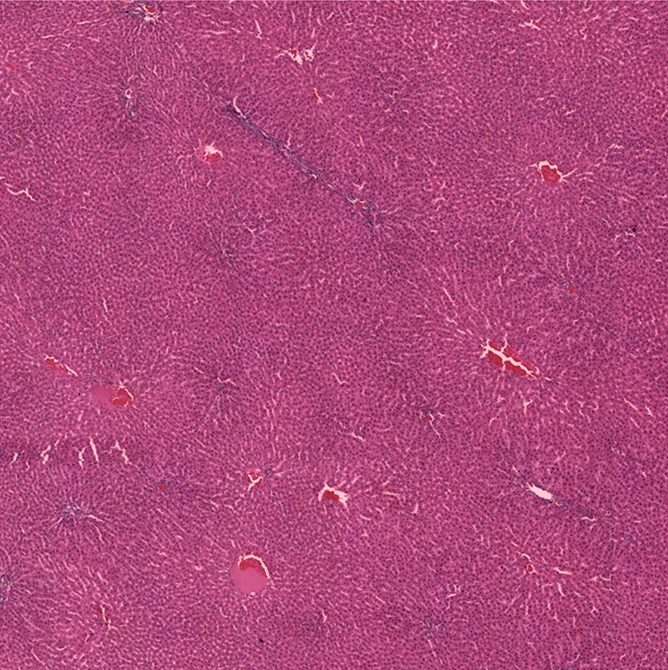
Representative H-E–stained histology slides for rats sacrificed (a, b) immediately and (c) 24 hours after 2500-V IRE procedures. (a) A low magnification image with a large field of view and (b) inset (white box in a) both show no clear morphologic changes but eosinophilic cytoplasmic changes in IRE ablation zone. Image c shows a well-delineated boundary between untreated and ablated tissues, with cellular necrosis in ablation zone. (Original magnification in a, ×2.5; in b and c, ×25.)
Figure 3c:
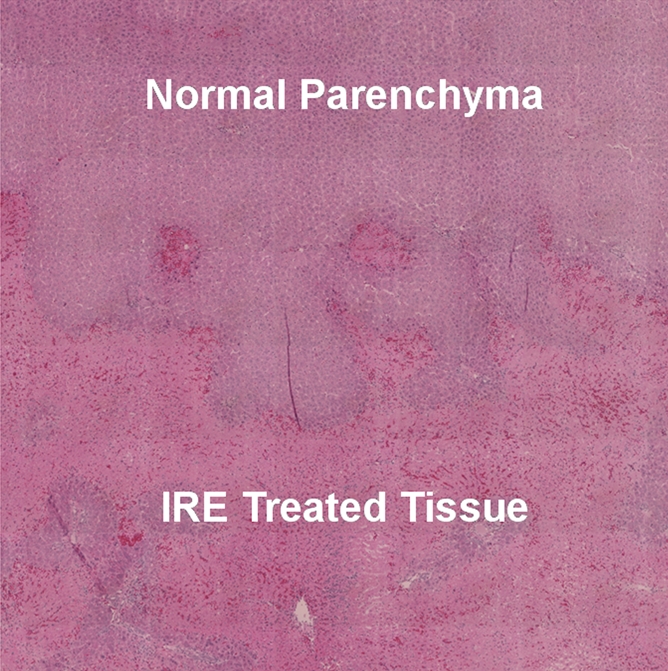
Representative H-E–stained histology slides for rats sacrificed (a, b) immediately and (c) 24 hours after 2500-V IRE procedures. (a) A low magnification image with a large field of view and (b) inset (white box in a) both show no clear morphologic changes but eosinophilic cytoplasmic changes in IRE ablation zone. Image c shows a well-delineated boundary between untreated and ablated tissues, with cellular necrosis in ablation zone. (Original magnification in a, ×2.5; in b and c, ×25.)
Relationship between FEM-predicted, MR-measured, and Histology-confirmed Ablation Zones
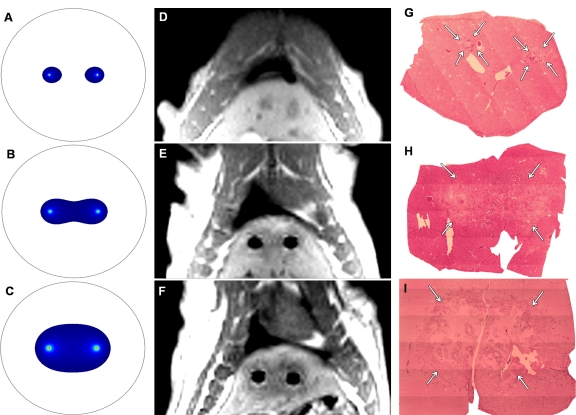
FEM-predicted ablation zones (with anticipated 68.0 V/mm lethal electric field potential) for electrode voltages of 1000, 1500, and 2500 V, along with corresponding post-IRE T1-weighted GRE images and H-E histology images for three different animals are shown in Figure 4. As illustrated in Figure 4, the MR imaging measurements and corresponding histologic slides similarly depicted an increased ablation zone with increasing voltage and well-delineated boundaries between untreated and ablated tissues.
Figure 4:
A–C, FEM-anticipated IRE ablation zones; D–F, post-IRE T1-weighted GRE images; and G–I, corresponding H-E histology slides from livers harvested 24 hours after IRE. (Original magnification, ×2.5.) Top row: 1000 V. Middle row: 1500 V. Bottom row: 2500 V. MR images were acquired perpendicular to IRE electrodes, which were removed prior to (D) post-IRE MR imaging for 1000-V procedure. Note that increasing FEM-anticipated and T1-weighted ablation zone sizes parallel increasing ablation zone sizes (arrows on G–I) on corresponding histology slides.
Analysis of variance indicated significant differences in MR imaging–based ablation zone measurements for the three different IRE electrode voltages (P ≤ .001 for both T1- and T2-weighted measurements). For T1- and T2-weighted images, mean areas significantly increased with IRE voltage level, as indicated by significant linear trends (P < .001). For both T1- and T2-weighted measurements, ablation zones were progressively and significantly larger at higher voltage (P < .001, Table).
MR Imaging and Histologic Measurements of IRE Ablation Zone

Data are means ± standard deviations. Within each measurement modality (ie, T1-weighted MR imaging, T2-weighted MR imaging, or histologic evaluation), significant differences in ablation zone size existed between the three voltages (all P < .001).
P = .272 vs T1-weighted MR imaging at this voltage.
P = .061 vs T1-weighted MR imaging at this voltage.
P = .120 vs T1-weighted MR imaging at this voltage.
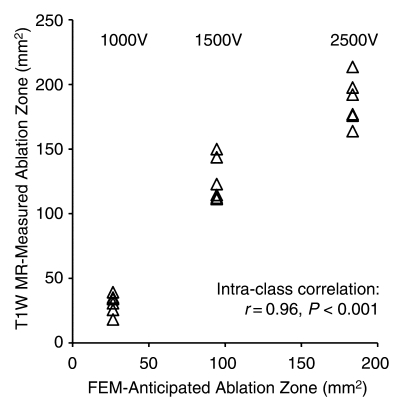
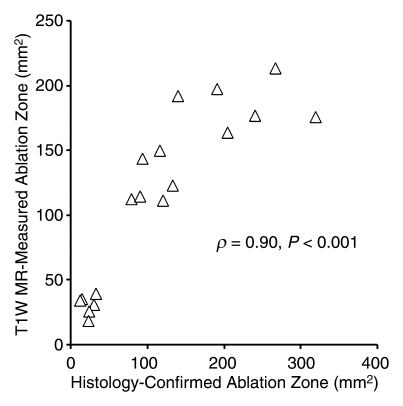
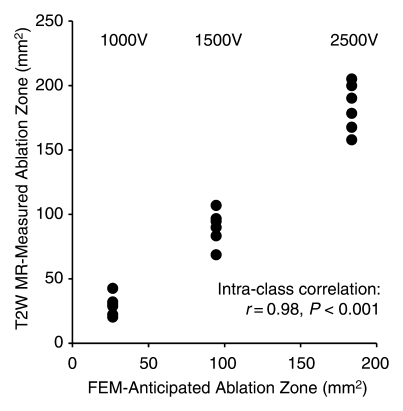
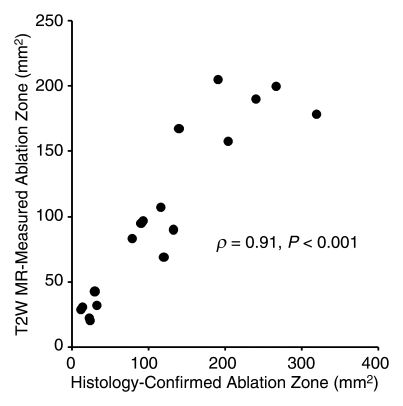
FEM simulations predicted IRE ablation zones of 26.51, 94.48, and 183.54 mm2 for electrode voltages of 1000, 1500, and 2500 V, respectively. Examination of the consistency between ablation zone measurements determined in vivo with MR imaging and those anticipated with FEM indicated intraclass correlation coefficients of 0.96 (P < .001) for measurements on T1-weighted images and 0.98 (P < .001) for those on T2-weighted images (Fig 5). As shown in Figure 6, MR imaging measurements of the IRE ablation zones were also highly correlated with histologically determined ablation zone measurements by using Spearman correlation coefficients (T1-weighted MR images: ρ = 0.90, P < .001; T2-weighted MR images: ρ = 0.91, P < .001). On H-E–stained slides, coagulative necrosis was clearly visualized in the ablation regions. The ablated zones were well demarcated from surrounding hepatic parenchyma. In the regions of IRE ablation, hepatocytes had markedly eosinophilic cytoplasms, and sinusoids were congested.
Figure 5a:
Scatterplots show relationship between (a) T1-weighted (T1W) and (b) T2-weighted (T2W) MR imaging–based IRE ablation zone measurements and FEM-anticipated ablation zone sizes. Measures on MR images were highly consistent with FEM-anticipated ablation zones.
Figure 6a:
Scatterplots show relationship between (a) T1-weighted (T1W) and (b) T2-weighted (T2W) MR imaging–based IRE ablation zone measurements and histology-confirmed IRE ablation zone measurements. Measures on MR images were highly correlated with histologic measurements of the IRE ablation zone.
Figure 5b:
Scatterplots show relationship between (a) T1-weighted (T1W) and (b) T2-weighted (T2W) MR imaging–based IRE ablation zone measurements and FEM-anticipated ablation zone sizes. Measures on MR images were highly consistent with FEM-anticipated ablation zones.
Figure 6b:
Scatterplots show relationship between (a) T1-weighted (T1W) and (b) T2-weighted (T2W) MR imaging–based IRE ablation zone measurements and histology-confirmed IRE ablation zone measurements. Measures on MR images were highly correlated with histologic measurements of the IRE ablation zone.
Discussion
IRE is a potentially highly effective tissue ablation technique. However, intraprocedural imaging guidance may be critical to optimize IRE approaches, particularly for visceral ablation procedures targeting liver tumors of primary or metastatic origin. Our initial feasibility studies successfully demonstrated the potential for using MR imaging measurements to monitor IRE ablation zones in rat livers. Ablation zones were immediately visible on MR images as hypointense regions on T1-weighted images and as hyperintense regions on T2- and proton-density-weighted images. IRE ablation zones increased in size on MR images with increasing electrode voltage. MR imaging–based ablation zone measurements showed good consistency with FEM-anticipated ablation zones and were highly correlated with follow-up measurements on histologic slides (ρ > 0.90 and P < .001 for both T1- and T2-weighted measurements).
IRE electrodes were visualized as signal voids on GRE images, resulting in larger signal voids than those depicted on TSE images. The diameters of these signal voids were much larger than the diameter of the electrodes themselves. Owing to the presence of these signal voids, the effect of the IRE ablation pulses could not be readily visualized immediately adjacent to the electrodes. However, in practice, we do not anticipate this limitation to be problematic for intraprocedural monitoring, given that tissues immediately adjacent to the electrode should experience electric field potentials orders of magnitude greater than those produced in tissues located at increasing distances from the electrodes (11). We would anticipate that, relatively independent of the applied electrode voltage, tissues immediately adjacent to the electrode should be sufficiently treated. However, the size of each electrode-induced signal void is dependent on the material used to construct the electrodes (essentially the prime determinant is the magnetic susceptibility of the electrode relative to the adjacent tissues), main magnetic field strength, electrode orientation relative to the main field, pulse sequence used for visualization, and associated sequence parameters. As would be expected, the diameter of the electrode-induced signal voids were much larger on GRE images than on TSE images (approximately 3.5 mm vs 1.5 mm in diameter). For translation to clinical practice, larger diameter electrodes will likely be required, thus increasing the size of anticipated signal voids. Additional studies are clearly warranted to further investigate the size of the induced signal voids relative to ablation zone sizes, particularly for larger clinically relevant IRE electrodes and electrodes constructed of different materials. Ultra-short echo-time sequences (21), gradient-echo section excitation profile imaging techniques (22), and view-angle tilting methods (23) have previously been used to reduce the size of signal voids produced during the placement of percutaneous needles and/or ablation probes during MR imaging–guided biopsy and ablation procedures; these methods should each be similarly applicable in the setting of MR imaging–guided IRE.
While further studies are clearly necessary to fully investigate the contrast mechanisms that produce immediate IRE-induced proton-density-, T2-, and T1-weighted signal changes, we speculate that these may be the result of local fluid accumulation owing to transient permeablization of blood vessels, with subsequent fluid build-up after rapid extravasation into the treated tissue zones. These IRE-induced signal alterations (ie, hyperintense zones on proton-density- and T2-weighted images and hypointense zones on T1-weighted images) were consistent with classic proton-density, T1, and T2 relaxation increases typically observed during acute episodes of tissue edema (24–27). In a prior in vivo electropermeabilized skeletal muscle study, the formation of edema was qualitatively confirmed by phase contrast photomicrographs of H-E–stained samples (28). Our findings are consistent with previous gene therapy electrotransfer studies, which similarly apply high-voltage electric pulses to permeabilize cell membranes, during which muscle tissue edema was visualized as hyperintense regions on T2-weighted images (4,29).
MR imaging measurements of ablation zone sizes at 1500 V were somewhat larger for T1-weighted images than for corresponding T2-weighted images. The reason for this discrepancy is currently unclear. One possible source of error may have simply been misregistration of section positions between the separate measurements on T1- and T2-weighted images during these free-breathing in vivo studies. Another possibility is that the T1-weighted signal changes at this particular applied voltage level occurred both within the irreversibly electroporated central ablation zone and in an outer surrounding region of reversibly electroporated tissue. Further studies are necessary to rigorously investigate the mechanism or mechanisms that may have lead to these aforementioned differences.
Our study had several limitations. While histologic measurements were highly correlated with intraprocedural MR imaging measurements of the IRE ablation zones, a variable level of discrepancy between these measurements was clearly evident. However, these discrepancies were not entirely unexpected given the difficulties associated with correlating in vivo imaging results to histologic measurements at delayed intervals after therapy. Coregistration of these measurements was quite difficult given that the IRE electrodes, which served as our fiducial markers during the MR imaging, were removed and the surgical incisions were closed to allow the animals to survive 24 hours prior to necropsy. These delays between imaging and histologic measurements were critically necessary given that IRE-induced tissue necrosis does not occur until roughly 12–24 hours after therapy. Future preclinical correlation studies in the setting of IRE therapy may benefit from the use of surgically-implanted permanent fiducial markers to avoid such complications.
An additional limitation of our study was that IRE procedures were performed in normal liver parenchyma as opposed to hepatic tumor tissues. Future studies will be critical to confirm similar findings in hepatic tumor tissues and compare long-term IRE treatment outcomes with intraprocedural MR imaging measurements. Alternative functional imaging methods, such as diffusion-weighted MR imaging (30) or dynamic contrast-enhanced MR imaging (31,32), may also prove effective for in vivo quantification of the IRE ablation zones. However, owing to the strong magnetic susceptibility differences between electrodes and surrounding tissues, conventional single-shot diffusion-weighted sequences may be ineffective, and owing to requisite limits on contrast agent dose, contrast-enhanced methods may be more effective for follow-up studies than for intraprocedural monitoring that requires repeated measurements. Additional functional and quantitative MR imaging studies are clearly warranted to further investigate the potential for more accurate discrimination between treated and untreated IRE ablation zones.
Practical application: We have demonstrated that MR imaging measurements can be used to immediately depict IRE ablation zones within the liver. MR imaging has the potential to serve as both a real-time guidance tool for selective placement of IRE electrodes and an intraprocedural monitoring tool to immediately assess tissue response to IRE pulses. These intraprocedural measurements could be used to elicit repeat application of the IRE pulses or adjustments to electrode position, as needed, to ensure complete treatment of targeted lesion or lesions.
Advance in Knowledge.
MR imaging measurements with electrodes in place can be used to immediately depict irreversible electroporation (IRE) ablation zones within targeted liver tissues.
Implication for Patient Care.
MR imaging monitoring offers the potential to permit intraprocedural optimization of IRE procedures to ensure complete ablation of targeted tissue volumes.
Received October 19, 2009; revision requested December 15; revision received January 22, 2010; accepted February 5; final version accepted February 17.
The contents of this article are solely the responsibility of the authors and do not necessarily represent the official view of the National Center for Research Resources or the National Institutes of Health.
Funding:This research was supported by the National Cancer Institute (grant CA134719), the National Center for Research Resources (grant UL1 RR025741), and the National Institutes of Health Roadmap for Medical Research.
Authors stated no financial relationship to disclose.
Abbreviations:
- FEM
- finite element modeling
- GRE
- gradient-recalled echo
- H-E
- hematoxylin-eosin
- IRE
- irreversible electroporation
- TSE
- turbo spin echo
References
- 1.Neumann E, Rosenheck K. Permeability changes induced by electric impulses in vesicular membranes. J Membr Biol 1972;10(3):279–290 [DOI] [PubMed] [Google Scholar]
- 2.Paunesku T, Ke T, Dharmakumar R, et al. Gadolinium-conjugated TiO2-DNA oligonucleotide nanoconjugates show prolonged intracellular retention period and T1-weighted contrast enhancement in magnetic resonance images. Nanomedicine 2008;4(3):201–207 [DOI] [PMC free article] [PubMed] [Google Scholar]
- 3.Leroy-Willig A, Fromes Y, Paturneau-Jouas M, Carlier P. Assessing gene and cell therapies applied in striated skeletal and cardiac muscle: is there a role for nuclear magnetic resonance? Neuromuscul Disord 2003;13(5):397–407 [DOI] [PubMed] [Google Scholar]
- 4.Leroy-Willig A, Bureau MF, Scherman D, Carlier PG. In vivo NMR imaging evaluation of efficiency and toxicity of gene electrotransfer in rat muscle. Gene Ther 2005;12(19):1434–1443 [DOI] [PubMed] [Google Scholar]
- 5.Okino M, Mohri H. Effects of a high-voltage electrical impulse and an anticancer drug on in vivo growing tumors. Jpn J Cancer Res 1987;78(12):1319–1321 [PubMed] [Google Scholar]
- 6.Heller R, Gilbert R, Jaroszeski MJ. Clinical applications of electrochemotherapy. Adv Drug Deliv Rev 1999;35(1):119–129 [DOI] [PubMed] [Google Scholar]
- 7.Rubinsky B, Onik G, Mikus P. Irreversible electroporation: a new ablation modality—clinical implications. Technol Cancer Res Treat 2007;6(1):37–48 [DOI] [PubMed] [Google Scholar]
- 8.Lee EW, Loh CT, Kee ST. Imaging guided percutaneous irreversible electroporation: ultrasound and immunohistological correlation. Technol Cancer Res Treat 2007;6(4):287–294 [DOI] [PubMed] [Google Scholar]
- 9.Edd JF, Horowitz L, Davalos RV, Mir LM, Rubinsky B. In vivo results of a new focal tissue ablation technique: irreversible electroporation. IEEE Trans Biomed Eng 2006;53(7):1409–1415 [DOI] [PubMed] [Google Scholar]
- 10.Onik G, Mikus P, Rubinsky B. Irreversible electroporation: implications for prostate ablation. Technol Cancer Res Treat 2007;6(4):295–300 [DOI] [PubMed] [Google Scholar]
- 11.Edd JF, Davalos RV. Mathematical modeling of irreversible electroporation for treatment planning. Technol Cancer Res Treat 2007;6(4):275–286 [DOI] [PubMed] [Google Scholar]
- 12.Lewin JS, Connell CF, Duerk JL, et al. Interactive MRI-guided radiofrequency interstitial thermal ablation of abdominal tumors: clinical trial for evaluation of safety and feasibility. J Magn Reson Imaging 1998;8(1):40–47 [DOI] [PubMed] [Google Scholar]
- 13.Quesson B, de Zwart JA, Moonen CT. Magnetic resonance temperature imaging for guidance of thermotherapy. J Magn Reson Imaging 2000;12(4):525–533 [DOI] [PubMed] [Google Scholar]
- 14.Butts K, Sinclair J, Daniel BL, Wansapura J, Pauly JM. Temperature quantitation and mapping of frozen tissue. J Magn Reson Imaging 2001;13(1):99–104 [DOI] [PubMed] [Google Scholar]
- 15.Fleckenstein JL, Chason DP, Bonte FJ, et al. High-voltage electric injury: assessment of muscle viability with MR imaging and Tc-99m pyrophosphate scintigraphy. Radiology 1995;195(1):205–210 [DOI] [PubMed] [Google Scholar]
- 16.Lee RC, Despa F. Distinguishing electroporation from thermal injuries in electrical shock by MR imaging. Conf Proc IEEE Eng Med Biol Soc 2005;6:6544–6546 [DOI] [PubMed] [Google Scholar]
- 17.Gissel H, Despa F, Collins J, et al. Magnetic resonance imaging of changes in muscle tissues after membrane trauma. Ann N Y Acad Sci 2005;1066:272–285 [DOI] [PubMed] [Google Scholar]
- 18.Davalos RV, Mir IL, Rubinsky B. Tissue ablation with irreversible electroporation. Ann Biomed Eng 2005;33(2):223–231 [DOI] [PubMed] [Google Scholar]
- 19.Haemmerich D, Staelin ST, Tsai JZ, Tungjitkusolmun S, Mahvi DM, Webster JG. In vivo electrical conductivity of hepatic tumours. Physiol Meas 2003;24(2):251–260 [DOI] [PubMed] [Google Scholar]
- 20.Miklavcic D, Semrov D, Mekid H, Mir LM. A validated model of in vivo electric field distribution in tissues for electrochemotherapy and for DNA electrotransfer for gene therapy. Biochim Biophys Acta 2000;1523(1):73–83 [DOI] [PubMed] [Google Scholar]
- 21.Josan S, Pauly JM, Daniel BL, Pauly KB. Double half RF pulses for reduced sensitivity to eddy currents in UTE imaging. Magn Reson Med 2009;61(5):1083–1089 [DOI] [PubMed] [Google Scholar]
- 22.Yang QX, Williams GD, Demeure RJ, Mosher TJ, Smith MB. Removal of local field gradient artifacts in T2*-weighted images at high fields by gradient-echo slice excitation profile imaging. Magn Reson Med 1998;39(3):402–409 [DOI] [PubMed] [Google Scholar]
- 23.Butts K, Pauly JM, Gold GE. Reduction of blurring in view angle tilting MRI. Magn Reson Med 2005;53(2):418–424 [DOI] [PubMed] [Google Scholar]
- 24.Schmidt HC, Tsay DG, Higgins CB. Pulmonary edema: an MR study of permeability and hydrostatic types in animals. Radiology 1986;158(2):297–302 [DOI] [PubMed] [Google Scholar]
- 25.Gwan K, Edzes HT. Water in brain edema: observations by the pulsed nuclear magnetic resonance technique. Arch Neurol 1975;32(7):462–465 [DOI] [PubMed] [Google Scholar]
- 26.Naruse S, Horikawa Y, Tanaka C, Hirakawa K, Nishikawa H, Yoshizaki K. Proton nuclear magnetic resonance studies on brain edema. J Neurosurg 1982;56(6):747–752 [DOI] [PubMed] [Google Scholar]
- 27.Herfkens RJ, Sievers R, Kaufman L, et al. Nuclear magnetic resonance imaging of the infarcted muscle: a rat model. Radiology 1983;147(3):761–764 [DOI] [PubMed] [Google Scholar]
- 28.Collins JM, Despa F, Lee RC. Structural and functional recovery of electropermeabilized skeletal muscle in-vivo after treatment with surfactant poloxamer 188. Biochim Biophys Acta 2007;1768(5):1238–1246 [DOI] [PMC free article] [PubMed] [Google Scholar]
- 29.Paturneau-Jouas M, Parzy E, Vidal G, et al. Electrotransfer at MR imaging: tool for optimization of gene transfer protocols—feasibility study in mice. Radiology 2003;228(3):768–775 [DOI] [PubMed] [Google Scholar]
- 30.Chen J, Daniel BL, Diederich CJ, et al. Monitoring prostate thermal therapy with diffusion-weighted MRI. Magn Reson Med 2008;59(6):1365–1372 [DOI] [PubMed] [Google Scholar]
- 31.Su MY, Samoszuk MK, Wang J, Nalcioglu O. Assessment of protamine-induced thrombosis of tumor vessels for cancer therapy using dynamic contrast-enhanced MRI. NMR Biomed 2002;15(2):106–113 [DOI] [PubMed] [Google Scholar]
- 32.Viglianti BL, Lora-Michiels M, Poulson JM, et al. Dynamic contrast-enhanced magnetic resonance imaging as a predictor of clinical outcome in canine spontaneous soft tissue sarcomas treated with thermoradiotherapy. Clin Cancer Res 2009;15(15):4993–5001 [DOI] [PMC free article] [PubMed] [Google Scholar]


