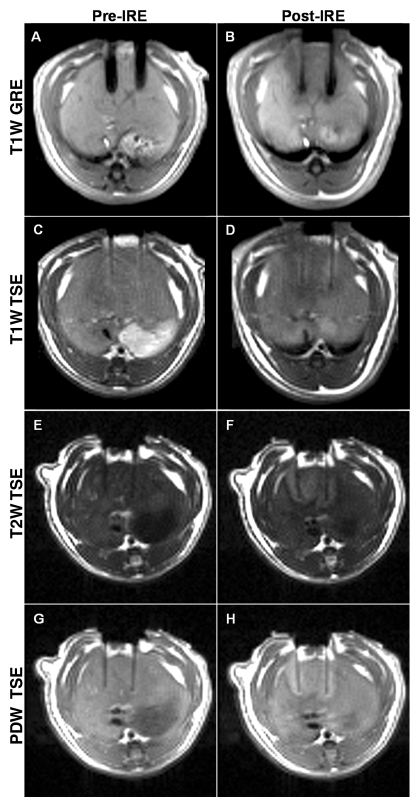
Figure 2:
Representative MR images acquired parallel to the electrodes before (Pre-IRE) and immediately after (Post-IRE) IRE with 2500-V pulses. A, B, T1-weighted (T1W) GRE images; C, D, T1-weighted TSE images; E, F, T2-weighted (T2W) TSE images; G, H, proton-density-weighted (PDW) TSE images. Bipolar electrode positions are depicted as signal voids. Ablation zones are hypointense on T1-weighted images and hyperintense on both T2- and proton-density-weighted images.

