

Abstract
The origin, evolution, and functional relevance of genomic variations in GC content are a long-debated topic, especially in mammals. Most of the existing literature, however, has focused on a small number of model species and/or limited sequence data sets. We analyzed more than 1000 orthologous genes in 33 fully sequenced mammalian genomes, reconstructed their ancestral isochore organization in the maximum likelihood framework, and explored the evolution of third-codon position GC content in representatives of 16 orders and 27 families. We showed that the previously reported erosion of GC-rich isochores is not a general trend. Several species (e.g., shrew, microbat, tenrec, rabbit) have independently undergone a marked increase in GC content, with a widening gap between the GC-poorest and GC-richest classes of genes. The intensively studied apes and (especially) murids do not reflect the general placental pattern. We correlated GC-content evolution with species life-history traits and cytology. Significant effects of body mass and genome size were detected, with each being consistent with the GC-biased gene conversion model.
The mammalian genome is characterized by its high spatial heterogeneity in base composition. The average GC content of a 100-kb fragment of the human genome can be as low as 35% or as high as 60%, a range that is twice as wide as that typically observed in teleostean fishes, for instance (International Human Genome Sequencing Consortium 2001). This property of the human genome, identified in the pre-genomic era (Bernardi et al. 1985), was called the “isochore structure.” The discovery of isochores immediately raised questions as to the reasons for their existence. How did isochores originate? How have they been maintained? Are they adaptive or merely the consequence of neutral evolutionary processes? These questions are important because GC content in mammals is correlated with a number of genomic features that are potentially relevant from a functional viewpoint, for example, gene density, transposable element distribution, methylation rate, recombination rate, and expression levels (Eyre-Walker and Hurst 2001; Kudla et al. 2006).
To further investigate these issues, a comparative approach was undertaken to characterize the evolutionary dynamics of isochores. At the vertebrate level, human-like isochores were reported in sauropsids (birds and “reptiles”) (Hughes et al. 1999; International Chicken Genome Sequencing Consortium 2004; Kuraku et al. 2006), but not in teleostean fishes and lissamphibians (Bernardi and Bernardi 1990), suggesting that compositional heterogeneity evolved in the amniote ancestor. Within mammals, it was established early that mouse and rat genomes have a substantially more homogeneous GC content than the human genome (Mouchiroud et al. 1988). Phylogenetic analyses suggested that the ancestral placental genome structure was probably close to the human pattern, with the homogeneous mouse and rat pattern being the derived state (Galtier and Mouchiroud 1998). Duret et al. (2002) and Belle et al. (2004) confirmed this result and proposed that the GC-richest components of the mammalian genome have been eroded in rodents, but also to various extents in primates, artiodactyls, and marsupials. This view is debatable. Alvarez-Valin et al. (2004) suggested that the detected erosion of isochores in Duret et al. (2002) was due to methodological bias. Li et al. (2008) reproduced the results of Belle et al. (2004), but reported that there apparently has been no erosive trend in lagomorphs.
The above-reviewed studies used the third-codon positions of aligned coding sequences to characterize genomic GC-content evolution. GC3 (third-codon position GC content) is strongly correlated with the flanking GC content in humans (Mouchiroud et al. 1988). This is a convenient measure because orthologous genes are reasonably easy to identify, align, and compare across mammals. Sequence analysis of repeated elements—an independent source of data—provided a similar picture of GC-content evolution in placental mammals (Arndt et al. 2003; Webster et al. 2005), namely, a decline in GC content in the GC-richest regions of the genome, thus strengthening the erosion hypothesis. All of this literature, however, was based on just a handful of model species, with the main focus being on the human versus mouse comparison.
In addition to this exploration of GC-content dynamics of genomes, progress has been made in our understanding of the underlying evolutionary forces. Bernardi et al. (1985) first claimed that isochores were an adaptation to endothermy, but the discovery of a similar structure in cold-blooded amniotes (Hughes et al. 1999) disqualified this proposal (see also Belle et al. 2002; Ream et al. 2003). Subsequent selective scenarios invoking a higher stability of RNA and proteins in the GC-rich context (Bernardi 2007) have received no empirical support and have failed to explain the spatial heterogeneity in GC content. Neutral processes therefore attracted attention. Wolfe et al. (1989) proposed that the point mutation process could be GC-biased in some regions of the genome, and AT-biased in others in relation with replication timing. Although replication origins were locally associated with spatial shifts in base composition (Watanabe et al. 2002; Schmegner et al. 2007), this effect would probably not account for the genome-wide distribution in GC content (Eyre-Walker and Hurst 2001).
Over the last decade, an alternative hypothesis potentially explaining GC-content evolution in mammals has been examined: GC-biased gene conversion (gBGC) (Galtier et al. 2001; Webster et al. 2005; Duret and Galtier 2009). According to this model, a bias in the DNA repair machinery would result in meiotic distortion favoring G and C over A and T alleles in highly recombining regions (Eyre-Walker 1993; Galtier et al. 2001). Indirect empirical evidence supporting the gBGC hypothesis has accumulated: GC-biased pattern of allele segregation at polymorphic sites in humans and mice (Eyre-Walker 1999; Webster and Smith 2004), especially in high-recombining regions (Spencer 2006); recombination-driven increase in GC content in primates (Meunier and Duret 2004), mice (Montoya-Burgos et al. 2003), and birds (Webster et al. 2006); and GC-content increase in genes undergoing ectopic gene conversion (Galtier 2003; Kudla et al. 2004). Duret and Arndt (2008) showed that the gBGC model correctly predicts genome-wide patterns of nucleotide substitution in humans, given the available information on recombination rates in this species. Although the evidence is compelling (Duret and Galtier 2009), note again that most of these studies were conducted in hominid primates or murid rodents, i.e., just two mammalian families. Hence, interpreting the isochore dynamics in terms of spatiotemporal variations in gBGC strength would currently be highly speculative.
Insufficient taxonomic sampling is therefore an obvious limitation of current studies on isochores. The findings of previous studies, in which just six to eight genomes were typically analyzed, could not link GC-content evolution to species biology, ecology, or cytology, so there is still no convincing explanation for the observed diversity. We do not know why isochores are being eroded and whether this pattern applies to all mammals, especially since the single potential GC-driving force for which we have arguments, i.e., gBGC, has been documented in only two groups. This study was designed to clarifying the evolutionary dynamics of GC content in placental mammals through an analysis of 1138 orthologous genes and their flanking regions from 33 fully sequenced genomes. We reconstructed—in a time-heterogeneous maximum-likelihood framework—the distribution of GC3 in the placental ancestral genome, characterized its evolution in representatives of 16 orders and 27 families, and correlated GC-content dynamics with species life-history traits and karyotypes. Our results substantially modify the current view of isochore dynamics in mammals. We show that erosion is not a general rule, while revealing highly diverse trends across lineages and investigating evolutionary processes that could potentially explain these variations.
Results
GC3 dynamics in placental mammals
Table 1 provides the main characteristics of the GC3 distribution across 1138 genes for each of the 33 analyzed species (Fig. 1), plus the reconstructed GC3 of the most recent common ancestor of placental mammals. The mean and standard error of the distribution varied substantially among species. The GC3 distribution in the ancestral placental appeared to be quite similar to that of humans, and much more heterogeneous than in mice, thus confirming previous study findings. Table 1, however, reveals that the newly sampled placental groups had distinctive patterns. The tenrec and shrew genomes, for instance, appeared to be substantially more GC-rich than the ancestral one, and more heterogeneous. The non-placental platypus (Monotremata) and opossum (Marsupialia) were the GC-richest (57.89%) and GC-poorest (43.89%) (on average), respectively, of all the analyzed genomes. The pattern diversity is illustrated in Figure 2, which displays the observed distribution of GC3 in three representative species (human, mouse, tenrec) compared to the estimated ancestral distribution.
Table 1.
Characteristics of the distribution of GC3 across 33 species and 1138 genes

aSpecies name abbreviations used in all figures.
bThe squared correlation coefficient between GC3 and flanking GC content.
Figure 1.

Genomic third-codon position GC-content (GC3) evolution in placental mammals. Colors reflect current or estimated average GC3 on 1138 orthologous genes (green, low GC; yellow, medium GC; red, high GC). current or estimated average GC3 on 1138 orthologous genes. Branch lengths quantify the amount of GC3 divergence: the branch connecting nodes i and j has a length proportional to Di,j (Equation 2). The estimated ancestral GC content of the placental ancestor is 46.2%.
Figure 2.

Gene GC-content distribution in three representative placental species. (A) Third-codon position GC content (GC3); (B) 5′- and 3′-flanking GC content. (Curved line) Estimated GC distribution of the common placental ancestor. (Gray histogram) Observed distributions of extant species. As compared to the estimated ancestral state, humans show a conservative pattern, tenrecs (Echinops telfairi) a global enrichment in GC, and mice (Mus musculus) a decreased variance in GC across genes.
It is noteworthy that the strength of the isochore structure, as measured by the standard deviation of GC3 across genes, was positively correlated with the species average GC3 (Fig. 3; ρ = 0.42, P-value < 0.05). With the exception of mouse and rat, which behaved very differently from other placentals in this respect, GC-rich species tended to show high variance in genomic GC3. Consistent with previous findings, in humans and apes there was a moderate decline in the standard deviation of GC3 across genes (9.7%), whereas this decline was substantial in mouse (7.8%) and rat (7.5%) as compared to the estimated ancestral value (10.6).
Figure 3.

Relationship between genomic average and standard deviation of GC3.
The various levels of GC3 divergence since the placental ancestor are represented in Figure 1. Colors in this figure reflect current or estimated average GC3, and branch lengths quantify the amount of GC3 divergence—the length of the branch connecting nodes i and j is proportional to Di,j (see Methods, Equation 2). Figure 1 shows the existence of lineages in which the transcriptome-wide GC3 had evolved slowly (e.g., apes, horse, armadillo) since the placental ancestor, and of lineages showing elevated amounts of GC3 divergence. Among the latter, muroid rodents (mouse, rat), as well as kangaroo rat, guinea pig, and hedgehog, showed a limited change in average GC3. In these species, gene-specific GC3 tended to diverge quickly, but the average was moderately affected, with the decrease in some genes somehow compensating for the increase in some others. Several species, finally, showed both a gene-by-gene (Di,j) and collective increase in GC3—this pattern has yet to be documented. This was observed in shrew, microbat, tenrec, and lagomorphs, i.e., four phylogenetically distant lineages of placental mammals. Notably, no marked decrease in average GC3 was noted among the 31 placental species examined.
The contrasted dynamics across species are represented in Figure 4. In this figure, genes were divided into five bins according to their ancestral GC3. For each placental species i and each category of genes, the average GC3 was calculated and plotted against Di,anc, i.e., the amount of gene GC3 divergence since the ancestor. The average ancestral GC3 of each bin is represented as a vertical dotted line. Figure 4 shows that an increase in GC3 was the most common evolutionary trend in placentals. This is especially true of ancestrally GC3-poorest genes, but also involved the GC3-medium and, in some species, GC3-rich categories. The previously documented erosion of GC-rich isochores was only detected from the 20% GC3-richest genes (rightmost graph), and this erosive process, which we confirmed in hominid primates and muroid rodents, was not a general trend. In several species (tenrec, shrew, microbat, rabbit), even the 20% ancestrally GC3-richest genes had undergone an increase in average GC3 since the placental ancestor. Figure 4 also revealed a highly specific pattern in mouse and rat: Their GC3-poorest genes were highly GC3-enriched, and their GC3-richest genes very GC3-depleted. This was reflected by the remarkably low standard deviation of GC3 distribution in these two species (Table 1).
Figure 4.

GC3 dynamics in GC3-rich versus GC3-poor genes. Genes are divided into five categories, depending on their ancestral GC3%. Blue, green, orange, red, and brown are used from the least GC-rich to the most GC-rich categories. Within each category, the average GC3 of each placental species is plotted against Di,anc (i.e., the average amount of GC3 divergence among the 1138 genes since the placental ancestor). Dotted lines represent the average ancestral GC3 within each category.
It should be noted that the method used here to estimate ancestral GC3 did not account for the hypermutability of CpG doublets, which is known to significantly impact the nucleotide substitution process in mammals. To account for this potential bias, we replicated the analysis after removing from the data set the third-codon positions immediately flanked by a 5′ C or a 3′ G in >50% of the species. The remaining sites, representing 67.2% of the original data set, were presumably only weakly affected by the CpG effect. Despite a general decline in all GC3 values (by ∼2%), highly similar trends were observed, i.e., a global GC3 enrichment since the last common placental ancestor. Similarly, Belle et al. (2004) showed, by simulations, that NHML estimates of ancestral GC content were only slightly affected by CpG hypermutability.
Causes of GC3 enrichment
We investigated evolutionary forces that could potentially account for this diversity of patterns by correlating the GC3 dynamics with several life-history and cytologic variables across the 33 species of the data set. Within placentals, we found a significant negative correlation between average GC3 and (log-transformed) body mass (ρ = −0.44, P-value = 0.013), and between Di,anc and body mass (ρ = −0.69, P-value < 10−4; Fig. 5). Similar trends were noted when we correlated GC3 and Di,anc with species longevity (ρ = −0.58, P-value < 10−4; ρ = −0.73, P-value < 10−4, respectively), age of sexual maturity, and gestation time (data not shown). The latter trends reflect high positive correlations between body mass and these variables. Small-sized placentals tended to evolve faster with respect to GC3, and the main trend was toward an increase in average GC3 in fast-evolving genomes.
Figure 5.

Relationship between adult body mass and GC3 (left) and Di,anc (right).
All of these correlations remained significant when phylogenetic inertia was regressed out of the analysis. Spearman correlation coefficients were −0.40 (P-value = 0.028), −0.52 (P-value = 0.0037), and −0.51 (P-value = 0.0067) for the GC3/body mass, Di,anc/body mass, and GC3/genome size relationships, respectively, after phylogenetic correction. It can be noted from Figure 1 that the body size effect was detectable even within orders and superorders. Within afrotherians, for instance, tenrec evolved faster and was GC3-richer than elephant, with hyrax being intermediate. A similar trend was found within primates (“monkeys” faster than apes), cetartiodactyls (bovids and camelids faster than cetaceans), Chiroptera (microbats faster than megabats), and Eulipotyphla (shrews faster than hedgehogs). The pattern was only less clearcut in rodents, but body mass was also less contrasted in this group.
Karyotypes, and especially chromosome length, have been connected to GC-content evolution in various vertebrate taxa (International Human Genome Sequencing Consortium 2001; International Chicken Genome Sequencing Consortium 2004; Kuraku et al. 2006), with chromosome length being inversely related to the recombination rate (Li and Freudenberg 2009), hence to gBGC. Chromosome length data, however, were only available for a limited number of taxa included in this study. We thus tried to indirectly approach the relationship by linking GC3 dynamics to the current number of chromosome arms in each species, under the assumption that more fragmented genomes should contain shorter chromosomes on average. We found that, consistent with the hypothesis of chromosome length-driven GC-content evolution, platypus (2n = 54, 104 chromosome arms) was the GC3-richest, and opossum (2n = 18, 20 chromosome arms) the GC3-poorest, on average, of the 33 analyzed mammals, as also previously documented (Goodstadt et al. 2007; Warren et al. 2008). Placentals showed an intermediate number of chromosome arms, and an intermediate average GC3. However, no significant relationship was detected between these two variables within placentals.
The above rationale is based on the implicit assumption of a constant genome size across species. Alternatively, one could suppose that small genomes tend to have short chromosomes, and large genomes long chromosomes, while assuming a relatively constant genome fragmentation level (i.e., diploid number) across lineages. We found a significant negative correlation between genome size (measured by the C-value) and average GC3 (ρ = −0.48, P-value = 0.01; Fig. 6), which was robust to phylogenetic control (ρ = −0.51, P-value < 0.01). The correlation remained marginally significant when we excluded platypus and opossum (ρ = −0.37, P-value = 0.06).
Figure 6.

Relationship between genome size and GC3.
Flanking gene regions
To check whether the GC3 analyses reflected genome-wide patterns, we analyzed noncoding sequences flanking the 1138 genes of this study. We first calculated, for each species, the correlation, across genes, between GC3 and the GC content of 100-kb-long flanking regions (50 kb each side). For all species, highly significant correlations were found (P-value < 0.001) (see r2 values in Table 1). Then ancestral GC-content analyses were performed using 1460 alignments (each longer than 300 bp) of noncoding flanking regions of our genes. The observed and estimated GC-content distributions across flanking regions confirmed the main trends of the GC3 analysis (Fig. 2B; Supplemental Table 1), the positive correlation between the average and standard deviation in GC content (ρ = 0.42, P-value < 0.05), and the negative correlation between GC content and species longevity (average GC content: ρ = −0.46, P-value = 0.01; Di,anc: ρ = −0.8, P-value < 0.0001) and genome size (ρ = −0.46, P-value = 0.016).
Discussion
In this study, we analyzed GC-content evolution in 1138 genes across 33 mammalian species, reconstructed the ancestral distribution of GC3, and characterized isochore evolution in distinct lineages. In line with previous reports, we found that the estimated ancestral placental GC3 distribution was close to the current one in humans. Apes have evolved relatively slowly since the common placental ancestor as far as GC3 is concerned, and this trend also applies to other large-sized species (e.g., elephant, xenarthrans, horse, cow, dolphin). GC3 evolved more rapidly in smaller mammals (e.g., rabbit, tenrec, rodents, shrew, microbat), and the main trend was an increased average GC3, and more structured isochores, in these fast-evolving lineages.
Genomic and taxonomic sampling
The so-called erosion of GC-rich isochores (GC3-decrease of GC3-rich genes) was documented as a major process in previous studies of GC-content dynamics in mammals (Duret et al. 2002; Arndt et al. 2003; Belle et al. 2004). Our findings, in contrast, suggested that the erosion of GC-rich isochores is not a general process: It apparently affected a limited set of placental mammals, and only the top 20% GC-richest genes of the genome. Our larger sample size, both at taxonomic (33 mammals) and genomic (more than 1000 genes) levels, could likely explain the difference between our findings and those of previous studies. Previous works typically analyzed a small number of taxa and focused on model organisms such as humans and mice, which turned out to undergo detectable erosion (Fig. 4). Belle et al. (2004), furthermore, used a set of 41 genes available at that time, which actually appeared to be biased toward GC-rich genes (mean GC3: 62.96), as compared to our 1138-gene data set (mean GC3: 48.08). This also applies to the data set of Gu and Li (2006), which was similarly enriched in GC-rich genes (178 genes, mean GC3: 62.95). This explains why the detected erosive trend appeared more prevalent to Belle et al. (2004) and Gu and Li (2006) than it did here—although we confirmed it in apes and murids. This work, therefore, emphasizes the importance of large numbers of species and genes in evolutionary genomics.
Along the same lines, we noted that the pattern observed in mouse and rat, often taken as reference genomes in comparative studies, appeared to be highly unusual among placental mammals. These species were the only ones in this data set for which decreased variance of GC3 across genes was observed despite the fast evolution rate. Ground squirrel (Spermophilus tridecemlineatus) also stands as an exception: Despite its small size (body mass: 0.17 kg), it behaved as a large organism with respect to GC3. It should be noted, however, that Sciuridae, and especially Marmotini, include relatively large species of rodents, like prairie dogs (1 kg) and marmots (up to 7 kg), which are close relatives to S. tridecemlineatus (Herron et al. 2004). This suggests that the terminal branch leading to ground squirrels in Figure 1 actually corresponds to medium-sized ancestors, thus perhaps explaining the slow evolutionary rate in this lineage.
Karyotypic correlates
Thanks to the substantial number of genomes analyzed in this study, for the first time we were able to correlate GC3 evolution with various species characteristics. We report a negative correlation between GC3 (or Di,anc) and body mass (or longevity, or age of sexual maturity), and a negative correlation between GC3 and genome size. We noted that GC3 and Di,anc reflected long-term evolutionary processes, and had been influenced by the (unknown) properties of ancestral species, when we can only observe extant species. We conclude that the true biological relationships between GC-content evolution and species biology/cytology are probably even closer than measured here.
The reported GC3 increase in small genomes and the specific patterns found in marsupials and monotremes are consistent with the relationship between chromosome length and GC content observed in humans and chicken, and predicted by the gBGC model. In every meiosis, each chromosome arm undergoes at least one (and not many more than one) crossover, which is probably required for proper meiotic segregation. This results in a higher per-megabase recombination rate in short than in long chromosomes, with gBGC thus having a greater impact on short chromosomes (e.g., Montoya-Burgos et al. 2003). Observing a relationship between GC3 and genome size (our best estimate of long-term average chromosome length) across 33 mammals strongly suggests that gBGC is a general process in this group, not a unique feature of hominid primates and murine rodents. Greater insight into this process will be gained by correlating GC-content dynamics to karyotypic evolution in placental mammals—chromosomal maps are currently available for just a handful of fully assembled mammalian genomes.
The combination of chromosome arm number and genome size analyses suggested that chromosomes were rearranged at a relatively fast rate in placental mammals, consistent with the high amount of karyotypic variation observed among species. The diploid number, for instance, ranged from 22 to 80 across species sampled in this study, and was as low as six in muntjak (Muntiacus muntjak, Cervidae, Cetartiodactyla), and as high as 88 in the western pocket gopher (Thomomys bottae, Geomyidae, Rodentia). The diploid number could evolve very rapidly in placental mammals, as illustrated by the observation of very different numbers among species of the same genus, for example, 2n = 18 in Microtus oregoni versus 2n = 62 in Microtus duodecimcostatus, i.e., two vole species that diverged less than 5 million yr ago (Galewski et al. 2006). The current chromosome number is therefore probably not a reliable estimate of the long-term average genome fragmentation level. Marsupials and monotremes, in contrast, appear to have a relatively stable karyotypic structure (Wrigley and Graves 1988). The diploid number ranges from 12 to 22 across the 39 marsupial species available in the Genome Size Database, and is high (54 in platypus, 64 in echidna) in the two available monotremes. Karyotypic stability might explain why these two taxa fit predictions regarding GC content and chromosome number better than placentals, since it takes a long time for GC content to reach equilibrium following a change in chromosome size. In line with this hypothesis, the chromosome length/GC content relationship is especially close in chicken (International Chicken Genome Sequencing Consortium 2004), and a very high level of karyotypic conservation has been documented in birds (Griffin et al. 2007).
Another explanation for the relationship between genome size and GC content could be a potential effect of gBGC on genome size. Indeed, GC-rich isochores are characterized by a high gene density, and it was noted that the marked increase in GC content in the mouse Fxy gene after its translocation into the high-recombining pseudoautosomal region was accompanied by large deletions within its introns (Montoya-Burgos et al. 2003). GC-rich sequences could be generally prone to deletions, for example, because sequences of extreme base composition might trigger replication slippage. Under this (still speculative) hypothesis, gBGC could indirectly promote the deletion of noncoding DNA sequences.
Life-history correlates
The relationship between body mass and GC3 evolution is not as easy to interpret, since body mass may be correlated with a number of potentially relevant variables. First, body mass could affect molecular evolution through generation time. Small mammals tend to have more generations per time unit than larger ones, resulting in a higher per unit time mutation rate, and therefore a higher propensity for GC3 to diverge during evolution. This effect probably largely explains the Di,anc/body mass relationship—slow-evolving genomes cannot diverge faster than fast-evolving ones—but the mutation rate effect does not explain the trend of an increased average GC3 in small species. Generation time, however, also affects the per-year number of meioses in germline evolution. This could result in a higher per-year recombination rate, hence more effective gBGC, and an increased equilibrium GC content in short-lived species.
Body mass, finally, could affect molecular evolution through its relationship with population size. Analyses of nonsynonymous (dN) versus synonymous (dS) substitution rates revealed a higher dN/dS ratio in large mammals (Nikolaev et al. 2007; Popadin et al. 2007), which was interpreted in terms of effective population size. Natural selection was found to be less efficient in small populations (large animals), in which a number of slightly deleterious nonsynonymous mutations could reach fixation through increased genetic drift. These studies suggested that body mass is a good indicator of the long-term effective population size in mammals. Just like directional selection, gBGC is supposed to be more efficient in large populations. What matters is the product of the effective population size by the recombination rate by the repair bias (Duret and Galtier 2009). So a higher equilibrium GC content and a faster increase in GC content (in nonequilibrium conditions) would be expected in large populations under the gBGC model (Duret and Arndt 2008). It should be noted that the two potential effects of body mass, through generation time and population size, are not mutually exclusive.
GC3 as an isochore marker
In this study, as in many previous ones, GC3 was taken as a proxy for genomic GC content, a strategy that was recently criticized by Elhaik et al. (2009). Analyzing the noncoding, flanking regions of the 1138 genes of this study, we found a significant correlation between GC3 and flanking GC content across genes, and similar evolutionary dynamics for the two data sets. Elhaik et al. (2009) compared GC3 with the GC content of a noncoding window gradually moving away from the focal gene. We suggest that the rapid decline in correlation coefficient they reported reflects the heterogeneous nature (especially) of GC-rich regions at the 5-kb scale (International Human Genome Sequencing Consortium 2001). Our analysis suggested that GC3 is a reasonable marker of local genomic GC content and one that overcomes the problem of whole genome alignment between distantly related species. Interestingly, the GC3/flanking-GC correlation coefficient was especially elevated in species for which a marked increase in GC3 was found (e.g., shrew, bat, tenrec), suggesting that the newly reported GC increase in these species affects the whole genome, not just third-codon positions.
Conclusions
The findings of this analysis modified our view of GC-content dynamics in placental mammals. We showed that the erosion of GC-rich isochores is not a general trend, and that several species, especially small-sized ones, have undergone a substantial increase in gene GC3 over the last 100 million yr. Our results are consistent with the hypothesis of chromosome-length-driven GC-content evolution, in agreement with the gBGC model. We noted, finally, that gBGC was apparently very strong in a number of non-model taxa, for example, Soricidae, Lagomorpha, Chiroptera, and Afrosoricida, which appear to be more suitable than the highly studied murids and hominids for the analysis of the gBGC process, and more generally of molecular evolutionary processes in mammals.
Methods
Sequences, alignments, trees
The 1138 orthologous genes were extracted from the OrthoMam database (release v5) (Ranwez et al. 2007) and corresponded to all CDS available for the 33 mammalian species documented by Ensembl v54. Sequence alignments provided by the database were cleaned with Gblocks (Castresana 2000) to exclude the least conserved regions and select third-codon positions. The well-accepted phylogenetic trees of Nishihara et al. (2006) and Prasad et al. (2008) were used to perform ancestral GC3 estimations (Fig. 1).
For each of the 1138 genes in the study, aligned 5′ and 3′ noncoding flanking regions (5000 bp each with reference to humans) were downloaded from the EPO section of Ensembl v54. These alignments included up to 31 species, but platypus and opossum were not available. Alignments were cleaned with Gblocks (Castresana 2000). The 1460 alignments, which were longer than 300 bp after this step, were kept for subsequent analysis (730 and 730 alignments on the 5′ and 3′ sides, respectively). Sequences including more than 50% missing nucleotides were removed from the alignments.
Estimating ancestral GC3
Alignments of third-codon positions were separately analyzed using the method introduced by Galtier and Gouy (1998), implemented in the NHML and bpp_ML programs (Dutheil and Boussau 2008). This method relies on a nonhomogeneous, nonstationary Markov model of nucleotide substitution to obtain an estimate of ancestral GC content at each internal node of the underlying phylogenetic tree in the maximum likelihood framework. Under this model, each branch of the underlying tree has its own specific equilibrium GC content. Gamma-distributed rates across sites were assumed. The method and program have been validated in a number of biological applications (e.g., Galtier and Mouchiroud 1998; Galtier et al. 1999; Rodríguez-Trelles et al. 2000; Belle et al. 2004; Herbeck et al. 2005; Boussau and Gouy 2006). We focused on the placental ancestral node, with platypus and opossum being used as outgroups, so our analysis was unaffected by the high uncertainty in the GC-content estimation at the mammalian root node (Galtier and Gouy 1998). Gaps and lacking exons were treated as missing data.
Measuring average gene GC3 divergence
For any extant species i, the average amount of GC3 divergence among n genes since the placental ancestor is denoted by Di,anc and measured as:
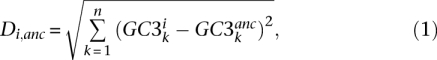 |
where GC3ki is the GC3 observed for gene k, species i, while  is the estimated ancestral GC3 for gene k. Di,anc is the Euclidean distance between the two n-dimension vectors of GC3. Similarly, GC3 divergence between any two nodes i and j of the tree was defined as:
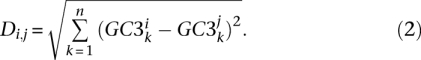 |
Quantitative variables
For each of the 33 species included in the study, karyotypic information was collected from the Atlas of Mammalian Chromosomes (O'Brien et al. 2006) and from the appendix of the study by Pardo-Manuel de Villena and Sapienza (2001). Genome size values (C-value) for 29 of our 33 species were taken from the Animal Genome Size Database (Gregory et al. 2007). When more than one C-value was available for a given species, we took the most recent estimate. The C-value of Myotis lucifugus (microbat) is not documented. It was estimated by the mean C-value of 13 species from the genus Myotis. Data on life history traits (body mass, longevity, sexual maturity) were taken from the AnAge database (de Magalhaes and Costa 2009).
Correlation analyses
Nonparametric Spearman correlation tests between GC3%, life-history traits, and genome size values were performed using R. For each of these tests, a phylogenetic control was performed with the method of independent contrasts (PIC) implemented in the PHYLIP software package (Felsenstein 1995). Parametric Pearson correlation tests between GC3% of the 1138 genes and the GC content of 100-kb-long noncoding flanking regions (50 kb each side) were also performed with R.
Acknowledgments
This work was supported by the French Agence Nationale de la Recherche “Génomique Animale” (ANR-08-GENM-036-01 “CoGeBi”), European Research Council (“PopPhyl”), and by the computer grid of Université Montpellier 2. We thank Kerstin Lindblad-Toh, the Broad Institute, Washington University, and Baylor College of Medicine for giving us permission to analyze unpublished low-coverage mammalian genomes. This publication is contribution number 2010-041 of the Institut des Sciences de l'Evolution de Montpellier (UMR 5554–CNRS).
Footnotes
[Supplemental material is available online at http://www.genome.org.]
Article published online before print. Article and publication date are at http://www.genome.org/cgi/doi/10.1101/gr.104372.109.
References
- Alvarez-Valin F, Clay O, Cruveiller S, Bernardi G 2004. Inaccurate reconstruction of ancestral GC levels creates a “vanishing isochores” effect. Mol Phylogenet Evol 31: 788–793 [DOI] [PubMed] [Google Scholar]
- Arndt PF, Petrov DA, Hwa T 2003. Distinct changes of genomic biases in nucleotide substitution at the time of mammalian radiation. Mol Biol Evol 20: 1887–1896 [DOI] [PubMed] [Google Scholar]
- Belle EM, Smith N, Eyre-Walker A 2002. Analysis of the phylogenetic distribution of isochores in vertebrates and a test of the thermal stability hypothesis. J Mol Evol 55: 356–363 [DOI] [PubMed] [Google Scholar]
- Belle E, Duret L, Galtier N, Eyre-Walker A 2004. The decline of isochores in mammals: An assessment of the GC content variation along the mammalian phylogeny. J Mol Evol 58: 653–660 [DOI] [PubMed] [Google Scholar]
- Bernardi G, Bernardi G 1990. Compositional transitions in the nuclear genomes of cold-blooded vertebrates. J Mol Evol 31: 282–293 [DOI] [PubMed] [Google Scholar]
- Bernardi G 2007. The neoselectionist theory of genome evolution. Proc Natl Acad Sci 104: 8385–8390 [DOI] [PMC free article] [PubMed] [Google Scholar]
- Bernardi G, Olofsson B, Filipski J, Zerial M, Salinas J 1985. The mosaic genome of warm-blooded vertebrates. Science 228: 953–958 [DOI] [PubMed] [Google Scholar]
- Boussau B, Gouy M 2006. Efficient likelihood computations with nonreversible models of evolution. Syst Biol 55: 756–768 [DOI] [PubMed] [Google Scholar]
- Castresana J 2000. Selection of conserved blocks from multiple alignments for their use in phylogenetic analysis. Mol Biol Evol 17: 540. [DOI] [PubMed] [Google Scholar]
- De Magalhaes JP, Costa J 2009. A database of vertebrate longevity records and their relation to other life-history traits. J Evol Biol 22: 1770–1774 [DOI] [PubMed] [Google Scholar]
- Duret L, Arndt PF 2008. The impact of recombination on nucleotide substitutions in the human genome. PLoS Genet 4: e1000071 doi: 10.1371/journal.pgen.1000071 [DOI] [PMC free article] [PubMed] [Google Scholar]
- Duret L, Galtier N 2009. Biased gene conversion and the evolution of mammalian genomic landscapes. Annu Rev Genomics Hum Genet 10: 285–311 [DOI] [PubMed] [Google Scholar]
- Duret L, Semon M, Piganeau G, Mouchiroud D, Galtier N 2002. Vanishing GC-rich isochores in mammalian genomes. Genetics 162: 1837–1847 [DOI] [PMC free article] [PubMed] [Google Scholar]
- Dutheil J, Boussau B 2008. Non-homogeneous models of sequence evolution in the Bio++ suite of libraries and programs. BMC Evol Biol 8: 255 doi: 10.1186/1471-2148-8-255 [DOI] [PMC free article] [PubMed] [Google Scholar]
- Elhaik E, Landan G, Graur D 2009. Can GC content at third-codon positions be used as a proxy for isochore composition? Mol Biol Evol 26: 1829–1833 [DOI] [PubMed] [Google Scholar]
- Eyre-Walker A 1993. Recombination and mammalian genome evolution. Proc Biol Sci 252: 237–243 [DOI] [PubMed] [Google Scholar]
- Eyre-Walker A 1999. Evidence of selection on silent site base composition in mammals: Potential implications for the evolution of isochores and junk DNA. Genetics 152: 675–683 [DOI] [PMC free article] [PubMed] [Google Scholar]
- Eyre-Walker A, Hurst LD 2001. The evolution of isochores. Nat Rev Genet 2: 549–555 [DOI] [PubMed] [Google Scholar]
- Felsenstein J 1995. PHYLIP (phylogeny inference package), version 3.57 c Department of Genetics, University of Washington, Seattle, WA [Google Scholar]
- Galewski T, Tilak MK, Sanchez S, Chevret P, Paradis E, Douzery EJP 2006. The evolutionary radiation of Arvicolinae rodents (voles and lemmings): Relative contribution of nuclear and mitochondrial DNA phylogenies. BMC Evol Biol 6: 80 doi: 10.1186/1471-2148-6-80 [DOI] [PMC free article] [PubMed] [Google Scholar]
- Galtier N 2003. Gene conversion drives GC content evolution in mammalian histones. Trends Genet 19: 65–68 [DOI] [PubMed] [Google Scholar]
- Galtier N, Gouy M 1998. Inferring pattern and process: Maximum likelihood implementation of non-homogeneous model of DNA sequence evolution for phylogenetic analysis. Mol Biol Evol 15: 871–879 [DOI] [PubMed] [Google Scholar]
- Galtier N, Mouchiroud D 1998. Evolution of isochores in mammals: A human-like ancestral pattern. Genetics 150: 1577–1584 [DOI] [PMC free article] [PubMed] [Google Scholar]
- Galtier N, Tourasse NJ, Gouy M 1999. A nonhyperthermophilic common ancestor to extant life forms. Science 283: 220–221 [DOI] [PubMed] [Google Scholar]
- Galtier N, Piganeau G, Mouchiroud D, Duret L 2001. GC-content evolution in mammalian genomes: The biased gene conversion hypothesis. Genetics 159: 907–911 [DOI] [PMC free article] [PubMed] [Google Scholar]
- Goodstadt L, Heger A, Webber C, Ponting CP 2007. An analysis of the gene complement of a marsupial, Monodelphis domestica: Evolution of lineage-specific genes and giant chromosomes. Genome Res 17: 969–981 [DOI] [PMC free article] [PubMed] [Google Scholar]
- Gregory TR, Nicol JA, Tamm H, Kullman B, Kullman K, Leitch IJ, Murray BG, Kapraun DF, Greilhuber J, Bennett MD 2007. Eukaryotic genome size databases. Nucleic Acids Res 35: D332–D338 [DOI] [PMC free article] [PubMed] [Google Scholar]
- Griffin DK, Robertson LB, Tempest HG, Skinner BM 2007. The evolution of the avian genome as revealed by comparative molecular cytogenetics. Cytogenet Genome Res 117: 64–77 [DOI] [PubMed] [Google Scholar]
- Gu J, Li WH 2006. Are GC-rich isochores vanishing in mammals? Gene 385: 50–56 [DOI] [PubMed] [Google Scholar]
- Herbeck JT, Degnan PH, Wernegreen JJ 2005. Nonhomogeneous model of sequence evolution indicates independent origins of primary endosymbionts within the enterobacteriales (gamma-Proteobacteria). Mol Biol Evol 22: 520–532 [DOI] [PubMed] [Google Scholar]
- Herron MD, Castoe TA, Parkinson CL 2004. Sciurid phylogeny and the paraphyly of Holarctic ground squirrels (Spermophilus). Mol Phylogenet Evol 31: 1015–1030 [DOI] [PubMed] [Google Scholar]
- Hughes S, Zelus D, Mouchiroud D 1999. Warm-blooded isochore structure in Nile crocodile and turtle. Mol Biol Evol 16: 1521–1527 [DOI] [PubMed] [Google Scholar]
- International Chicken Genome Sequencing Consortium 2004. Sequence and comparative analysis of the chicken genome provide unique perspectives on vertebrate evolution. Nature 432: 695–716 [DOI] [PubMed] [Google Scholar]
- International Human Genome Sequencing Consortium 2001. Initial sequencing and analysis of the human genome. Nature 409: 860–921 [DOI] [PubMed] [Google Scholar]
- Kudla G, Helwak A, Lipinski L 2004. Gene conversion and GC-content evolution in mammalian Hsp70. Mol Biol Evol 21: 1438–1444 [DOI] [PubMed] [Google Scholar]
- Kudla G, Lipinski L, Caffin F, Helwak A, Zylicz M 2006. High guanine and cytosine content increases mRNA levels in mammalian cells. PLoS Biol 4: e180 doi: 10.1371/journal.pbio.0040180 [DOI] [PMC free article] [PubMed] [Google Scholar]
- Kuraku S, Ishijima J, Nishida-Umehara C, Agata K, Kuratani S, Matsuda Y 2006. cDNA-based gene mapping and GC3 profiling in the soft-shelled turtle suggest a chromosomal size-dependent GC bias shared by sauropsids. Chromosome Res 14: 187–202 [DOI] [PubMed] [Google Scholar]
- Li W, Freudenberg J 2009. Two-parameter characterization of chromosome-scale recombination rate. Genome Res 19: 2300–2307 [DOI] [PMC free article] [PubMed] [Google Scholar]
- Li MK, Gu L, Chen SS, Dai JQ, Tao SH 2008. Evolution of the isochore structure in the scale of chromosome: insight from the mutation bias and fixation bias. J Evol Biol 21: 173–182 [DOI] [PubMed] [Google Scholar]
- Meunier J, Duret L 2004. Recombination drives the evolution of GC-content in the human genome. Mol Biol Evol 21: 984–990 [DOI] [PubMed] [Google Scholar]
- Montoya-Burgos JI, Boursot P, Galtier N 2003. Recombination explains isochores in mammalian genomes. Trends Genet 19: 128–130 [DOI] [PubMed] [Google Scholar]
- Mouchiroud D, Gautier C, Bernardi G 1988. The compositional distribution of coding sequences and DNA molecules in humans and murids. J Mol Evol 27: 311–320 [DOI] [PubMed] [Google Scholar]
- Nikolaev SI, Montoya-Burgos JI, Popadin K, Parand L, Margulies EH 2007. Life-history traits drive the evolutionary rates of mammalian coding and noncoding genomic elements. Proc Natl Acad Sci 104: 20443–20448 [DOI] [PMC free article] [PubMed] [Google Scholar]
- Nishihara H, Hasegawa M, Okada N 2006. Pegasoferae, an unexpected mammalian clade revealed by tracking ancient retroposon insertions. Proc Natl Acad Sci 103: 9929–9934 [DOI] [PMC free article] [PubMed] [Google Scholar]
- O'Brien SJ, Menninger JC, Nash WG 2006. Atlas of mammalian chromosomes, 1st ed Wiley-Liss, New York [Google Scholar]
- Pardo-Manuel de Villena F, Sapienza C 2001. Female meiosis drives karyotypic evolution in mammals. Genetics 160: 1263–1264 [DOI] [PMC free article] [PubMed] [Google Scholar]
- Popadin K, Polishchuk LV, Mamirova L, Knorre D, Gunbin K 2007. Accumulation of slightly deleterious mutations in mitochondrial protein-coding genes of large versus small mammals. Proc Natl Acad Sci 104: 13390–13395 [DOI] [PMC free article] [PubMed] [Google Scholar]
- Prasad AB, Allard MW, Green ED 2008. Confirming the phylogeny of mammals by use of large comparative sequence data sets. Mol Biol Evol 25: 1795–1808 [DOI] [PMC free article] [PubMed] [Google Scholar]
- Ranwez V, Delsuc F, Ranwez S, Belkhir K, Tilak MK, Douzery EJ 2007. OrthoMaM: A database of orthologous genomic markers for placental mammal phylogenetics. BMC Evol Biol 7: 241 doi: 10.1186/1471-2148-7-241 [DOI] [PMC free article] [PubMed] [Google Scholar]
- Ream RA, Johns GC, Somero GN 2003. Base compositions of genes encoding alpha-actin and lactate dehydrogenase-A from differently adapted vertebrates show no temperature-adaptive variation in G + C content. Mol Biol Evol 20: 105–110 [DOI] [PubMed] [Google Scholar]
- Rodríguez-Trelles F, Tarrío R, Ayala FJ 2000. Evidence for a high ancestral GC content in Drosophila. Mol Biol Evol 17: 1710–1717 [DOI] [PubMed] [Google Scholar]
- Schmegner C, Hameister H, Vogel W, Assum G 2007. Isochores and replication time zones: A perfect match. Cytogenet Genome Res 116: 167–172 [DOI] [PubMed] [Google Scholar]
- Spencer CC 2006. Human polymorphism around recombination hotspots. Biochem Soc Trans 34: 535–536 [DOI] [PubMed] [Google Scholar]
- Warren WC, Hillier LW, Marshall Graves JA, Birney E, Ponting CP 2008. Genome analysis of the platypus reveals unique signatures of evolution. Nature 453: 175–183 [DOI] [PMC free article] [PubMed] [Google Scholar]
- Watanabe Y, Fujiyama A, Ichiba Y, Hattori M, Yada T, Sakaki Y, Ikemura T 2002. Chromosome-wide assessment of replication timing for human chromosomes 11q and 21q: Disease-related genes in timing-switch regions. Hum Mol Genet 11: 13–21 [DOI] [PubMed] [Google Scholar]
- Webster MT, Smith NG 2004. Fixation biases affecting human SNPs. Trends Genet 20: 122–126 [DOI] [PubMed] [Google Scholar]
- Webster MT, Smith NG, Hultin-Rosenberg L, Arndt PF, Ellegren H 2005. Male-driven biased gene conversion governs the evolution of base composition in human Alu repeats. Mol Biol Evol 22: 1468–1474 [DOI] [PubMed] [Google Scholar]
- Webster MT, Axelsson E, Ellegren H 2006. Strong regional biases in nucleotide substitution in the chicken genome. Mol Biol Evol 23: 1203–1216 [DOI] [PubMed] [Google Scholar]
- Wolfe KH, Sharp PM, Li WH 1989. Mutation rates differ among regions of the mammalian genome. Nature 337: 283–285 [DOI] [PubMed] [Google Scholar]
- Wrigley JM, Graves JA 1988. Karyotypic conservation in the mammalian order Monotremata (subclass Prototheria). Chromosoma 96: 231–247 [DOI] [PubMed] [Google Scholar]