

Abstract
The Transition Path Sampling (TPS) method is a powerful technique for studying rare events in complex systems, that allows description of reactive events in atomic detail without prior knowledge of reaction coordinates and transition states. We have applied TPS in combination with a hybrid Quantum Mechanical/Molecular Mechanical (QM/MM) method to study the enzyme human purine nucleoside phosphorylase (hPNP). This enzyme catalyzes the reversible phosphorolysis of 6-oxypurine (deoxy)nucleosides to generate the corresponding purine base and (deoxy)ribose 1-phosphate. Hundreds of reactive trajectories were generated. Analysis of this transition path ensembles provides insight into the detailed mechanistic dynamics of reaction in the enzyme. Our studies have indicated a reaction mechanism involving the cleavage of the N-ribosidic bond to form transition states with substantial ribooxacarbenium ion character, that is then followed by conformational changes in the enzyme and the ribosyl group leading to migration of the anomeric carbon of the ribosyl group toward phosphate to form the product ribose 1-phosphate. This latter process is crucial in PNP, because several strong H-bonds form between active site residues in order to capture and align the phosphate nucleophile. Calculations of the commitment probability along reactive paths demonstrated the presence of a broad energy barrier at the transition state. Analysis of these transition state structures showed that bond-breaking and bond-forming distances are not a good choice for the reaction coordinate, but that the pseudorotational phase of the ribose ring is also a significant variable.
1. Introduction
Purine Nucleoside Phosphorylase (PNP) catalyzes the reversible phosphorolysis of purine(2′-deoxy)ribonucleosides to generate the corresponding purine and (2′-deoxy)ribose 1-phosphate (Fig. 1) [1]. Genetic deficiency of human PNP results in a specific T-cell immunodeficiency due to the accumulation of deoxyguano-sine in blood and dGTP, in activated, dividing T-cells [2]. Inhibition of PNP is useful in targeting undesirable cell proliferation in T-cell cancers, autoimmune diseases, and tissue transplant rejection [3].
Fig. 1.

Phosphorolysis of guanosine catalyzed by PNP. A schematic rendering of reactant, ribooxacarbenium ion transition state, and product.
The catalytic mechanism of PNP has been experimentally studied by enzyme kinetics. A reaction mechanism of the SN1 type has been proposed based on the kinetic isotope effects (KIEs). Most of N-ribosyltransferases, including PNP, are known to catalyze a nucleophilic displacement reaction. In the chemical view of nucleophilic displacement, the nucleophile has sufficient kinetic energy to approach an electrophile. However, this is not the case for PNP, since the phosphate is immobilized by forming several H-bonds with active site residues, see Fig. 2. For this reason, a novel reaction mechanism was proposed for PNP, “nucleophilic displacement by electrophile migration”, based on KIE studies and comparison of several crystal structures of enzyme complexed with substrate, transition state inhibitor analogue and product [4].
Fig. 2.

(A) Structure of trimer PNP with catalytic site located near the trimer interface and bound to substrate guanosine and phosphate. (B) and (C) Active site residues in contact with guanosine and phosphate nucleophile are shown. (Color appears in Web edition.)
Detailed understanding of the reaction mechanism is of central interest in enzyme catalysis. Molecular dynamics simulations can provide details at an atomistic level of the catalytic mechanism. However, the accessible simulation time is usually in the ps to ns timescale. It is currently not possible for a conventional MD simulation to study a rare event, such as an enzymatic reaction, whose turnover rate is in the ms timescale. Techniques such as umbrella sampling, which imposes a bias potential on a guess for the reaction coordinate, have been widely used in studies of enzymatic reaction mechanisms. Chandler and coworkers developed the Transition Path Sampling (TPS) method to overcome both the long timescale problem and the lack of knowledge about transition mechanisms [5, 6]. The principal advantage of TPS is that it can study reaction mechanisms in atomic detail, without prior knowledge of the reaction coordinate and transition state. The TPS method has been previously employed by our group [7] in studies of Lactase Dehydrogenase (LDH). The results suggested both concerted and stepwise mechanisms of hydride and proton transfer as possible paths, and showed that the hydride transfer was facilitated by motions of residues far from the active site. A subsequent study by our group [8] determined a reaction coordinate that incorporates these residue motions.
In this paper, we combine the TPS algorithm with a hybrid Quantum Mechanical/Molecular Mechanical method (QM/MM) [9], to study in atomistic detail the reversible phosphorolysis reaction catalyzed by PNP.
2. Methods
2.1 Quantum mechanical and molecular mechanical (QM/MM) molecular dynamics simulation
Human PNP is a homotrimer and the catalytic sites are located near a subunit-subunit interface, see Fig. 2. The catalytic sites consist of residues N243, E201, H257, F200, Y88, M219, F159* and catalytic water WAT520 as contacts for the nucleoside, and residues S33, R84, H86, A116, S220 and catalytic water WAT502 as contacts for the phosphate group. F159* is a catalytic site residue from the adjacent subunit and covers the catalytic site from accessible solvent. The schematic representation of the active site residues in contact with the substrate and phosphate nucleophile is shown in Fig. 2. The starting structure was taken from the crystal structure of the trimeric human PNP in a complex with the transition state analogue, Immucillin-H (ImmH), and phosphate at 2.5 Å resolution (PDB code: 1RR6) [10], see Fig. 2. Hydrogen atoms were added and assigned protonation states for all ionizable residues according to their solution pKa value assuming a pH = 7, by using the Biopolymer module of InsightII. The catalytic site residue Glu201 was deprotonated at neutral pH to stabilize the purine base. His257 was also modeled as neutral form with a proton at NE leaving ND to interact with the 5′-hydroxyl of ribose ring. The enzyme-substrate complex was created by modifying the transition state inhibitor to guanosine substrate, since they are isosteric molecules, then, we replaced N4' with O4' and C9 with N9. We also assigned a protonation at N7 of the purine base, since transition state analysis has established N7 protonation to N7H prior to reaching the transition state [11].
All QM/MM simulations were performed using the CHARMM [12] /MO-PAC [9] interface. The QM region consisted of the protonated N7-guanosine and HPO42− molecules with a total of 40 atoms (drawn as a ball and stick model in Fig. 2B), and treated with the PM3 semiempirical method [13]. We have chosen the PM3 method because it has been used successfully to model phosphorus and the phosphate group in enzymatic reaction studies [14]. The remaining atoms of the protein and crystal waters were in the MM region and described with the CHARMM27 all-atom force field for the protein and the TIP3P model for water. None of the protein was treated quantum mechanically, so there were no covalent bonds between the atoms of the QM and the MM regions. The interaction between the QM and MM parts is well treated with an effective Hamiltonian that includes the electrostatic and van der Waals interactions between electrons and nuclei of QM atoms with the MM atoms (modeled as point charges). The minimization included the full QM/MM potential assignment. The system was heated to 300 K over 10 ps, equilibrated with velocities assigned from a Gaussian distribution every 100 steps at 300 K for another 20 ps and then dynamically equilibrated for a final 30 ps. The MM-MM nonbonding cutoffs were 14 Å and there were no cutoffs for QM-MM nonbonding interactions.
2.2 Transition path sampling
2.2.1 Definition of the order parameter
The first step in the TPS algorithm is the definition of an “order parameter” that divides the phase space into three nonoverlapping regions: reactants, products, intermediate region. We used the bond-breaking (C1′-N9) and bond-forming (C1′-OP) distances as the order parameter: the reactant (product) region included all configurations that had a bond length of C1′-N9 shorter (longer) than 1.7 Å and a bond length of C1′-OP longer (shorter) than 1.8 Å.
2.2.2 Initial reactive trajectory
TPS requires knowledge of an “initial path”, i.e. a pathway connecting reactants and products, which acts as a seed for generating subsequent reactive trajectories. A natural attempt to generate an initial trajectory is to perform a high-temperature simulation (since it is then easier for the system to overcome the reaction barrier), as used in a protein folding study [15]. However, in more complicated systems, like in our previous TPS study of the hydride/proton transfer reaction in LDH [7], high temperature simulations were unsuccessful in generating a reactive trajectory, and instead, we constrained the hydride and proton at the midpoint of their respective donor-acceptor axis, and then the hydride initial velocity was slightly altered to move along the donor-acceptor axis, finally creating a connecting trajectory between reactant and product.
In the present paper, which is concerned with a reaction more complicated than a hydride/proton transfer, we followed a different route. We made a guess for the reaction coordinate and then used umbrella sampling [16] to construct a potential of mean force, to obtain a rough approximation for the transition state. We then used this approximate transition state to generate an initial reactive pathway. This initial guess does not bias the result, since the subsequent importance sampling will guide the reactive pathways to the most important regions of the trajectory space [6].
In particular, a series of QM/MM MD simulations were performed with the bias potential applied on a simple approximate reaction coordinate defined as the difference between the bond-breaking (C1′−N9) and bond-forming distances, z = d(C1′ − N9) − d(C1′−OP). Each simulation consisted of 10 ps of equilibration followed by 20 ps of sampling dynamics. Each subsequent equilibration was started from the 1 ps slice of the previous adjacent equilibration run. The weighted histogram analysis method (WHAM) [17] was used to combine all 22 windows to construct a potential of mean force (PMF). The standard deviation (SD) for the PMF was calculated at each point along the putative reaction coordinate using the block averaging method [18–20].
Figure 3 shows the QM/MM PMF of the phosphorolysis reaction catalyzed by PNP with a free energy of activation 15±1 kcal/mol, which is comparable with experimentally determined values(14±1 kcal/mol [21]). Although, the potential of mean force seems to have a bimodal profile with 2 transition states, if one takes into account the standard deviation one should rather interpret Fig. 3 as a broad activation energy barrier. Several configurations from the top of the activation barrier exhibited a likelihood of ribooxacarbenium ion character and were further used in an attempt to generate an initial reactive trajectory. The initial velocities of three atomic centers of reaction (N9, C1′ and OP) were slightly perturbed, and then we initiated simulations both forward and backward in time until generating one trajectory that began in the reactant region and finished in the product region, which served as our initial trajectory. The length of this trajectory was 250 fs, long enough to capture the transition event.
Fig. 3.

Computed QM/MM free energy profiles for the phosphorolysis reaction catalyzed by human PNP as a function of the presumed reaction coordinate, z (Å). The estimated error bar is shown, in kcal/mol.
2.2.3 Generating a transition path ensemble
The next step in the TPS algorithm is generating an ensemble of reactive trajectories. The TPS algorithm was implemented with CHARMM C29b2. The 250 fs initial reactive trajectory was used as a seed to start an iterative process of generating transition paths. To generate a new reactive trajectory, a shooting algorithm [22] was used: the momenta of the previous reactive trajectory were slightly perturbed, then rescaled to conserve linear and angular momentum and energy, as described in detail in our earlier work [7]. Dynamics was then run forward and backward in time to complete a 250 fs trajectory. Using the definition of the order parameter, it was checked whether the initial and final configurations of the newly generated trajectory were in the reactant and product states. If the newly generated trajectory was reactive (i.e. it connected reactant and product), then it was accepted as an additional member of the TPS transition ensemble, and used as a seed to initiate a new shooting move. If the new trajectory was not reactive, then a different time slice from the seeding reactive trajectory was randomly chosen for a new shooting move, until a new reactive trajectory was generated. A total of 1000 shooting attempts were made, resulting in a total of 220 reactive trajectories. The reactive trajectories decorrelated after about 40 successful shooting trials.
2.2.4 Location of transition states
The probability of a configuration to relax into reactant (PR) or product (PP) state is called the “commitment probability” or “committor” [22]. A transition state is defined as a configuration that has an equal probability to commit to reactant or product. To find the transition state we calculated the commitment probability of configurations along a reactive trajectory in the TPS ensemble, by initiating multiple trajectories with random initial momenta and counting how many trajectories originating from a given configuration relax to reactant and product. For each trajectory, a random velocity chosen from a Maxwell-Boltzmann distribution was assigned to a configuration, and dynamics was run for 150 fs, sufficient time for reaching a stable state. In practice, it is very CPU-expensive if trajectories are initiated from every configurations along a reactive trajectory. Instead, we first threw 10 trajectories, and if all of them went to the same state, either reactant or product, then we assumed the commitment probability to be close to 0 or 1. Otherwise, we shot more trajectories until we obtain an error of ±0.05. More than 100 trajectories were run for configurations where the PR and PP were both in the range of 0.4–0.6, which we defined as the transition state.
3. Results and discussion
3.1 Reaction mechanism and transition states
Figure 4 shows exemplary reactive trajectories from different parts of the transition path ensemble, to demonstrate the reaction progress in the direction from reactant (guanosine and phosphate) to product (guanine and ribose 1-phosphate). Analysis of the reactive trajectories in the transition path ensemble shows atomic details of the reaction mechanism catalyzed by PNP. The duration time of the transition event, after the reaction leaves the reactant state and before enters the product state, is about 100–120 fs. During this transition event the reaction mechanism involves firstly, the cleavage of the N-ribosidic bond to form transition states with substantial ribooxacarbenium ion character, that is followed by conformational changes in enzyme and the ribosyl group leading to a migration of the anomeric carbon of the ribosyl group toward phosphate, to form the product ribose 1-phosphate. These latter processes are crucial in PNP, because several strong H-bonds form between active site residues, to capture and align the phosphate nucleophile.
Fig. 4.
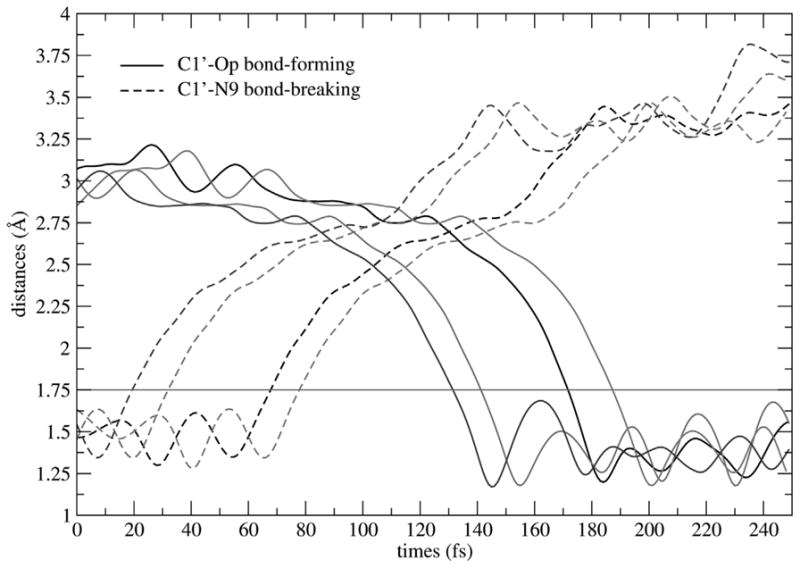
Plot of C1′-N9 bond-breaking (dashed line) and C1′-OP bond-forming (solid line) distances (Å) as a function of time when the chemical reaction proceeds in the direction from reactant (guanosine and phosphate) to product (guanine and ribose 1-phosphate). Four exemplary reactive trajectories taken from the transition path ensemble are shown. The red line is marked at a distance of 1.75 Å; d(C1′−N9) ≤ 1.7 Å defines reactantconfigurations; d(C1′− OP) ≤ 1.8 Å defines product configurations; and transition configurations are defined in between. (Color appears in Web edition.)
We have shown the involvement of enzyme dynamics, particularly contributions from active site residues, on the transition event timescale (fs-ps) that facilitate the accomplishment of chemical reaction catalyzed by PNP [23]. We demonstrated the importance of compression of the three oxygens (O4′, O5′ and OP) to activate the destabilizing electron of the N-ribosidic bond for the purine leaving group departure and then further stabilization the ribooxacarbenium ion transition state [23–25].
The transition states are identified by computing the commitment probabilities as described in the Methods section. There are approximately 8–10 configurations per single reactive trajectory that fit the requirement of commitment probabilities between 0.4–0.6 (indicating transition states). This wide range of of transition states suggests a broad activation energy barrier and indicates a lifetime of transition states of about 10 fs. These transition state structures show that the leaving group departs before participation from the phosphate nucleophile (C1′-N9 distances of 2.49 Å - 2.63 Å and C1′-OP distances of 2.76±0.01 Å), Fig. 5. They all share a characteristic of the ribooxacarbenium ion with fully developed sp2 hybridization at the C1′ position (dihedral angle O4′-C1′-C2′-H1′ of 180°) and shortening of the C1′− O4′ distance to 1.3 Å. As shown in Table 1, transition state configurations shows high positive charge at anomeric carbon and development of a C2′-endo conformation of ribose ring.
Fig. 5.

Distance of bond-breaking (C1′-N9) is plotted versus distance of bond-forming (C1′-OP) for different reactive trajectories from the transition path ensemble. Reactant and product configurations are defined based on an order parameter definition (the red dashed line). The regions of transition states and ribosyl migration are depicted in the zoom graph. (Color appears in Web edition.)
Table 1.
Structural parameters along a reactive trajectory.
| Parameters | Reactant | Int.I | TS | Int.II | Product |
|---|---|---|---|---|---|
| Relative Energy (kcal/mol) | 0.00 | 1.57 | 24.05 | −0.73 | −34.40 |
| d(C1′−N9) (Å) | 1.52 | 2.35 | 2.50 | 2.65 | 3.39 |
| d(C1′−OP) (Å) | 3.20 | 2.75 | 2.78 | 2.39 | 1.47 |
| d(C1′−O4′) (Å) | 1.46 | 1.26 | 1.31 | 1.20 | 1.42 |
| d(O4′−O5′) (Å) | 3.14 | 3.06 | 2.96 | 3.32 | 3.20 |
| d(O4′−OP) (Å) | 3.89 | 3.15 | 3.28 | 3.05 | 2.25 |
| charge OP (electron) | −0.89 | −0.80 | −0.84 | −0.83 | −0.61 |
| charge C1′ | −0.01 | 0.21 | 0.41 | 0.02 | 0.51 |
| charge N9 | 0.09 | −0.39 | −0.44 | −0.59 | −0.36 |
| charge O4′ | −0.43 | −0.21 | −0.22 | −0.20 | −0.50 |
| charge O5′ | −0.67 | −0.67 | −0.67 | −0.70 | −0.65 |
| charge N7 | −0.36 | −0.44 | −0.50 | −0.43 | −0.36 |
| ribose pseudorotational phase (°) | 34 | 330 | 160 | 90 | 277 |
| (C3′-endo) | (C2′-exo) | (C2′-endo) | (O4′-endo) | (O4′-exo) | |
| dihedral O4′-C1′-C2′-H1′ (°) | 100 | 136 | −177 | −167 | −159 |
| dihedral O5′-C5′-C4′-O4′ (°) | 77 | 75 | 73 | 102 | 90 |
The superimposition of structures representing the reactant, transition states and product are shown in Fig. 6. The picture clearly shows the atomic excursion reaction of “nucleophilic displacement by electrophile migration” for the phosphorolysis reaction catalyzed by PNP. In this novel mechanism the guanine leaving group and the anionic nucleophiles are fixed in the catalytic site, and the flexible ribocation migrates between the fixed nucleophiles. It has been proposed to be a general mechanism for many sugar transferases [4].
Fig. 6.
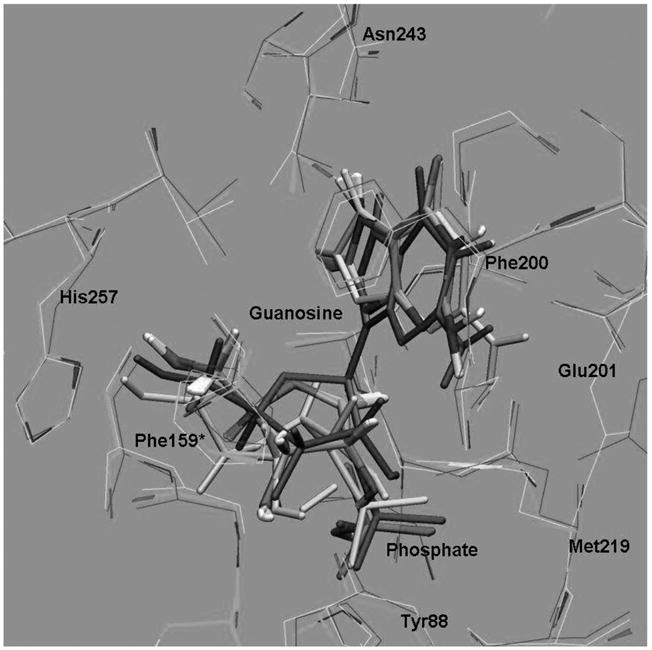
Superimposition of the structures taken from a reactive trajectory as the reaction progress from reactant; guanosine + phosphate, (in magenta) proceeding to the cleavage of the N-ribo-sidic bond to form the oxacarbenium ion transition states (in atomic color) and conformational changes and migration of ribosyl group to finally form ribose-1 phosphate as a product (in yellow). (Color appears in Web edition.)
We can monitor the electron delocalization during the reaction by extracting configurations from different regions of a reactive trajectory and then calculating the electrostatic potential charges with the DFT method. All calculations were done at the B3LYP6–31++G(d, p) level of theory using the Merz-Kollman-Singh scheme implemented in GAUSSIAN98 [26]. Configurations from five different regions along a reactive trajectory were taken to represent reactant, intermediate during cleavage of C-N bond (Int.I), transition state (TS), intermediate during ribosyl migration process (Int. II), and product states. In Table. 1 (configurations from reactant to transition state), one can see an increase of the positive charges at C1′ and O4′, as well as an increase of the negative charges at N9 and N7. Synchronizing with the cleavage of C-N bond, the three-oxygen stack (O5′, O4′ and OP) is more compressed, suggesting that it may activate electron expulsion for the breakage of C-N bond, and stabilize the oxacarbenium ion transition state which is considered as the most unstable conformation compared to the reactant and product states. The squeezing of the three-oxygens stack causes the energetically unfavorable 5′-hydroxyl orientation in the enzyme bound conformation (ca. 70–80°), as compared to the preferable conformation in solution (300°), see Fig. 7. This unusual geometric conformation of the 5′-hydroxyl group is the same for transition state inhibitor analogues (ImmH and DADMe-ImmH) bound in PNP. This suggests that the enzyme active site induces this conformation and alters the vibrational motions of these oxygens atom [24], which we have called “rate-promoting vibration” [27], to facilitate the chemical reaction.
Fig. 7.

Rotational energy barrier of the dihedral angle O5′-C5′-C4′-O4′ in guanosine computed at the B3LYP/6–31G(d, p) lavel of theory with the self-consistent reaction field(SCRF) implicit solvation model.
3.2 Energy decomposition analysis
We performed an energy decomposition analysis on the configurations as the reaction passes through the transition region. The interaction energies were calculated at the PM3-CHARMM27 QM/MM level, and consist of the electrostatic and van der Waals QM/MM energy. This method gives a good description of interactions between atoms of the MM-region and atoms of the QM-region. However, it is clearly approximate, and the resulting interaction energies should be interpreted simply as a guide to important information on binding interaction and transition state stabilization. The influence of particular active site residues should be deduced from the profiles through the observation of the energy contributions (ΔE[QM/MM]).
For each configuration, initially the QM energy of the fully charged system was determined. Subsequently, at each step of charge deletion of residue I, the QM energy was determined after the charge annihilation. The energy difference is the interaction energy between this residue and the QM subsystem: ΔE(I) = {E[QM] + E[QM/MM]} − {E[QM](I) + E[QM/MM](I)}. Where E[QM](I) and E[QM/MM](I) are the QM and QM/MM energies computed when MM charges of residue I have been removed [28, 29].
The energetic effects of individual active site residues on the PM3-CHARMM27 QM/MM interaction energies, indicating stabilizing (decreased ΔE[QM/MM]) and destabilizing (increased E[QM/MM]) effects relative to reactant, are plotted in Fig. 8. The most interesting quantity is the change in the interaction energies of active site residues, going from reactant to the transition state and to the product. The global interaction energy of the enzyme-substrate, relative to reactant (see Fig. 8, top left panel), shows the enzyme stabilized transition states by the decreasing of ΔE[QM/MM] when the reaction coordinate passes through the transition region, and it appears to be the most stabilized at the transition state. In this example of a reactive trajectory, the transition region is defined as the duration after it leaves the reactant state but before it enters the product state, more specifically the region where the distances d(C1′− N9) ≥ 1.7 Å and d(C1′− OP) ≥ 1.8 Å, a duration time between 70–170 fs in Fig. 8.
Fig. 8.

Individual active site residue contributions to stabilization and destabilization of the transition state as the reaction proceeds along a single reactive trajectory. This reactive trajectory is divided into the reactant (0–70 fs), transition (70–170 fs), and product (170–250 fs) regions as marked by red lines at 70 fs and 170 fs. (Color appears in Web edition.)
In Fig. 8, it is seen that interactions from Asn243, Glu201 and His257 are significant and predominant for transition state stabilization. Asn243 , Glu201 and the catalytic water Wat520 form strong H-bonding interactions with the guanine base at N7 and O6 position and participate in leaving group activation and transition state stabilization. The importance of Asn243 and Glu201 has been reported in experiments where site-directed Asn243Gly and Glu201 mutagenesis caused a 1460 and 2800-fold decrease in kcat/KM [30]. His257 plays an important role in polarizing the 5′-hydroxyl of the ribosyl group, in order to align the nucleoside binding configuration that facilitates the cleavage of the N-ribosidic bond, and especially for ribocation migration towards the phosphate nucleophile forming ribose 1-phosphate. Experimental mutagenesis studies of His257 show decreased catalytic power (kcat/KM) of substrate and affinity of binding for transition state inhibitor Immucillin(ImmH) [31]. Other active site residues in van der Waals contact with substrate also slightly participated, e.g. Tyr88 interacted with the 3′-hydroxyl of ribosyl group; Phe200 and Phe15* covered the active site from solvent access; and Met219 and Ser33 interacted with the nucleophilic oxygen of the phosphate group. Incorporating atomistic knowledge of enzymatic reaction mechanism with the KIE studies may be useful in development of more powerful transition state inhibitor design.
3.3 Reaction coordinate
Defining a complete reaction coordinate in enzymatic systems is complicated because of the large number of degrees of freedom and because it is not known which of these degrees of freedom affect catalysis. One of the most useful aspects of the TPS method is that it can generate reactive trajectories without any bias. Rather, the TS is found by calculating the commitment probability from the generated reactive trajectories. We compare our identification of the reaction coordinate using the calculated commitment probability, with three guesses for reaction coordinate that are often employed: (a) the simple reaction coordinate often used in umbrella sampling studies, defined as the difference of bond-breaking and bond-forming distances: z = d(C1′−N9) −d(C1′−OP); (b) the dihedral angle O4′-C1′-C2′-H1′, which describes the hybridization of anomeric carbon; and (c) the value of the pseudoratational phase of the ribose ring. If those variables gave a perfect description of the reaction coordinate, then there would be a correlation between reaction progress and those variables, and a good characterization of transition states (defined in TPS as configurations with equal probabilities of committing to reactant and product).
As can be seen in the top panel of Fig. 9, configurations with the same value of z (around -0.1) corresponded to various commitment probabilities. We previously used this putative reaction coordinate, z, to construct the PMF, and the transition state region was found at z = − 0.46 → −0.06 Å, which evidently corresponds to diverse commitment probabilities that varying from 0.1–1. This suggests that a simple guess such as difference between bond-breaking and bond-forming alone is not sufficient as a reaction coordinate.
Fig. 9.

Commitment probability vs. (a) difference of the distances: z = d(C1′− N9) - d(C1′− OP), in Å, (b) dihedral angle O4′-C1′-C2′-H1′, in degrees, and (c) pseudorotational phase of ribose ring, in degrees.
Correlating the commitment probabilities with other parameters are also shown in the middle and bottom panels of Fig. 9. The dihedral angle O4′-C1′-C2′-H1′ and pseudorotational phase of the ribose ring, also are not good reaction coordinates on their own, but a combination of all these variables may be significantly involved in forming the reaction coordinate.
4. Conclusion
We have investigated in atomic detail the phosphorolysis reaction catalyzed by human PNP, by performing hybrid QM/MM MD simulations in combination with Transition Path Sampling. Analysis of the transition path ensemble demonstrated that the reaction mechanism involves the cleavage of the N-ribosidic bond to form transition states with a substantial ribooxacarbenium ion character, that is then followed by conformational changes in the enzyme and the ribosyl group, leading to migration of the anomeric carbon of the ribosyl group toward phosphate to form the product ribose 1-phosphate, illustrating the picture of a previously proposed mechanism of “nucleophilic displacement by electrophile migration”. Synchronous with the cleavage of the C-N bond, electron are delocalized from ribosyl group to the purine leaving group. This is facilitated by the compression of the three-oxygen stack (O5′, O4′ and OP). It further stabilizes the oxacarbenium ion transition state. The transition state was significantly stabilized by the active site residues Asn243, Glu201, His257.
Acknowledgments
The authors acknowledge the support of the National Institutes of Health Grant GM068036. Saen-oon, S. thanks Dr. Dimitri Antoniou for advice in an error analysis of the free energy calculation and useful discussion.
Footnotes
Dedicated to Prof. Dr. Hans-Heinrich Limbach on the occasion of his 65th birthday
References
- 1.Stoeckler JD, Cambor C, Parks REJ. Biochemistry. 1980;19:102. doi: 10.1021/bi00542a016. [DOI] [PubMed] [Google Scholar]
- 2.Giblett ER, Ammann AJ, Wara DW, Sandman R, Diamond LK. Lancet. 1975;1:1010. doi: 10.1016/s0140-6736(75)91950-9. [DOI] [PubMed] [Google Scholar]
- 3.Ealick SE, Babu Y, Bugg C, Erion ME, Guida WC, Montgomery JA, Secrist JA. Proc Natl Acad Sci USA. 1991;88:11540. doi: 10.1073/pnas.88.24.11540. [DOI] [PMC free article] [PubMed] [Google Scholar]
- 4.Schramm VL, Shi W. Curr Opin Chem Biol. 2001;11:657. [Google Scholar]
- 5.Dellago C, Bolhuis P, Geissler P. Adv Chem Phys. 2001;123:1. [Google Scholar]
- 6.Dellago C, Bolhuis P. Top Curr Chem. 2007;268:291. [Google Scholar]
- 7.Basner JE, Schwartz SD. J Am Chem Soc. 2005;127:13822. doi: 10.1021/ja043320h. [DOI] [PubMed] [Google Scholar]
- 8.Quaytman SL, Schwartz SD. Proc Natl Acad Sci USA. 2007;104:12253. doi: 10.1073/pnas.0704304104. [DOI] [PMC free article] [PubMed] [Google Scholar]
- 9.Field M, Bash P, Karplus M. J Comp Chem. 1990;11:700. [Google Scholar]
- 10.Shi W, Ting LM, Kicsha GA, Lewandowicz A, Tyler PL, Furneaux RH, Almo SC, Schramm VL. J Biol Chem. 2004;279:18103. doi: 10.1074/jbc.C400068200. [DOI] [PubMed] [Google Scholar]
- 11.Kline PC, Schramm VL. Biochemistry. 1993;32:13212. doi: 10.1021/bi00211a033. [DOI] [PubMed] [Google Scholar]
- 12.Brooks BR, Bruccoleri RE, Olafson BD, States DJ, Swaminathan S, Karplus M. J Comput Chem. 1983;4:187. [Google Scholar]
- 13.Stewart JJP. J Comp Chem. 1989;10:209. [Google Scholar]
- 14.Hart JC, Burton NA, Hillier IH, Harrison MJ, Jewsbury P. Chem Commun. 1997:1431. [Google Scholar]
- 15.Bolhuis PG. Proc Natl Acad Sci USA. 2003;100:12129. doi: 10.1073/pnas.1534924100. [DOI] [PMC free article] [PubMed] [Google Scholar]
- 16.Torrie GMVJP. J Comput Phys. 1977;23:187. [Google Scholar]
- 17.Kumar S, Bouzida D, Swendsen RH, Kollman PA, Rosenberg JM. J Comput Chem. 1992;13:1011. [Google Scholar]
- 18.Chen HN, Ilan B, Wu YJ, Zhu FQ, Schulten K, Voth GA. Biophys J. 2007;92:46. doi: 10.1529/biophysj.106.091934. [DOI] [PMC free article] [PubMed] [Google Scholar]
- 19.Hummer G. J Chem Phys. 2001;114:7330. [Google Scholar]
- 20.Park S, Khalili-Araghi F, Tajkhorshid E, Schulten K. J Chem Phys. 2003;119:3559. [Google Scholar]
- 21.Ghanem M, Li L, Wing C, Schramm VL. Biochemistry. 2008;47:2559. doi: 10.1021/bi702132e. [DOI] [PubMed] [Google Scholar]
- 22.Bolhuis P, Dellago C, Chandler D. Faraday Discuss. 1998;110:421. [Google Scholar]
- 23.Saen-oon S, Schramm VL, Schwartz SD. Proc Natl Acad Sci USA. 2008 doi: 10.1073/pnas.0808413105. submitted to. [DOI] [PMC free article] [PubMed] [Google Scholar]
- 24.Nunez S, Antoniou D, Schramm VL, Schwartz SD. J Am Chem Soc. 2004;126:15720. doi: 10.1021/ja0457563. [DOI] [PubMed] [Google Scholar]
- 25.Saen-oon S, Ghanem M, Schramm VL, Schwartz SD. Biophys J. 2008 doi: 10.1529/biophysj.107.121913. in press. [DOI] [PMC free article] [PubMed] [Google Scholar]
- 26.Frisch MJ, Trucks GW, Schlegel HB, Scuseria GE, Robb MA, Cheeseman JR, Zakrzewski VG, Montgomery JJA, Stratmann RE, Burant JC, Dapprich S, Milla JM, Daniels AD, Kudin KN, Strain MC, Farkas O, Tomasi J, Barone V, Cossi M, Cammi R, Mennucci B, Pomelli C, Adamo C, Clifford S, Ochterski J, Petersson GA, Ay- ala PY, Cui Q, Morokuma K, Salvador P, Dannenberg JJ, Malick DK, Rabuck AD, Raghavachari K, Foresman JB, Cioslowski J, Ortiz JV, Baboul AG, Stefanov BB, Liu G, Liashenko A, Piskorz P, Komaromi I, Gomperts R, Martin RL, Fox DJ, Keith T, Al-Laham MA, Peng CY, Nanayakkara A, Challacombe M, Gill PMW, Johnson B, Chen W, Wong MW, Andres JL, Gonzalez C, Head-Gordon M, Replogle ES, Pople JA. Gaussian 98, Revision A.11.2. Gaussian, Inc; Pittsburgh: 2001. [Google Scholar]
- 27.Antoniou D, Basner J, Nunez S, Schwartz SD. Chem Rev. 2006;106:3170. doi: 10.1021/cr0503052. [DOI] [PubMed] [Google Scholar]
- 28.Major DT, Gao J. J Am Chem Soc. 2006;126:16345. doi: 10.1021/ja066334r. [DOI] [PubMed] [Google Scholar]
- 29.Hermann JC, Hensen C, Ridder L, Mulholland AJ, Holtje HD. J Am Chem Soc. 2005;127:4454. doi: 10.1021/ja044210d. [DOI] [PubMed] [Google Scholar]
- 30.Erion MD, Takabayashi K, Smith H, Kessi J, Wagner S, Honger S, Shames S, Ealick SE. Biochemistry. 1997;36:11725. doi: 10.1021/bi961969w. [DOI] [PubMed] [Google Scholar]
- 31.Murkin AS, Birck MR, Rinaldo-Matthis A, Shi W, Taylor EA, Schramm VL. Biochemistry. 2007;46:5038. doi: 10.1021/bi700147b. [DOI] [PMC free article] [PubMed] [Google Scholar]