

Abstract
There have been many studies examining HIV-infection-related alterations of magnetic resonance imaging (MRI) diffusion metrics. However, examining scalar diffusion metrics ignores the orientation aspect of diffusion imaging, which can be captured with tractography. We examined five different tractography metrics obtained from global tractography maps (global tractography FA, average tube length, normalized number of streamtubes, normalized weighted streamtube length, and normalized total number of tubes generated) for differences between HIV positive and negative patients and the association between the metrics and clinical variables of disease severity. We also examined the relationship between these metrics and cognitive performance across a wide range of cognitive domains for the HIV positive and negative patient groups separately. The results demonstrated a significant difference between the groups for global tractography FA (t=2.13, p= 0.04), but not for any of the other tractography metrics examined (p-value range=0.39 to 0.95). There were also several significant associations between the tractography metrics and cognitive performance (i.e., tapping rates, switching 1 and 2, verbal interference, mazes; r≥0.42) for HIV infected patients. In particular, associations were noted between tractography metrics, speed of processing, fine motor control/speed, and executive function for the HIV-infected patients. These findings suggest that tractography metrics capture clinically relevant information regarding cognitive performance among HIV infected patients and suggests the importance of subtle white matter changes in examining cognitive performance.
Keywords: HIV, DTI, Neuropsychological performance, Tractography
Introduction
We know that the human immunodeficiency virus (HIV) penetrates the central nervous system (CNS) within 2 weeks of initial infection (Davis et al. 1992). Once in the CNS, HIV instigates a cascade of immunological response typically characterized by inflammation and the release of cytokines (An et al. 1996; Bell 2004). The prolonged or chronic release of these chemicals results in CNS injury with common pathological changes including myelin pallor, gliosis, rarefactions, and dendritic simplification (Budka et al. 1987; Gray et al. 1992; Masliah et al. 1997; Power et al. 1993). Though there is accumulating evidence of primary mechanisms of neuronal injury including glutamate excitotoxicity (Dewhurst et al. 1996; Ferrarese et al. 2001; Haughey et al. 2001; Lipton 1991) and gp120 mediated apoptosis (Cossarizza 2008; Louboutin et al. 2007), HIV can result in white matter pathological damage and atrophy with cognitive consequences (Cherner et al. 2007; Cysique et al. 2006; Heaton et al. 2004a, b; McArthur et al. 2004). However, it is still unclear how these various pathological processes are associated with or related to cognitive dysfunction. In order to better elucidate the anatomical relationship between HIV mediated CNS injury and cognitive dysfunction, examination of HIV associated CNS injury using in vivo methods is critical.
As a method, diffusion tensor imaging (DTI) has particular utility in examining CNS white matter abnormalities in vivo. This is primarily due to the general linear organization of white matter pathways that restrict water diffusion along the length of the myelinated axonal fibers. Using the signal information from each imaging voxel, the magnitude and orientation of this water movement can be quantified and examined to provide information regarding the intrinsic structural and physiological characteristics of the underlying tissue. Given the pathological predilection of the virus for white matter and several resulting prominent white matter pathologies (i.e., myelin pallor, dendritic simplification), there have been several studies examining the utility of diffusion tensor imaging (DTI) scalar metrics probing HIV associated brain changes (Filippi et al. 2001; Pfefferbaum et al. 2007; Pomara et al. 2001; Ragin et al. 2005). These studies consistently demonstrate alterations in the diffusion characteristics of white matter with HIV infected patients having worse fractional anisotropy (FA) and/or apparent diffusion coefficient (ADC) measures that are interpreted as an indication of white matter structural abnormalities. Fortunately, these measures are also consistently associated with alterations in cognitive domains and/or dementia status (Pfefferbaum et al. 2007; Ragin et al. 2005; Ragin et al. 2004). These studies clearly demonstrate the utility of examining DTI scalar metrics among HIV infected patients.
However, examination of basic DTI scalar metrics utilizing a region of interest (ROI) approach ignores one of the more fascinating applications of diffusion imaging; namely DTI tractography. Tractography is a method of examining inter-voxel diffusion coherence capable of producing striking images of gross white matter organization in the brain. More importantly, unlike ROI scalar metric studies, tractography makes it possible to examine diffusion characteristics along the whole length of the fiber tract. This allows researchers to avoid common pitfalls associated with ROI analyses, namely reduced variability and location of sample biases. Preliminary use of tractography metrics has benefited our understanding of white matter organization in developmental studies (typical development, autism (Assaf and Pasternak 2008; Ding et al. 2008; Dubois et al. 2008; Gilmore et al. 2007)) and disruption of connectivity in neurological illness or injury (MS, traumatic brain injury (DeBoy et al. 2007; Schmierer et al. 2007; Wilde et al. 2008)), as well as provide the basis for examining tracks of interest (TOIs) and their associated functional impact (schizophrenia (Schlosser et al. 2007; Skranes et al. 2007)). These significant DTI tractography findings across a wide range of patient cohorts and the known white matter pathology associated with HIV infection suggest there is additional utility in exploring DTI tractography among HIV infected patient populations.
The purpose of this study was to examine the relationship between several recently developed and validated quantitative tractography measures (Correia et al. 2008) and clinical/cognitive measures among a cohort of HIV infected patients. Specifically, we examined the relationship between several traditional tractography metrics (i.e., total length, number of tracts/streamtubes, average FA along the length of tubes), unique tractography metrics (i.e., normalized or weighted length and number of tubes), HIV disease measures (CD4 and plasma viral load), and cognitive testing with the expectation that these metrics would be significantly associated with disease burden and/or cognitive performance, especially cognitive measures typically dependent on white matter integrity (i.e., psychomotor speed, attention, and executive function). We included the examination of more specialized weighted tractography measures because, as described in the Correia et al. (2008) manuscript, these measures may be particularly sensitive to more subtle changes in white matter integrity due to inflammation and/or other pathological processes not sufficient to produce changes in more traditional metrics. We also examine these tractography metrics for differences between HIV infected patients and demographically matched controls with the expectation that tractography results would be quantitatively altered in the context of HIV infection.
Methods
Participants
Data for this study was collected as part of an NIH funded grant and all consent forms and procedures were approved by the local hospital institutional review board (IRB). In this study, we examined a sample of 23 HIV infected (33% Hepatitis C (HCV) co-infected), and 20 HCV/HIV negative controls who had diffusion tensor imaging of sufficient quality to examine (i.e., limited motion artifact). Participants were males and females representing three major ethnic groups (Caucasian, African American, and Latino). All participants were recruited from the same immunology clinic and most met criterion for alcohol and/or drug dependency as determined by the structured clinical interview (SCID). As such, all our participants had a history of alcohol/drug abuse though inclusion criterion required that they not be actively using alcohol/drugs within the past six months in order to participate. Additionally, participants were excluded from the study if they had a history of head injury with loss of consciousness greater than five minutes, learning disability, neurologic disease, active opportunistic infection, major psychiatric diagnosis, and/or MRI contraindications (i.e., metal in body). All participants underwent MRI examination using a consistent sequence protocol (see below) and standardized cognitive testing (see below). For each participant, imaging and cognitive testing were conducted within two weeks of each other. The two groups were matched at recruitment for important demographic information (age, education, drug and alcohol abuse histories; see Table 1 for summary of demographics).
Table 1.
Demographic variables
| Total sample size=43 |
|||
|---|---|---|---|
| HIV negative controls (n=20) | HIV + Infected patients (n=23) | p-values | |
| Gender | 13:7 | 14:9 | 0.18 |
| Ethnicity | 10 C/4 AA/2 H | 13 C/6 AA/4 H | 0.14 |
| Age | 34.22 (12.36) | 39.52 (5.35) | 0.10 |
| Education | 12.78 (3.87) | 12.26 (2.09) | 0.61 |
| CD4 Count | N/A | 404.13 (188.17) | N/A |
| Log Viral Load | N/A | 5,029.6 (15,110) | N/A |
| BDI-II | 7.31 (8.90) | 12.54 (10.14) | 0.16 |
| KMSK Alcohol | 9.94 (3.23) | 7.71 (3.55) | 0.06 |
| KMSK Cocaine | 7.5 (6.23) | 9.29 (6.44) | 0.40 |
| KMSK Heroin | 2.13 (3.95) | 3.38 (5.31) | 0.42 |
| PI | 30.4% taking | ||
| NRTI | 17.4% taking | ||
| NNRTI | 78.3% taking | ||
| Breakdown of CD4 Cells for HIV Patients | Breakdown of Viral Load for HIV Patients | ||
| ≤ 200 | N=1 | ≤75 | N=12 |
| 201–350 | N=10 | 76–1,000 | N=6 |
| 351–500 | N=6 | 1,001–10,000 | N=3 |
| ≥ 501 | N=6 | ≥ 10,001 | N=2 |
Ethnicity codes C = Caucasian, AA = African American, H = Hispanic; Education is number of years; CD4 counts are cells per ml, BDI-II = Beck Depression Inventory, KMSK = Kreek–McHugh–Schluger–Kellog Scale
Clinical diagnosis and assessment
As part of routine care, each participant’s plasma CD4 cell count (cells/mL) and viral load (log RNA/mL) were collected. Both CD4 cell count and viral loads were used as dependent variables in the statistical analyses. It should be noted that all HIV infected participants were required to be on stable regimens of antiretroviral treatments (ART). The participants, with one exception, had CD4 counts above 200, and the majority had low or undetectable HIV-1 RNA levels and were therefore not at significant risk for new AIDS associated conditions (see Table 1). The percentage of patients being treated with medication from the various classes is also illustrated in Table 1.
Neuropsychological and neuropsychiatric evaluation
All participants underwent a battery of cognitive and psychiatric testing that included both self-administered computerized and traditional neuropsychological tests. Participants were administered the IntegNeuro™ (Brain Resource Company, Melbourne, Australia) computerized battery which contains tests of sensorimotor function, attention, executive function, language fluency, memory, and verbal intelligence estimate (see Table 2 for a list and description of tests). The reliability and validity of this battery is discussed in detail elsewhere (Paul et al. 2005; Silverstein et al. 2007). Raw testing data was converted to a standardized z-score using normative data from the Integ-Neuro™ international database. Scores are normalized for age, gender, and education.
Table 2.
Neuropsychological protocol and group performance by domain
| Cognitive domain | Neuropsychological test | Test description | Control participants z-score | HIV positive patients z-score | p-values (unequal variance assumed) |
|---|---|---|---|---|---|
| Motor function | Simple Motor Tapping | Assesses the number of taps made during a 60 second trial for both dominant and non-dominant hand. | −0.04 (1.00) | −1.18 (1.73) | 0.008 |
| Choice Reaction Time | Assesses the time is takes a participant to perceive and respond to a target on the computer screen. | ||||
| Halstead-Reitan Grooved Pegboard Test | Measures fine motor coordination skills and speed of processing. Tests dominant and non-dominant hands separately. | ||||
| Attention | Span of Visual Memory | Computerized adaptation to the Spatial Span Test for the Wechsler Memory Scale and assesses ability to attend to and correctly respond to visual sequences. | 0.87 (0.63) | −0.28 (1.20) | <0.001 |
| Digit Span | Assesses attention and working memory by requiring the individual to recall increasingly longer strings of numbers. | ||||
| Switching of attention-Task 1 | Computer adaptation of Trail Making Test A to assess visual-scanning and attention abilities when dealing with a familiar sequence. | ||||
| Language | Animal Naming | Assesses rapid categorical naming under timed conditions. | 0.10 (1.07) | −0.63 (1.62) | 0.082 |
| Controlled Oral Word Association (COWA) | Assesses rapid word generation under timed conditions given a letter cue (FAS). | ||||
| Learning & memory Executive function | Verbal List Learning | Measures verbal learning and retrieval across four trials and after a 20 minute delay. | 0.62 (1.20) | −1.04 (1.39) | <0.001 |
| Switching of attention-Task 2 | Computer adaptation of Trail Making Test B that assesses sequencing and mental flexibility by requiring subject to alternate between two familiar sequences while keeping them both in order. | 0.77 (0.80) | 0.21 (1.40) | 0.101 | |
| Verbal Interference | Similar to the Stroop task and assesses the ability to inhibit more automatic and irrelevant responses to provide required response under timed conditions. | ||||
| Maze Task | Computer adaptation of the Austin Maze and assesses pursuit of hidden path through a matrix of circles. | ||||
| Mood | Beck Depression Inventory-II (BDI-II) | 24 item self-report questionnaire including assessment of both vegetative and non-vegetative symptoms. | 10.08 (9.42) Raw Score | 7.94 (9.35) Raw Score | 0.546 |
| Drug and alcohol abuse history | Kreek–McHugh–Smith–Kulla (KMSK) | Self-assessment of historical drug/alcohol use with questions assessing frequency, amount, and duration of use. Separate questionnaires for alcohol, cocaine, and heroine. | 6.46 (3.05) Raw Score | 6.33 (3.55) Raw Score | 0.903 |
We also added two more traditional neuropsychological tests including the Wechsler Adult Intelligence Scale—3rd Edition symbol digits (SD) subtest and the grooved pegboard test from the Reitan battery. Raw testing data was converted to z-scores using the Heaton norms (Heaton et al. 2004a, b), which control for age, education, and gender. Additionally, each participant was administered a measure of depression (The Beck Depression Inventory (BDI)) and a self-assessment of alcohol/drug dependency (The Kreek–McHugh–Schluger–Kellog Scale (KMSK)). Importantly, we used the KMSK to match the experimental groups for alcohol/drug dependency histories. This self-report questionnaire quantifies amount, frequency, and duration of alcohol, heroin, and cocaine use separately. Scores range from 0 to 15 with scores greater than or equal to nine (heroin) and 11 (alcohol and cocaine) indicating a likely diagnosis of dependency (Kellogg et al. 2003). Scores for the BDI and KMSK are seen in Table 1 for each experimental group.
MRI methods
All participants underwent MRI (Siemens 1.5T Symphony, Siemens, Germany) utilizing a standard imaging protocol that included a diffusion tensor imaging (DTI) sequence. The Siemens MDDW protocol was used to collect a series of three co-registered sagittal double-spin-echo, diffusion-weighted echo-planar volumes. The following parameters were used to consistently acquire DTI data from all participants: 5 mm thick slices, 0.1 mm inter-slice spacing, 30 slices per acquisition, matrix=128×128, FOV= 21.7×21.7 cm, TR=7,200, TE=156, no partial echoes, NEX=3. Diffusion encoding gradients (b=0, 1,000 mm/s2) were applied in 12 non-collinear directions. Each subsequent series acquisition (in the series of three) was spatially offset in the slice direction by 1.7 mm. Total time for the three acquisitions was slightly less than 15 min. Using a post-processing routine, the three acquisitions were then interleaved to achieve 1.7 mm3 resolution images and up-sampled (equivalent to zero-filling) to 0.85 mm3 isotropic voxels for analysis. From these images, we calculated the eigen-values and eigen-vectors at each voxel to derive fractional anisotropy (FA) and diffusivity (ADC) maps.
Streamtube tractography map generation and tractography metrics of interest
Tractography maps were generated for each participant using custom in house software. Briefly, streamtube models of cerebral white matter were based on the major eigenvector of the diffusion tensor field and created using a dense seeding and culling approach detailed in the Zhang et al. (2003) paper. This approach uses a dense seeding criterion (seeds placed every 0.85 mm3) and specifies optimal input parameters for tube generation (i.e., minimum threshold for linear anisotropy=0.1, minimum tube length=10 mm, minimum distance between tubes=2 voxels, and integration step size=1 mm). Combined, the seeding and parameter settings minimize the number of anatomically implausible fibers in regions of low anisotropy (i.e., CSF, muscle) while retaining linear structures in most of the brain parenchyma. The initial pass produces a dense set of streamtubes that are then subjected to an automated distance-based culling process that removes similar (i.e., redundant) streamtubes to facilitate visual inspection and quantitative analysis.
Basic measures of interest generated by the outcome include the total number of streamtubes generated, the total length of these tubes, the length of the stream tubes normalized by FA, and the average tractography FA for the total white matter model. These are described in detail in the recent published manuscript (Correia et al. 2008). In this paper, we examined five tractography metrics including global fractional anisotropy (FA), normalized number of tubes, average length of tubes, normalized total length of tubes, and the normalized weighted length of tubes (see Table 3 for a brief description of each measure). Additionally, as described in the Correia et al. paper (2008), the number of tubes and length of tubes metrics were scaled by a factor accounting for head size using the following formula: tractography metric divided by the ratio of each person’s intracranial volume divided by the average intracranial volume for the entire group. This was an attempt to account for any potential differences in head size given the fact that our sample included male and female participants with potentially disparate head sizes. We used the structural imaging variable for total intracranial contents as a measure of head size for each of the participants. This was derived using the automated structural imaging pipeline processing software package FreeSurfer (MGH, Boston, MA) which uses the T1 MPRAGE volumetric sequences to extract, segment, parcellate, and measure brain tissue. After visual inspection and manual edits (when needed) of the FreeSurfer output, the intracranial contents (i.e., brain parenchyma, ventricular space, and surface/pial CSF) measure was recorded and used as the head size variable.
Table 3.
Brief description of the tractography measures used in the analyses
| Tractography metric | Formula | Brief description |
|---|---|---|
| Global fractional anisotropy (FA) | GFA= ΣFASS/TSL (FASS=FA at each imaging voxel along a streamtube; TSL=total streamtube length) | The average FA for the total streamtube model. Measure of the average directional movement of water throughout the white matter. |
| Normalized number of tubes | NTL= ΣNS/TICV (NS=number of streamtubes; TICV=total intracranial volume) | The total number of streamtubes generated by the model normalized by head size (total intracranial content volume). |
| Average length of tubes | ALT= ΣTSL/NS (TSL=total streamtube length; NS=number of streamtubes) | The total length of the tubes in mm divided by the number of streamtubes in the model. This is an average streamtube length measure in mm. |
| Normalized total length of tubes | NTLT= ΣLs/TICV (Ls=the length in mm of a single streamtube s; TICV=total intracranial volume) | The total length of the streamtubes in mm generated by the model normalized by head size (total intracranial content volume). |
| Normalized weighted length of tubes | NWLT= Σ(FAsX Ls)/TICV (FAs=average FA along streamtube s; Ls=length in mm of a single streamtube s; TICV=total intracranial volume) | This is a weighted length measure (weighted be FA) normalized by head size (total intracranial volume). |
Statistics
Examination of the data included both visual and quantitative inspection of the data for normalcy. Tractography measures appeared to be normally distributed though as might be expected, plasma viral loads were not. For this reason, viral loads were divided into undetectable (≤75) and detectable (>75) groups for analysis.
The tractography metrics for the two groups were compared using independent t-tests with the metrics as the dependent variables and the diagnostic group as the grouping variable. We also examined the association between the global tractography metrics and cognitive performance within domains using correlation analyses. We then compared the magnitude of the significant associations between the two groups using Fisher’s z-transformation test. Among the HIV infected patients, we also examined the relationship between the tractography metrics and measures of disease severity including CD4 counts and viral loads using parametric (CD4 values) and non-parametric (viral loads) correlation analysis. In a set of secondary post-hoc analyses, we examined the differences between the HIV mono-infected (n=17) and HIV/HCV co-infected (n=6) patients using an independent t-test.
Results
Demographic variables
As expected (due to matching), the two groups did not differ with respect to age, education, gender or ethnicity, BDI scores, or alcohol, cocaine, or heroin dependency histories (see Table 1). Given the similarities between the two groups, no statistical adjustments were made to the group comparisons or the correlational analyses.
Quantitative tractography results
Visualization of the means for each of the tractography measures indicated reductions in all the tractography measures except the normalized number of tubes which appears to be relatively similar between the groups (See Fig. 1). However, these differences in means were not statistically significant for any comparison except for a difference in global tractography FA (t=2.13, p=0.04). Effect sizes calculated using the means and standard deviations suggest small effect sizes for the average tube length (Cohen’s d=0.30) and normalized total number of tubes (Cohen’s d=0.33), medium effect sizes for FA weighted tube length (Cohen’s d=0.42) and normalized length of tubes (Cohen’s d=0.55), and a large effect size for the global tractography FA (Cohen’s d=0.81).
Fig. 1.

Bar charts illustrating the mean and standard error for each of the five tractography measurements of interest by diagnostic group
Clinical relationships
For the HIV infected patient cohort, plasma CD4 counts were inversely associated with the normalized number of tubes (r=−0.43, p=0.02; i.e., the number of tubes increased as CD4 cell counts declined). No other significant associations were found for any measure (r-value range 0.01 to 0.43 for CD4 and 0.18 to 0.32 for viral load).
Cognitive relationships
The association between global tractography metrics and cognitive performance for each domain were examined for each experimental group separately (See Tables 4 and 5). When examining the associations between tractography measures and cognition among the HIV negative patients fewer overall significant associations are demonstrated and the direction of the association is not always as expected (i.e., average tube length is often negatively correlated with cognitive performance). Significant relationships included a positive association between switching 1 (similar to Trails A) and global tractography FA (r=0.65, p<0.001) and the time to complete the mazes task was related to all but one of the tractography measures (r range was 0.55 to 0.73). Another association was found between the normalized number of tubes and the grooved pegs dominant hand performance (r=−0.52, p=0.03). However, after adjusting for multiple comparisons (0.05/number of comparison), only two of the six significant relationships remained (global tractography FA and switching 1; weighted tube length and time to maze completion).
Table 4.
Correlation coefficients between tractography measures and cognitive tests for control patients
| Global FA | Normalized number of tubes | Normalized tube length | Weighted tube length (FA) | Average tube length | |
|---|---|---|---|---|---|
| Tapping | 0.34 | 0.29 | 0.26 | 0.19 | 0.16 |
| 0.12 | 0.15 | 0.18 | 0.26 | 0.29 | |
| Reaction time | 0.28 | 0.13 | 0.09 | 0.12 | 0.00 |
| 0.16 | 0.34 | 0.38 | 0.34 | 0.50 | |
| Grooved pegs D | −0.02 | −0.52* | −0.39 | −0.07 | −0.16 |
| 0.48 | 0.03 | 0.08 | 0.41 | 0.29 | |
| Visual memory | −0.27 | −0.08 | −0.08 | 0.21 | −0.09 |
| 0.17 | 0.40 | 0.39 | 0.23 | 0.38 | |
| Digit span | 0.17 | 0.19 | 0.20 | 0.34 | 0.10 |
| 0.28 | 0.26 | 0.25 | 0.12 | 0.36 | |
| Switching A | 0.65** | 0.31 | 0.13 | −0.05 | −0.18 |
| 0.01 | 0.14 | 0.33 | 0.43 | 0.27 | |
| Animal naming | −0.07 | −0.18 | 0.07 | 0.33 | 0.36 |
| 0.41 | 0.28 | 0.41 | 0.12 | 0.10 | |
| COWA | −0.07 | 0.24 | 0.32 | 0.46 | 0.32 |
| 0.40 | 0.20 | 0.13 | 0.05 | 0.13 | |
| List learning total | 0.00 | 0.11 | 0.12 | 0.27 | 0.08 |
| 0.50 | 0.35 | 0.35 | 0.18 | 0.40 | |
| Switching B | −0.02 | 0.13 | −0.01 | 0.07 | −0.20 |
| 0.48 | 0.33 | 0.49 | 0.41 | 0.25 | |
| Verbal interference | 0.16 | 0.34 | 0.34 | 0.10 | 0.25 |
| 0.29 | 0.12 | 0.12 | 0.36 | 0.20 | |
| Mazes | 0.55* | 0.60* | 0.61** | 0.73** | 0.44 |
| 0.02 | 0.01 | 0.01 | 0.00 | 0.06 |
Correlation is significant at the 0.05 level (1-tailed).
Correlation is significant at the 0.01 level (1-tailed).
Table 5.
Correlation coefficients between tractography measures and cognitive tests for HIV infected patients
| Global FA | normalized number of tubes | Normalized tube length | Weighted tube length (FA) | Average tube length | |
|---|---|---|---|---|---|
| Tapping | 0.69** | −0.12 | 0.55** | 0.66** | 0.58** |
| 0.01 | 0.31 | 0.01 | 0.00 | 0.00 | |
| Reaction time | 0.06 | 0.19 | −0.07 | 0.16 | −0.15 |
| 0.41 | 0.22 | 0.39 | 0.25 | 0.27 | |
| Grooved pegs D | −0.28 | 0.07 | −0.21 | −0.41 | −0.25 |
| 0.12 | 0.39 | 0.20 | 0.04 | 0.14 | |
| Visual memory | 0.18 | −0.08 | 0.12 | 0.29 | 0.11 |
| 0.22 | 0.37 | 0.31 | 0.10 | 0.31 | |
| Digit span | 0.34 | −0.14 | 0.28 | 0.37* | 0.31 |
| 0.06 | 0.28 | 0.11 | 0.04 | 0.08 | |
| Switching A | 0.53** | −0.40* | 0.16 | 0.50** | 0.39* |
| 0.01 | 0.04 | 0.24 | 0.01 | 0.04 | |
| Animal naming | 0.28 | −0.29 | 0.15 | 0.32 | 0.34 |
| 0.11 | 0.11 | 0.27 | 0.08 | 0.07 | |
| COWA | 0.09 | 0.04 | −0.08 | 0.21 | −0.01 |
| 0.35 | 0.43 | 0.38 | 0.18 | 0.48 | |
| List learning total | 0.14 | 0.21 | 0.36 | 0.42* | 0.15 |
| 0.27 | 0.18 | 0.06 | 0.03 | 0.27 | |
| Switching B | 0.42* | 0.05 | 0.44* | 0.61** | 0.34 |
| 0.03 | 0.42 | 0.02 | 0.00 | 0.06 | |
| Verbal interference | 0.46* | 0.00 | 0.28 | 0.43* | 0.21 |
| 0.02 | 0.49 | 0.11 | 0.03 | 0.18 | |
| Mazes | 0.49* | −0.17 | 0.29 | 0.56** | 0.35 |
| 0.02 | 0.25 | 0.12 | 0.01 | 0.07 |
Correlation is significant at the 0.05 level (1-tailed)
Correlation is significant at the 0.01 level (1-tailed)
For the HIV infected patient group, the number of relationships was greater than that of controls. The most consistently robust imaging measure appeared between the FA weighted tube length and cognitive measures as it was associated with eight of the 12 cognitive tests examined. Even when adjusting the significance level for multiple comparisons (0.05/number of comparison) half of the significant associations remained significant. Global tractography FA values also appear to be associated with a significant number of tests including tapping rates, switching 1 and 2, verbal interference, and mazes (r-value range 0.42 to 0.69). Tapping rates with the dominant hand was positively associated with all but one of the tractography measures (not related to normalized number of tubes, r=−0.19, p=0.20) with r-values ranging from of 0.39 to 0.53 (15 to 28% of the variance). Consistently, the associations between the tractography metrics and cognitive performance were such that worse tractography values indicated poorer cognitive performance. For example, the time it took to complete switching 1 and 2 tasks (adaptations of Trails A and B) increased with reduction in global FA, average tube length, normalized total tube length, normalized weighted tube length while the number of taps with the dominant hand in a set period of time was increased with increased global FA, average tube length, normalized total tube length, and normalized weighted tube length (see Table 5).
Direct comparison of the significant correlation coefficients between the groups using Fisher’s z-transformation demonstrated only three significantly different correlation coefficients (tapping, switching A, and switching B for the FA weighted tube length measure) where the magnitude of the correlation coefficient for the HIV positive patients exceeded the controls. There was a single significant Fishers z-transformation for the mazes and normalized number of tubes where the control correlation coefficient exceeded that of the HIV positive patients.
Secondary analysis of HCV/HIV coinfection
In a set of secondary post-hoc analyses, we compared the tractography measures for the 17 HIV mono-infected patients with the 6 HIV/HCV co-infected patients as there has been both clinical and cognitive evidence of increased neurological risk associated with HCV co-infection. Results from these preliminary comparisons revealed no significant differences although the average length of tubes measure appeared to be trending toward a significant difference (t=−2.03, p= 0.057) where the co-infected patients demonstrated a smaller average tube length. No significant differences were noted between the measures of global FA, normalized number of tubes, normalized total tube length, and normalized weighted tube length between the two groups.
Discussion
The most significant finding for this study was the number and magnitude of correlations noted between the tractography metrics and cognitive performance among the HIV infected patients. To our knowledge, this is the first study to examine global tractography metrics and a broad range of cognitive function in HIV infected patients. The overall tube length weighted by FA appeared to be most consistently related to the cognitive performance even when correcting for multiple comparisons. However, global tractography FA was also related to many cognitive tests. The weighted tube length measure is a unique measure to our group and is described in more detail in the recent Correia et al. (2008) paper. As stated in that paper, this metric might be more sensitive to subtle changes in FA where the change in FA is too small to negatively impact tube generation, yet is still reduced in the disease state. This is clearly happening in this population as the global FA value is significantly reduced in the HIV positive patients relative to the controls. However, other important associations were observed with motor tapping rates, measures of processing speed, and executive function, all aspects of cognition that are highly dependent on white matter integrity. We believe these results indicate that tractography metrics capture information regarding cognitive performance and that with further validation these metrics might be used to improve treatment recommendations and/or improve our ability to determine the progression and evolution of CNS injury in HIV infection within the white matter. However, there is still much to be learned about the pathological correlates of DTI. This fact limits the number of inferences that can positively be made though it is clear that these measures capture cognitively important structural aspects of the CNS in the context of HIV infection and that these methods warrant further examination.
We also demonstrated a significant association between the normalized number of streamtubes and CD4 counts for HIV infected patients. The inverse association suggests that with declining CD4 counts, the overall number of stream-tubes generated increases. This finding could be an indication of small, localized variations in the anisotropy that exceed acceptable parameters resulting in “broken” tracts or fragmentation of tracts. However, the significance of this single association should not be overstated due to the small sample size and number of comparisons being made. As such, this finding should be examined in the context of larger and/or prospective studies examining the evolution and progression of these tractography abnormalities.
Attempts to find differences between the HIV infected and HIV negative patients revealed a significant difference for global tractography FA, but not for any of the other tractography metrics. Global and regional changes in FA have been reported in HIV infected patients since diffusion imaging was first used by Fillipi et al. (2001). For example, FA has been shown to be reduced in several ROI studies, especially in the different regions of the corpus callosum of HIV infected patients. Additionally, using tractography metrics to examine regional corpus callosum (not global tractography) differences in HIV infected patients, Pfefferbaum et al. (2007) conclude that FA was reduced in the genu and splenium of the corpus callosum.
It should be pointed out, that our sample is unique to other studies in that we matched experimental groups by drug (cocaine and heroine) and alcohol histories. Controlling for drug and alcohol use is important in HIV given the relatively high prevalence of use (Haverkos 1998; Samet et al. 2007) and the well-established neurologic risk associated with use among HIV infected patients (Pfefferbaum et al. 2007). The significant difference in global tractography FA in this study suggests that this difference is related to HIV infection. Overall, the metrics were clearly reduced in HIV infected patients (see Fig. 1). The lack of significance may be due to sample size as an examination of the differences between the means suggest small effect sizes for the number of tubes and average tube length (Cohen’s d=0.30 and 0.33 respectively) and medium effect sizes for weighted length of tubes and normalized length of tubes (Cohen’s d=0.42 and 0.55 respectively).
Additionally, visualization of the tractography models suggests the need for further examination at a regional level for differences, as there were noticeable qualitative differences between HIV positive patient and HIV negative control groups (see Fig. 2). For example, it appears that there are visually apparent reductions in the number of tubes generated in the frontal, subcortical, and cerebellar regions for the HIV infected patients. These are interesting qualitative observations given the fact that we know there is a pathological predilection of the virus for the frontal/subcortical regions of the brain (Budka et al. 1987; Everall et al. 1993) and that there may be a reason for more disorganization of white matter in these areas. However, when examining the tractography results on a global level, we did not find differences in the tube model metrics though the lack of significance may be attributed to more subtle regional differences that are obscured when examining whole brain measures. Future studies of tractography metrics might be improved by examining regional differences or possibly by examining specific white matter fiber bundles or fasciculi. For example, comparing tractography metrics from the frontal white matter (frontal forceps), motor tract through the internal capsule, and/or frontal subcortical connections may contain more HIV relevant information.
Fig. 2.
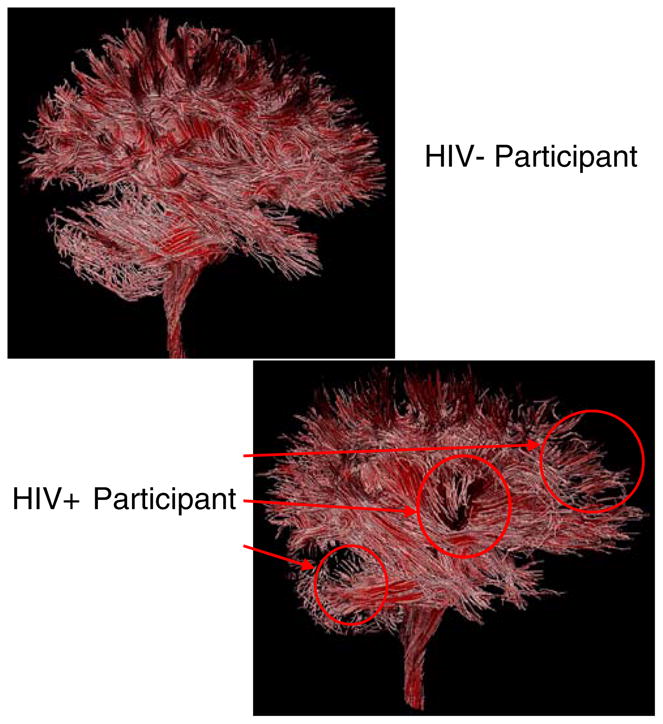
Illustration of the tractography output for HIV negative control participant and HIV infected patient. Qualitative differences are identified by the red arrows and circles
The issue of HIV/HCV co-infection is extremely important for American and European cohorts where the rates of co-infection are as high as 30 percent (Perry et al. 2008). Our small sample included approximately 30 percent HIV/HCV co-infected patients and as a group should be relatively representative of the general HIV population commonly observed in the United States. This small number of subjects only allowed for a preliminary examination of the HIV/HCV co-infection status. However, given the evidence of worsening cognitive function associated with co-infection status (Everall et al. 2005; von Giesen et al. 2004; Cherner et al. 2005; Hilsabeck et al. 2005) as well as negative affects on the course of HIV infection and/or risk of death due to HCV/liver related illnesses (Kim and Lauer 2007; Lin et al. 2008; Smit et al. 2008; Sulkowski et al. 2007) we examined our HIV infected patients for differences in tractography measures between mono- and co-infected patients. In this preliminary post-hoc analyses, HIV/HCV comparisons revealed no significant differences between the two groups for any of the global tractography measures though the average tube length appeared to be trending toward a significant difference with the coinfected group having the smaller average tube length. Additional studies examining the brain using in vivo brain imaging for findings associated with HIV/HCV co-infection are still needed.
There are several limitations to this study. First, the number of patient participants was limited. The small number of participants limits the power of the study and the inferences that we can make regarding the findings especially when making so many statistical comparisons. It will be important to replicate these findings in larger studies. Additionally, the cross sectional nature of this study is also another potential limitation. Though it is clear from the data that there are significant associations between these tractography measures and cognitive performance (especially for the HIV infected patients), understanding the causal or the temporal nature of the relationships is obscured. Given the fact that validity and reliability of the tractography measures were demonstrated to be quite robust (Correia et al. 2008), tractography methods might be used to examine change associated with HIV infection.
Additionally, there are methodological caveats that should be considered when interpreting these findings (for more detail see the Correia et al. 2008 manuscript). For example, the generation of tractography maps relies on several somewhat arbitrarily determined parameters including FA and length thresholds. For this particular study, thresholds were selected based on our experience with this particular data set and visual inspection of the data that minimize the number of spurious otherwise anatomically implausible tracts (issue of validity). This is important to remember because the underlying assumption is that HIV infection alters the generation of these tractography models so as to reduce the number and length of tubes generated. However, as mentioned in the Correia et al. (2008) manuscript, utilizing different threshold for these parameters did not affect the pattern of results in a repeated study of the same patient cohort. Subject motion is always a concern in DTI tractography as streamtube models can be negatively impacted by motion. This is a particular concern with our data because it relies on the interleaving of three five minute scans to derive the final FA maps. Recognizing this potential limitation, a vacuum pillow was used during the scan session to minimize motion. Patients and controls were also extensively coached before and during scan acquisition.
Qualitatively, this resulted in a relatively clean usable data set and we only excluded three imaging data sets due to excessive motion artifacts. Though correcting for motion might improve the reliability of the streamtube generation, there is no consensus for an optimal method described in the literature at this time and no motion correction was used in this data.
It is clear that there is still much to learn about white matter change in HIV infected patients. Given the results of this paper, we expect that DTI tractography as a method holds much promise in examining and delineating pathological changes associated with HIV infection. Additionally, the robust associations of DTI tractography metrics with cognitive testing may be an indication of the general clinical utility of such measures and should be investigated more thoroughly in larger prospective studies.
Acknowledgments
This manuscript was supported in part by the following grants: K23-MH073416 (DFT), K23-MH065857 (RP), and P30-AG013846 (DFT).
Contributor Information
David F. Tate, Email: DTATE1@PARTNERS.ORG, Departments of Radiology and Psychiatry, Brigham and Women’s Hospital, Harvard Medical School, Boston, MA, USA. Department of Neurology, Boston University Medical Center Alzheimer’s Disease Center, Boston University Medical School, Boston, MA, USA
Jared Conley, Departments of Radiology and Psychiatry, Brigham and Women’s Hospital, Harvard Medical School, Boston, MA, USA.
Robert H. Paul, Department of Psychology, University of Missouri at St. Louis, St. Louis, MO, USA
Kathryn Coop, Center for AIDS Research, The Miriam Hospital, Providence, RI, USA.
Song Zhang, Department of Computer Science and Engineering, Mississippi State University, Starkville, MS, USA.
Wenjin Zhou, Department of Computer Science, Brown University, Providence, RI, USA.
David H. Laidlaw, Department of Computer Science, Brown University, Providence, RI, USA
Lynn E. Taylor, Center for AIDS Research, The Miriam Hospital, Providence, RI, USA. Department of Medicine, The Warren Alpert Medical School at Brown University, Providence, RI, USA
Timothy Flanigan, Center for AIDS Research, The Miriam Hospital, Providence, RI, USA. Department of Medicine, The Warren Alpert Medical School at Brown University, Providence, RI, USA.
Bradford Navia, Department of Medicine, Tufts New England Medical Center, Boston, MA, USA.
Ronald Cohen, Department of Psychiatry and Behavioral Medicine, The Warren Alpert School of Medicine at Brown University, Providence, RI, USA.
Karen Tashima, Center for AIDS Research, The Miriam Hospital, Providence, RI, USA. Department of Medicine, The Warren Alpert Medical School at Brown University, Providence, RI, USA.
References
- An SF, Ciardi A, Giometto B, Scaravilli T, Gray F, Scaravilli F. Investigation on the expression of major histocompatibility complex class II and cytokines and detection of HIV-1 DNA within brains of asymptomatic and symptomatic HIV-1-positive patients. Acta Neuropathologica. 1996;91(5):494–503. doi: 10.1007/s004010050457. [DOI] [PubMed] [Google Scholar]
- Assaf Y, Pasternak O. Diffusion tensor imaging (DTI)-based white matter mapping in brain research: a review. J Mol Neurosci. 2008;34(1):51–61. doi: 10.1007/s12031-007-0029-0. [DOI] [PubMed] [Google Scholar]
- Bell JE. An update on the neuropathology of HIV in the HAART era. Histopathology. 2004;45(6):549–559. doi: 10.1111/j.1365-2559.2004.02004.x. [DOI] [PubMed] [Google Scholar]
- Budka H, Costanzi G, Cristina S, Lechi A, Parravicini C, Trabattoni R, et al. Brain pathology induced by infection with the human immunodeficiency virus (HIV). A histological, immunocytochemical, and electron microscopical study of 100 autopsy cases. Acta Neuropathologica. 1987;75(2):185–198. doi: 10.1007/BF00687080. [DOI] [PubMed] [Google Scholar]
- Cherner M, Cysique L, Heaton RK, Marcotte TD, Ellis RJ, Masliah E, et al. Neuropathologic confirmation of definitional criteria for human immunodeficiency virus-associated neurocognitive disorders. J Neurovirol. 2007;13(1):23–28. doi: 10.1080/13550280601089175. [DOI] [PubMed] [Google Scholar]
- Cherner M, Letendre S, Heaton RK, Durelle J, Marquie-Beck J, Gragg B, et al. Hepatitis C augments cognitive deficits associated with HIV infection and methamphetamine. Neurology. 2005;64(8):1343–1347. doi: 10.1212/01.WNL.0000158328.26897.0D. [DOI] [PubMed] [Google Scholar]
- Correia S, Lee SY, Voorn T, Tate DF, Paul RH, Zhang S, et al. Quantitative tractography metrics of white matter integrity in diffusion-tensor MRI. Neuroimage. 2008;42(2):568–581. doi: 10.1016/j.neuroimage.2008.05.022. [DOI] [PMC free article] [PubMed] [Google Scholar]
- Cossarizza A. Apoptosis and HIV infection: about molecules and genes. Current Pharmaceutical Design. 2008;14(3):237–244. doi: 10.2174/138161208783413293. [DOI] [PubMed] [Google Scholar]
- Cysique LA, Maruff P, Brew BJ. The neuropsychological profile of symptomatic AIDS and ADC patients in the pre-HAART era: a meta-analysis. Journal of the International Neuropsychological Society. 2006;12(3):368–382. doi: 10.1017/s1355617706060401. [DOI] [PubMed] [Google Scholar]
- Davis LE, Hjelle BL, Miller VE, Palmer DL, Llewellyn AL, Merlin TL, et al. Early viral brain invasion in iatrogenic human immunodeficiency virus infection. Neurology. 1992;42(9):1736–1739. doi: 10.1212/wnl.42.9.1736. [DOI] [PubMed] [Google Scholar]
- DeBoy CA, Zhang J, Dike S, Shats I, Jones M, Reich DS, et al. High resolution diffusion tensor imaging of axonal damage in focal inflammatory and demyelinating lesions in rat spinal cord. Brain. 2007;130(Pt 8):2199–2210. doi: 10.1093/brain/awm122. [DOI] [PubMed] [Google Scholar]
- Dewhurst S, Gelbard HA, Fine SM. Neuropathogenesis of AIDS. Molecular Medicine Today. 1996;2(1):16–23. doi: 10.1016/1357-4310(96)88754-5. [DOI] [PubMed] [Google Scholar]
- Ding XQ, Sun Y, Braabeta H, Illies T, Zeumer H, Lanfermann H, et al. Evidence of Rapid Ongoing Brain Development Beyond Two Years of Age Detected by Fiber Tracking. AJNR American Journal of Neuroradiology. 2008;29(7):1261–1265. doi: 10.3174/ajnr.A1097. [DOI] [PMC free article] [PubMed] [Google Scholar]
- Dubois J, Dehaene-Lambertz G, Soares C, Cointepas Y, Le Bihan D, Hertz-Pannier L. Microstructural correlates of infant functional development: example of the visual pathways. J Neurosci. 2008;28(8):1943–1948. doi: 10.1523/JNEUROSCI.5145-07.2008. [DOI] [PMC free article] [PubMed] [Google Scholar]
- Everall IP, Hansen LA, Masliah E. The shifting patterns of HIV encephalitis neuropathology. Neurotoxicity Research. 2005;8(1–2):51–61. doi: 10.1007/BF03033819. [DOI] [PubMed] [Google Scholar]
- Everall IP, Luthert PJ, Lantos PL. Neuronal number and volume alterations in the neocortex of HIV infected individuals. Journal of Neurology, Neurosurgery and Psychiatry. 1993;56(5):481–486. doi: 10.1136/jnnp.56.5.481. [DOI] [PMC free article] [PubMed] [Google Scholar]
- Ferrarese C, Aliprandi A, Tremolizzo L, Stanzani L, De Micheli A, Dolara A, et al. Increased glutamate in CSF and plasma of patients with HIV dementia. Neurology. 2001;57(4):671–675. doi: 10.1212/wnl.57.4.671. [DOI] [PubMed] [Google Scholar]
- Filippi CG, Ulug AM, Ryan E, Ferrando SJ, van Gorp W. Diffusion tensor imaging of patients with HIV and normal-appearing white matter on MR images of the brain. AJNR American Journal of Neuroradiology. 2001;22(2):277–283. [PMC free article] [PubMed] [Google Scholar]
- Gilmore JH, Lin W, Corouge I, Vetsa YS, Smith JK, Kang C, et al. Early Postnatal Development of Corpus Callosum and Corticospinal White Matter Assessed with Quantitative Tractography. AJNR American Journal of Neuroradiology. 2007;28(9):1789–1795. doi: 10.3174/ajnr.A0751. [DOI] [PMC free article] [PubMed] [Google Scholar]
- Gray F, Lescs MC, Keohane C, Paraire F, Marc B, Durigon M, et al. Early brain changes in HIV infection: neuropathological study of 11 HIV seropositive, non-AIDS cases. Journal of Neuropathology and Experimental Neurology. 1992;51(2):177–185. doi: 10.1097/00005072-199203000-00007. [DOI] [PubMed] [Google Scholar]
- Haughey NJ, Nath A, Mattson MP, Slevin JT, Geiger JD. HIV-1 Tat through phosphorylation of NMDA receptors potentiates glutamate excitotoxicity. Journal of Neurochemistry. 2001;78(3):457–467. doi: 10.1046/j.1471-4159.2001.00396.x. [DOI] [PubMed] [Google Scholar]
- Haverkos HW. HIV/AIDS and drug abuse: epidemiology and prevention. Journal of Addictive Diseases. 1998;17(4):91–103. doi: 10.1300/J069v17n04_08. [DOI] [PubMed] [Google Scholar]
- Heaton RK, Marcotte TD, Mindt MR, Sadek J, Moore DJ, Bentley H, et al. The impact of HIV-associated neuropsychological impairment on everyday functioning. Journal of the International Neuropsychological Society. 2004a;10(3):317–331. doi: 10.1017/S1355617704102130. [DOI] [PubMed] [Google Scholar]
- Heaton RK, Walden M, Taylor MJ, Grant I. Revised comprehensive norms for an expanded Halstead-Reitan battery: demographically adjusted neuropsychological norms for African Americans and Caucasian Adults. Lutz: Psychological Assessment Resources, Inc; 2004b. [Google Scholar]
- Hilsabeck RC, Castellon SA, Hinkin CH. Neuropsychological aspects of coinfection with HIV and hepatitis C virus. Clinical Infectious Diseases. 2005;41(Suppl 1):S38–44. doi: 10.1086/429494. [DOI] [PMC free article] [PubMed] [Google Scholar]
- Kellogg S, McHugh P, Bell K, Schluger J, Schluger R, LaForge K, et al. The Kreek–McHugh–Schluger–Kellog scale: a new, rapid method for quantifying substance abuse and its possible applications. Drug and Alcohol Dependence. 2003;69(2):137–150. doi: 10.1016/s0376-8716(02)00308-3. [DOI] [PubMed] [Google Scholar]
- Kim AY, Lauer GM. Pathogenesis of HIV-HCV Coinfection. Current Infectious Disease Reports. 2007;9(4):331–337. doi: 10.1007/s11908-007-0051-y. [DOI] [PubMed] [Google Scholar]
- Lin W, Weinberg EM, Tai AW, Peng LF, Brockman MA, Kim KA, et al. HIV increases HCV replication in a TGF-beta1-dependent manner. Gastroenterology. 2008;134(3):803–811. doi: 10.1053/j.gastro.2008.01.005. [DOI] [PubMed] [Google Scholar]
- Lipton SA. HIV-related neurotoxicity. Brain Pathology. 1991;1(3):193–199. doi: 10.1111/j.1750-3639.1991.tb00659.x. [DOI] [PubMed] [Google Scholar]
- Louboutin JP, Agrawal L, Reyes BA, Van Bockstaele EJ, Strayer DS. Protecting neurons from HIV-1 gp120-induced oxidant stress using both localized intracerebral and generalized intraventricular administration of antioxidant enzymes delivered by SV40-derived vectors. Gene Therapy. 2007;14(23):1650–1661. doi: 10.1038/sj.gt.3303030. [DOI] [PubMed] [Google Scholar]
- Masliah E, Heaton RK, Marcotte TD, Ellis RJ, Wiley CA, Mallory M, et al. Dendritic injury is a pathological substrate for human immunodeficiency virus-related cognitive disorders. HNRC Group. The HIV Neurobehavioral Research Center. Annals of Neurology. 1997;42(6):963–972. doi: 10.1002/ana.410420618. [DOI] [PubMed] [Google Scholar]
- McArthur JC, McDermott MP, McClernon D, St Hillaire C, Conant K, Marder K, et al. Attenuated central nervous system infection in advanced HIV/AIDS with combination antiretroviral therapy. Archives of Neurology. 2004;61(11):1687–1696. doi: 10.1001/archneur.61.11.1687. [DOI] [PubMed] [Google Scholar]
- Paul RH, Lawrence J, Williams LM, Richard CC, Cooper N, Gordon E. Preliminary validity of “integneuro”: a new computerized battery of neurocognitive tests. International Journal of Neuroscience. 2005;115(11):1549–1567. doi: 10.1080/00207450590957890. [DOI] [PubMed] [Google Scholar]
- Perry W, Hilsabeck R, Hassanein T. Cognitive dysfunction in chronic hepatitis C: a reviewq. Digestive Diseases and Sciences. 2008;53:307–321. doi: 10.1007/s10620-007-9896-z. [DOI] [PubMed] [Google Scholar]
- Pfefferbaum A, Rosenbloom MJ, Adalsteinsson E, Sullivan EV. Diffusion tensor imaging with quantitative fibre tracking in HIV infection and alcoholism comorbidity: synergistic white matter damage. Brain. 2007;130(Pt 1):48–64. doi: 10.1093/brain/awl242. [DOI] [PubMed] [Google Scholar]
- Pomara N, Crandall DT, Choi SJ, Johnson G, Lim KO. White matter abnormalities in HIV-1 infection: a diffusion tensor imaging study. Psychiatry Research. 2001;106(1):15–24. doi: 10.1016/s0925-4927(00)00082-2. [DOI] [PubMed] [Google Scholar]
- Power C, Kong PA, Crawford TO, Wesselingh S, Glass JD, McArthur JC, et al. Cerebral white matter changes in acquired immunodeficiency syndrome dementia: alterations of the blood-brain barrier. Annals of Neurology. 1993;34(3):339–350. doi: 10.1002/ana.410340307. [DOI] [PubMed] [Google Scholar]
- Ragin AB, Storey P, Cohen BA, Edelman RR, Epstein LG. Disease burden in HIV-associated cognitive impairment: a study of whole brain imaging measures. Neurology. 2004;63(12):2293–2297. doi: 10.1212/01.wnl.0000147477.44791.bd. [DOI] [PMC free article] [PubMed] [Google Scholar]
- Ragin AB, Wu Y, Storey P, Cohen BA, Edelman RR, Epstein LG. Diffusion tensor imaging of subcortical brain injury in patients infected with human immunodeficiency virus. Journal of Neurovirology. 2005;11(3):292–298. doi: 10.1080/13550280590953799. [DOI] [PMC free article] [PubMed] [Google Scholar]
- Samet JH, Walley AY, Bridden C. Illicit drugs, alcohol, and addiction in human immunodeficiency virus. Panminerva Medica. 2007;49(2):67–77. [PubMed] [Google Scholar]
- Schlosser RG, Nenadic I, Wagner G, Gullmar D, von Consbruch K, Kohler S, et al. White matter abnormalities and brain activation in schizophrenia: a combined DTI and fMRI study. Schizophrenia Research. 2007;89(1–3):1–11. doi: 10.1016/j.schres.2006.09.007. [DOI] [PubMed] [Google Scholar]
- Schmierer K, Wheeler-Kingshott CA, Boulby PA, Scaravilli F, Altmann DR, Barker GJ, et al. Diffusion tensor imaging of post mortem multiple sclerosis brain. Neuroimage. 2007;35(2):467–477. doi: 10.1016/j.neuroimage.2006.12.010. [DOI] [PMC free article] [PubMed] [Google Scholar]
- Silverstein SM, Berten S, Olson P, Paul R, Willams LM, Cooper N, et al. Development and validation of a World-Wide-Web-based neurocognitive assessment battery: Web-Neuro. Behavior Research Methods. 2007;39(4):940–949. doi: 10.3758/bf03192989. [DOI] [PubMed] [Google Scholar]
- Skranes J, Vangberg TR, Kulseng S, Indredavik MS, Evensen KA, Martinussen M, et al. Clinical findings and white matter abnormalities seen on diffusion tensor imaging in adolescents with very low birth weight. Brain. 2007;130(Pt 3):654–666. doi: 10.1093/brain/awm001. [DOI] [PubMed] [Google Scholar]
- Smit C, van den Berg C, Geskus R, Berkhout B, Coutinho R, Prins M. Risk of hepatitis-related mortality increased among hepatitis C virus/HIV-coinfected drug users compared with drug users infected only with hepatitis C virus: a 20-year prospective study. Journal of Acquired Immune Deficiency Syndromes. 2008;47(2):221–225. doi: 10.1097/QAI.0b013e31815d2f59. [DOI] [PubMed] [Google Scholar]
- Sulkowski MS, Mehta SH, Torbenson MS, Higgins Y, Brinkley SC, de Oca RM, et al. Rapid fibrosis progression among HIV/hepatitis C virus-co-infected adults. AIDS. 2007;21(16):2209–2216. doi: 10.1097/QAD.0b013e3282f10de9. [DOI] [PubMed] [Google Scholar]
- von Giesen HJ, Heintges T, Abbasi-Boroudjeni N, Kucukkoylu S, Koller H, Haslinger BA, et al. Psychomotor slowing in hepatitis C and HIV infection. J Acquir Immune Defic Syndr. 2004;35(2):131–137. doi: 10.1097/00126334-200402010-00005. [DOI] [PubMed] [Google Scholar]
- Wilde EA, McCauley SR, Hunter JV, Bigler ED, Chu Z, Wang ZJ, et al. Diffusion tensor imaging of acute mild traumatic brain injury in adolescents. Neurology. 2008;70(12):948–955. doi: 10.1212/01.wnl.0000305961.68029.54. [DOI] [PubMed] [Google Scholar]
- Zhang S, Demiralp C, Laidlaw D. Visualizing diffusion tensor MR images using streamtubes and streamsurfaces. IEEE Transactions on Visualization and Computer Graphics. 2003;9(4):454–462. [Google Scholar]