

Abstract
PURPOSE
To compare recanalization and reperfusion in terms of their predictive value for imaging outcomes (follow-up infarct volume, infarct growth, salvaged penumbra) and clinical outcome in acute ischemic stroke patients.
MATERIAL AND METHODS
Twenty-two patients admitted within 6 hours of stroke onset were retrospectively included in this study. These patients underwent a first stroke CT protocol including CT-angiography (CTA) and perfusion-CT (PCT) upon admission, and similar imaging after treatment, typically around 24 hours, to assess recanalization and reperfusion. Recanalization was assessed by comparing arterial patency on admission and post-treatment CTAs; reperfusion, by comparing the volumes of CBV, CBF and MTT abnormality on admission and post-treatment PCTs. Collateral flow was graded on the admission CTA. Follow-up infarct volume was measured on the discharge noncontrast CT. The groups of patients with reperfusion, no reperfusion, recanalization, and no recanalization were compared in terms of imaging and clinical outcomes.
RESULTS
Reperfusion (using an MTT reperfusion index > 75%) was a more accurate predictor of follow-up infarct volume than recanalization. Collateral flow and recanalization were not accurate predictors of follow-up infarct volume. An interaction term was found between reperfusion and the volume of the admission penumbra > 50 mL.
CONCLUSION
Our study provides evidence that reperfusion is a more accurate predictor of follow-up infarct volume in acute ischemic stroke patients than recanalization. We recommend an MTT reperfusion index > 75% to assess therapy efficacy in future acute ischemic stroke trials that use perfusion-CT.
INTRODUCTION
Revascularization therapies in acute ischemic stroke patients, including intravenous and intraarterial thrombolysis and mechanical clot retrieval devices, aim to rescue the ischemic penumbra by restoring the patency of the occluded artery (recanalization) and the downstream capillary blood flow (reperfusion). Although referring to distinct concepts, the terms recanalization and reperfusion have been used interchangeably in acute stroke literature.1
Evidence supporting the benefit of early revascularization therapies comes from previous studies showing that recanalization, if achieved early, predicts smaller infarct volume and better clinical outcomes.2–6 However, it is increasingly being recognized that recanalization does not necessarily lead to reperfusion.7–9 One reason may be that a primary clot can break into fragments that migrate and occlude smaller arterial branches downstream of the primary occlusive lesion.10 Furthermore, even when recanalization is achieved, blood still may not flow due to tissue edema, microvascular damage or microvascular thrombi in the capillary bed, which has been termed “no-reflow” phenomenon.11–13 In contrast, reperfusion can occur (or perfusion can be transiently maintained) despite persistence of the primary occlusive lesion because of recruitment of collateral flow.9, 14 The concept that restoration of capillary perfusion and adequate collateral flow predict smaller infarct volumes, and better clinical outcomes, whereas lack of reperfusion coupled with poor collateral flow predicts larger infarct volumes and worse clinical outcomes remains to be definitively proven.
The objective of this study was to determine whether reperfusion and collateral flow are more accurate predictors of imaging outcomes (follow-up infarct volume, infarct growth, salvaged penumbra) and clinical outcomes (discharge NIHSS and discharge mRS) than recanalization.
METHODS
Design
Imaging data obtained as part of standard clinical stroke care at our institution were retrospectively reviewed after approval of the institutional review board. At our institution, patients with suspicion of acute stroke and no history of significant renal insufficiency or contrast allergy routinely undergo a stroke CT protocol including noncontrast CT (NCT) of the brain, Perfusion-CT (PCT) at two cross-sectional positions, CT-angiogram (CTA) of the cervical and intracranial vessels, and post-contrast cerebral CT, obtained in this chronological sequence.
We retrospectively identified all consecutive patients admitted at our institution between July 2006 and July 2008 who met the following inclusion criteria: (a) admission to the emergency room with signs and symptoms suggesting hemispheric stroke within 12 hours after symptom onset; (b) completion of a stroke CT protocol upon admission; (c) no evidence of intracerebral hemorrhage on the admission NCT; (d) a “recanalization/reperfusion” stroke CT protocol performed between 5 and 60 hours following the admission stroke CT protocol; and (e) discharge or follow-up noncontrast CT.
Clinical Variables and Outcomes
Patients’ medical charts were reviewed for demographics, symptom onset time, time to admission, time to imaging, time to revascularization therapy, type of revascularization therapy, admission and discharge NIH stroke scale (NIHSS) scores and discharge modified Rankin score (mRS).
Imaging Acquisition Protocol and Image Post-Processing
PCT and CTA studies were obtained on 64-slice CT scanners according to previously reported protocols. 15, 16 PCT data were analyzed utilizing commercially available PCT software (Brain Perfusion, Philips Healthcare, Cleveland, OH, USA) according to a previously reported protocol. 17
Image Analysis
Matching slices on the admission PCT, on the reperfusion PCT and on the discharge/follow-up noncontrast CT were used for assessment of admission perfusion, reperfusion and follow-up infarct volume. CTA datasets were used for assessment of the site of occlusion, collaterals and recanalization.
Imaging Assessment of Admission Infarct Core and Penumbra
Volumes of infarct core and penumbra - as defined above - on the admission PCT slices were recorded.
Imaging Assessment of Reperfusion
Volumes VCBV, VCBF, and VMTT of abnormal CBV (CBV < 2.0 ml*100g−1), abnormal CBF (CBF <66% of the contralateral, nonischemic MTT) and abnormal MTT (MTT > 145% of the contralateral, nonischemic MTT) 17 on the admission PCT slices and on the matching reperfusion PCT slices were recorded.
With superscript indices ad for admission and re for reperfusion, CBV, CBF and MTT indices of reperfusion are defined as follows and given in %:
Imaging Assessment of Site and Degree of Occlusion at Admission
On the admission CTA, the degree of occlusion in the internal carotid artery (ICA), supraclinoid ICA, M1 and M2 segments was measured as a cross-section reduction of 0–100% compared to a non-affected segment. Carotid occlusions (ICA and supraclinoid ICA) were considered separately from middle cerebral artery (MCA) occlusions (M1 and M2).
Imaging Assessment of Recanalization
On the recanalization CTA, the degree of occlusion in the ICA, supraclinoid ICA, M1 and M2 segments was similarly measured. If an occlusion was present on the admission CTA study, a recanalization index was calculated by subtracting the post-treatment degree of occlusion from the admission degree of occlusion.
Recanalization of the carotid (ICA and supraclinoid ICA) and middle cerebral artery (M1 and M2) were considered separately. We defined recanalization as carotid recanalization index > 50% or MCA recanalization index > 50%, depending on the occluded segments. If a 100% recanalization index in one arterial segment was accompanied by a new occlusion in its distal segment, distal migration of the clot was diagnosed.
Imaging Assessment of Collaterals
On the admission CTA, the collateral flow was graded based on a prior reported scoring system on a scale from 0 to 3.18, 19, and then dichotomized into poor (0/1) or good (2/3).
Imaging Outcomes
The follow-up infarct volume on the discharge/follow-up NCT slices matching the admission and reperfusion PCT slices was recorded.
The infarct growth was calculated as the follow-up infarct volume on the discharge/follow-up NCT slices matching the admission PCT slices minus the volume of infarct core on the admission PCT slices.
The salvaged penumbra was calculated as the total volume of MTT abnormality on the admission PCT slices minus the follow-up infarct volume on the discharge/follow-up NCT slices matching the admission PCT slices.
Statistical Analysis
To check for a possible bias introduced by different imaging times, Wilcoxon rank-sum tests were used to compare patients with recanalization and with reperfusion against those without in terms of time from admission CT to “recanalization/reperfusion” CT and discharge or follow-up CT.
To assess the influence of recanalization status on reperfusion indices, T-test comparison was used to compare the patients with and without recanalization in terms of CBV, CBF and MTT reperfusion indices.
Kruskal-Wallis analysis of variance was used to assess the influence of recanalization status on MTT reperfusion indices, when stratified by collateral scores.
To assess the predictive value of reperfusion, recanalization and collateral flow, the imaging outcomes (follow-up infarct volume, infarct growth and salvaged penumbra) and the clinical outcomes (discharge mRS) were considered successively. For each outcome, univariate analysis was performed to evaluate the predictive value of the imaging and clinical variables. Subsequently, a multivariate, mixed effect model involving forward-stepwise selection with a significant threshold set at 0.05 was built from the variables that had a univariate p-value < 0.2. The model further included interaction terms between recanalization/reperfusion and volume of baseline penumbra. Variables such as volume of baseline penumbra, recanalization indices and reperfusion indices were first considered as continuous variables; subsequently, different thresholds for dichotomization were tested, and the ones providing the same statistical significance as the continuous variables were retained.
RESULTS
Patients and Imaging Studies
Twenty-two patients (8 male and 14 female) admitted at our institution from July 2006 to July 2008 were retrospectively identified meeting the inclusion criteria. Patient age was 69±14 years (mean±standard deviation). Mean time from symptom onset to admission was 2.2±2.5 hours (range = 0.5 to 5.6 hours); and mean time from symptom onset to admission stroke CT study was 3±2.7 hours (range = 1 to 12 hours). All admission stroke CT were obtained prior to treatment. Recanalization/reperfusion stroke CT protocol was performed a mean time of 25 hours (range = 4.7 to 60 hours) after the admission stroke CT protocol; and the discharge or follow-up noncontrast CT was performed a mean time of 31 days (range = 1 to 210 days) after the admission stroke CT protocol (Table 1).
Table 1.
Time intervals between admission and imaging studies in the different study patient groups.
| All (n=22) | Reperfusion (n=10) | NO reperfusion (n=12) | Recanalization (n=13) | NO recanalization (n=9) | |
|---|---|---|---|---|---|
| Admission CT to recanalization/reperfusion CT | |||||
| Mean (hours) | 25.3 | 21.8 | 28.8 | 21.0 | 30.3 |
| Standard deviation | 14.8 | 14.1 | 15.5 | 13.4 | 15.5 |
| Wilcoxon rank-sum test | p = 0.55 | p = 0.17 | |||
| Admission CT to follow-up CT | |||||
| Mean (days) | 30.6 | 29.8 | 31.4 | 45.7 | 12.6 |
| Standard deviation | 62.4 | 61.9 | 65.9 | 78.2 | 30.9 |
| Wilcoxon rank-sum test | p = 0.52 | p = 0.20 | |||
Median admission NIHSS was 14 (interquartile range = 10.5–17). Median discharge NIHSS was 4 (interquartile range = 2.25–8.75). Median discharge mRS was 2 (interquartile range = 1–4).
Ten patients received tPA only (between 1 and 4.5 hours after symptom onset). Two patients were treated using the MERCI clot retrieval device (between 2 and 5 hours after symptom onset). Seven patients were given tPA first (between 1 and 4 hours after symptom onset) and subsequently treated using the MERCI clot retrieval device (between 1.5 and 5 hours after symptom onset). Three patients received supportive care without treatment by tPA or the MERCI clot retrieval device.
Assessment of Admission Infarct Core, Penumbra, and Reperfusion
Volume of CBV abnormality (also considered as volume of infarct core) on the admission PCT slices was 33.1±32.0 mL. Volume of CBF abnormality on the admission PCT slices was 101.3±52.6 mL. Volume of MTT abnormality on the admission PCT slices was 114.6±62.5 mL. Volume of penumbra on the admission PCT slices was 81.5±47.0 mL.
CBV index of reperfusion was 54%±59% (range: −78% to 100%). CBF index of reperfusion was 56%±41% (−27% to 100%). MTT index of reperfusion was 65%±35% (2% to 100%).
Site and Degree of Occlusion, Recanalization and Collaterals
On the admission CTA study, 19 of 22 patients had an acute arterial occlusive lesion. One patient had only carotid occlusions, 15 had only MCA occlusions, and 3 had both carotid and MCA occlusions. The ICA was occluded in 3 patients, the supraclinoid ICA was occluded in 4 patients, the M1 segment was completely occluded in 14 patients and partially occluded in 1 patient, and the M2 segment was completely occluded in 9 patients and nearly completely occluded in 2 patients. In the 3 remaining patients, no arterial occlusive lesion could be detected on the admission CTA study, but PCT findings were consistent with acute stroke.
Recanalization was achieved in 11 of the 15 patients that had only MCA occlusions, and in 1 of the 3 patients with both carotid and MCA occlusions. Distal migration of the clot was diagnosed in two patients, both with complete M1 occlusion on the admission CTA and occlusion of M2 branches on the recanalization CTA study.
On the admission CTA study, 7 patients had poor collateral flow and 17 patients had good collateral flow.
Follow-up Infarct Volume, Infarct Growth and Salvaged Penumbra
The follow-up infarct volume on the slices matching the admission/reperfusion PCT slices was 50.3±58.1 mL. The infarct growth matching the admission/reperfusion PCT slices was 17.2±40.1 mL. The salvaged penumbra matching the admission/reperfusion PCT slices was 51.0±50.4 mL.
Relationship between Recanalization, Reperfusion and Collateral Score
Patients with recanalization had higher CBV (p = 0.16), CBF (p = 0.04) and MTT (p = 0.18) reperfusion indices (Fig. 1). However, not all patients with recanalization showed reperfusion (Fig. 2).
Fig. 1. CBV, CBF and MTT reperfusion indices according to the recanalization status.

Patients with recanalization had higher reperfusion indices than patients with no recanalization (CBV p = 0.16; CBF p = 0.04; MTT p = 0.18). The three black dots represent patients in which, although recanalization has been achieved, CBV and CBF reperfusion indices were very low or negative.
Fig. 2. Absence of reperfusion, even in the setting of complete recanalization, may result in a large follow-up infarct volume.


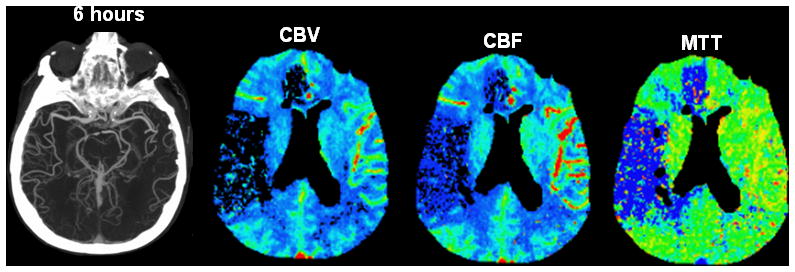

A. Axial noncontrast CT performed upon admission (2.5 hours after onset of symptoms) shows subtle hypoattenuation of the right putamen but no sulcal effacement in the right MCA territory.
B. Axial maximum-intensity projection image from CTA performed upon admission shows occlusion of the M1 segment of the right MCA (arrow). PCT maps show decreased CBV and CBF in the right frontal and temporal lobes and a larger region of prolonged MTT that also involves the right ACA territory. The region of decreased CBV corresponds to the infarct core, whereas the surrounding mismatch region of prolonged MTT represents the ischemic penumbra. The patient received endovascular thrombectomy with a MERCI device.
C. Axial maximum-intensity projection image from CTA and PCT performed 6 hours after admission show that, despite complete recanalization of the right MCA (arrow), PCT maps show that the region of decreased CBV and CBF has expanded to include the right anterior ACA territory that was previously considered tissue at risk. MTT is still abnormally increased in the right superficial MCA territory and in a portion of the right ACA territory.
D. Axial noncontrast CT performed 48 hours after admission shows marked hypoattenuation and edema in the territories matching the perfusion deficit on the reperfusion PCT.
Patients with recanalization had high MTT reperfusion indices, regardless of their collateral score. On the other hand, among patients with no recanalization, those with good collateral score were more likely to have higher MTT reperfusion indices (p = 0.11) than the patients with poor collateral score, although a statistical significant difference was not achieved (Fig. 3). Similar observations were made for the CBF and CBV reperfusion scores.
Fig. 3. MTT reperfusion index according to recanalization status and collateral scores.

Patients with recanalization had high MTT reperfusion indices, regardless of their collateral score. However, in patients with no recanalization, those with good collateral flow (score of 2 or 3) had a higher MTT reperfusion index than those with poor collateral flow (score of 0 or 1).
Prediction of Imaging and Clinical Endpoints
In terms of the prediction of the follow-up infarct volume on the slices matching the admission and reperfusion PCT, the univariate analysis (Table 2) demonstrated the following variables to be statistically significant: admission NIHSS, volume of admission infarct core, volume of penumbra, MCA occlusion, CBF and MTT reperfusion indices (Fig. 4a). These variables were considered for the multivariate analysis. Because they were the focus of the present study, we also included carotid recanalization and MCA recanalization in the multivariate analysis (Fig. 4a). Because recanalization and reperfusion may theoretically save penumbra but not already established infarct, we also included the interaction terms between penumbra and recanalization or reperfusion status. Only the interaction terms between penumbra and reperfusion indices were statistically significant in the univariate analysis. Finally, because the CBF and MTT reperfusion indices were highly correlated, we only considered the MTT reperfusion index in the multivariate analysis.
Table 2.
Univariate analysis: imaging and clinical variables for the prediction of the follow-up infarct volume on the slices matching the admission and reperfusion PCT. The asterisk indicates which variables were retained in the multivariate analysis.
| Effect Size | 95% CI | p value | |
|---|---|---|---|
| Clinical variables | |||
| Admission NIHSS | 7.3 | 2.47 – 12.14 | 0.005* |
| Time to revascularization therapy | 0.75 | 1.04 – 2.54 | 0.391 |
| Type of revascularization therapy | −12.57 | −102.05 – 76.90 | 0.771 |
| Imaging variables | |||
| Volume of admission infarct core | 1.36 | 0.80 – 1.92 | < 0.001* |
| Volume of admission penumbra | 0.4 | −0.14 – 0.95 | 0.137* |
| Carotid occlusion > 50% | 8.57 | −60.03 – 77.18 | 0.797 |
| MCA occlusion > 50% | 45.98 | −13.51 – 105.48 | 0.123* |
| Collateral score | −41.13 | −100.76 – 18.51 | 0.165* |
| Carotid recanalization index > 50% | 21.99 | −69.64 – 113.61 | 0.622* |
| MCA recanalization index > 50% | 6.46 | −56.71 – 69.64 | 0.833* |
| MTT reperfusion index > 75% | −54.96 | −101.61 – −8.31 | 0.023* |
| CBF reperfusion index > 75% | −53.27 | −102.45 – −4.10 | 0.035* |
| Interaction term for MTT reperfusion index > 75% and volume of admission penumbra > 50mL | −62.94 | −110.79 – −15.10 | 0.013* |
| Interaction term for CBF reperfusion index > 75% and volume of admission penumbra > 50mL | −67.97 | −115.54 – −20.41 | 0.008* |
Fig. 4. Imaging endpoints (follow-up infarct volume, infarct growth and salvaged penumbra) according to reperfusion and recanalization status.


A. Follow-up infarct volume according to reperfusion and recanalization status. Patients with reperfusion had a smaller follow-up infarct volume than patients with no reperfusion, regardless of their recanalization status.
B. Infarct growth according to reperfusion and recanalization status. Patients with reperfusion had smaller infarct growth than patients with no reperfusion, regardless of their recanalization status.
C. Salvaged penumbra according to reperfusion and recanalization status. Patients with reperfusion had larger salvaged penumbra than patients with no reperfusion, regardless of their recanalization status.
In the multivariate analysis (Table 3), only two variables were identified as significantly associated with the follow-up infarct volume on the slices matching the admission and reperfusion PCT: the volume of the admission infarct core and the interaction term between the MTT reperfusion index and the penumbra.
Table 3.
Multivariate analysis: imaging variables for the prediction of the follow-up infarct volume on the slices matching the admission and reperfusion PCT.
| Effect Size | 95% CI | p value | |
|---|---|---|---|
| Volume of admission infarct core | 1.15 | 0.62 – 1.67 | < 0.001 |
| Interaction term for MTT reperfusion index > 75% and volume of admission penumbra > 50mL | −48.29 | −82.34 – −14.24 | 0.008 |
We performed similar univariate and multivariate analyses for the other outcomes. Multivariate analyses showed the following variables to be significant:
the penumbra volume (effect size: 47.69, 95% confidence interval (CI): 6.83 – 88.35, p = 0.024) and the interaction term between the MTT reperfusion index and the penumbra (effect size: −50.15, 95% CI: −82.83 – −17.47, p = 0.005) for the infarct growth;
the interaction term between the MTT reperfusion index and the penumbra (effect size: 70.57, 95% CI: 33.41 – 107.73, p = 0.001) for the salvaged penumbra, and
the volume of the admission infarct core (effect size: 0.03, 95% CI: 0.01 – 0.05, p = 0.008) for the NIHSS score and the modified Rankin score at discharge.
Recanalization status did not influence infarct growth (Fig. 4b) and salvaged penumbra (Fig. 4c). Patients with MTT reperfusion index > 75% had smaller follow-up infarct growth (see Fig. 4b) and larger salvaged penumbra (see Fig. 4c).
Of note, the time intervals from symptom onset to scanning and treatment were tested as possible confounders, but they did not reveal significant.
DISCUSSION
In this study, we provide evidence that reperfusion is a more accurate predictor of follow-up infarct volume than recanalization. Evidence for the accuracy of reperfusion is that patients with a MTT reperfusion index > 75% were more likely to have smaller follow-up infarct volumes than patients with recanalization. Our results also indicate that collateral flow – although not by itself a predictor of follow-up infarct volume – may be a contributor to reperfusion in the absence of recanalization. Indeed, in patients without recanalization, those with good collateral flow had higher MTT reperfusion indices than those with poor collateral flow.
The predictive value of reperfusion in terms of follow-up infarct volume was more significant in patients presenting at admission with a large ischemic penumbra, as reflected by an interaction term between reperfusion and penumbra. In patients with no or limited penumbra, i.e. no tissue that can be salvaged, the degree of reperfusion does not influence the follow-up infarct volume.
The reperfusion indices defined based on the MTT and CBF maps were highly correlated. We decided to focus on the MTT reperfusion index because MTT maps are easier to interpret, since there is no systematic difference in mean transit time between gray and white matter. Testing of different thresholds showed that a 75% or more resolution of the MTT abnormality was the optimal threshold to identify patients with reperfusion.
Our study emphasizes the conceptual distinction between recanalization and reperfusion by demonstrating their different predictive values. Several factors may contribute to explain the difference between recanalization and reperfusion. One of these factors may be distal embolization of thrombus, which may counter the benefits of endovascular therapies and has been reported to occur in up to 16% of patients.10 Another potential factor is the no-reflow phenomenon. First described in the context of cerebral ischemia in 1967 11, the no-reflow phenomenon occurs when the primary occlusion is resolved but distal tissue remains unperfused or inadequately perfused. Multiple closely related factors contribute to this phenomenon, including edema, microvascular damage and microvascular obstruction.20, 21
The potential discordance between recanalization and reperfusion may have interfered with the assessment of treatment success in prior stroke trials, where recanalization and reperfusion were considered together as exchangeable concepts.22–24
We acknowledge several limitations to our study. Our follow-up infarct volume was not necessarily the final infarct volume, as imaging studies used to calculate the follow-up infarct volume were obtained relatively early (mean of 31 days). Of note, however, it has been shown that the final infarct volume does not change significantly after 30 days. 25 Conversely, recanalization/reperfusion imaging was obtained relatively late (mean of 25 hours), and recanalization/reperfusion observed at this stage may not have the ability to salvage viable ischemic tissue at risk. However, time from admission to recanalization/reperfusion imaging and to discharge imaging was not significantly different between the patients with and without recanalization, and between the patients with and without reperfusion. The timing in our retrospective study may not have been optimal, but it was similar in the compared groups, thus not introducing a bias in the analysis.
Another limitation in our study was the small number of enrolled patients, as well as its retrospective design. Also, we did not assess long-term clinical outcome. A prospective study could be designed to address this issue and validate our findings.
In conclusion, our study shows that reperfusion is a more accurate predictor of follow-up infarct volume than recanalization in patients with acute ischemic stroke. Future studies evaluating the efficacy of revascularization therapies for acute ischemic stroke should consider including an early assessment of post-treatment reperfusion, rather than relying solely on vascular imaging. We recommend a reduction of 75% or greater in the MTT abnormality volume to define reperfusion.
References
- 1.Tomsick T. TIMI, TIBI, TICI: I came, I saw, I got confused. AJNR Am J Neuroradiol. 2007;28:382–384. [PMC free article] [PubMed] [Google Scholar]
- 2.Tissue plasminogen activator for acute ischemic stroke. The National Institute of Neurological Disorders and Stroke rt-PA Stroke Study Group. N Engl J Med. 1995;333:1581–1587. doi: 10.1056/NEJM199512143332401. [DOI] [PubMed] [Google Scholar]
- 3.Zaidat OO, Suarez JI, Sunshine JL, Tarr RW, Alexander MJ, Smith TP, Enterline DS, Selman WR, Landis DM. Thrombolytic therapy of acute ischemic stroke: correlation of angiographic recanalization with clinical outcome. AJNR Am J Neuroradiol. 2005;26:880–884. [PMC free article] [PubMed] [Google Scholar]
- 4.del Zoppo GJ, Koziol JA. Recanalization and stroke outcome. Circulation. 2007;115:2602–2605. doi: 10.1161/CIRCULATIONAHA.107.698225. [DOI] [PubMed] [Google Scholar]
- 5.Rha JH, Saver JL. The impact of recanalization on ischemic stroke outcome: a meta-analysis. Stroke. 2007;38:967–973. doi: 10.1161/01.STR.0000258112.14918.24. [DOI] [PubMed] [Google Scholar]
- 6.Olivot JM, Mlynash M, Thijs VN, Kemp S, Lansberg MG, Wechsler L, Schlaug G, Bammer R, Marks MP, Albers GW. Relationships between infarct growth, clinical outcome, and early recanalization in diffusion and perfusion imaging for understanding stroke evolution (DEFUSE) Stroke. 2008;39:2257–2263. doi: 10.1161/STROKEAHA.107.511535. [DOI] [PMC free article] [PubMed] [Google Scholar]
- 7.Tomsick T, Broderick J, Carrozella J, Khatri P, Hill M, Palesch Y, Khoury J for the Interventional Management of Stroke III. Revascularization Results in the Interventional Management of Stroke II Trial. AJNR Am J Neuroradiol. 2008;29:582–587. doi: 10.3174/ajnr.A0843. [DOI] [PMC free article] [PubMed] [Google Scholar]
- 8.Nogueira RG, Schwamm LH, Hirsch JA. Endovascular Approaches to Acute Stroke, Part 1: Drugs, Devices, and Data. AJNR Am J Neuroradiol. 2009 doi: 10.3174/ajnr.A1486. [DOI] [PMC free article] [PubMed] [Google Scholar]
- 9.Soares BP, Chien JD, Wintermark M. MR and CT monitoring of recanalization, reperfusion, and penumbra salvage: everything that recanalizes does not necessarily reperfuse! Stroke. 2009;40:S24–27. doi: 10.1161/STROKEAHA.108.526814. [DOI] [PubMed] [Google Scholar]
- 10.Janjua N, Alkawi A, Suri MF, Qureshi AI. Impact of arterial reocclusion and distal fragmentation during thrombolysis among patients with acute ischemic stroke. AJNR Am J Neuroradiol. 2008;29:253–258. doi: 10.3174/ajnr.A0825. [DOI] [PMC free article] [PubMed] [Google Scholar]
- 11.Majno GAA, Chaing J, Wright RL. Noreflow after cerebral ischemia. Lancet. 1967;2:569–570. [Google Scholar]
- 12.Ames A, 3rd, Wright RL, Kowada M, Thurston JM, Majno G. Cerebral ischemia. II. The no-reflow phenomenon. Am J Pathol. 1968;52:437–453. [PMC free article] [PubMed] [Google Scholar]
- 13.del Zoppo GJ. Virchow’s triad: the vascular basis of cerebral injury. Rev Neurol Dis. 2008;5 (Suppl 1):S12–21. [PMC free article] [PubMed] [Google Scholar]
- 14.Liebeskind DS. Collaterals in acute stroke: beyond the clot. Neuroimaging Clin N Am. 2005;15:553–573, x. doi: 10.1016/j.nic.2005.08.012. [DOI] [PubMed] [Google Scholar]
- 15.Nguyen-Huynh MN, Wintermark M, English J, Lam J, Vittinghoff E, Smith WS, Johnston SC. How accurate is CT angiography in evaluating intracranial atherosclerotic disease? Stroke. 2008;39:1184–1188. doi: 10.1161/STROKEAHA.107.502906. [DOI] [PubMed] [Google Scholar]
- 16.Wintermark M, Sincic R, Sridhar D, Chien JD. Cerebral perfusion CT: technique and clinical applications. J Neuroradiol. 2008;35:253–260. doi: 10.1016/j.neurad.2008.03.005. [DOI] [PubMed] [Google Scholar]
- 17.Wintermark M, Flanders AE, Velthuis B, Meuli R, van Leeuwen M, Goldsher D, Pineda C, Serena J, van der Schaaf I, Waaijer A, Anderson J, Nesbit G, Gabriely I, Medina V, Quiles A, Pohlman S, Quist M, Schnyder P, Bogousslavsky J, Dillon WP, Pedraza S. Perfusion-CT assessment of infarct core and penumbra: receiver operating characteristic curve analysis in 130 patients suspected of acute hemispheric stroke. Stroke. 2006;37:979–985. doi: 10.1161/01.STR.0000209238.61459.39. [DOI] [PubMed] [Google Scholar]
- 18.Tan JC, Dillon WP, Liu S, Adler F, Smith WS, Wintermark M. Systematic comparison of perfusion-CT and CT-angiography in acute stroke patients. Ann Neurol. 2007;61:533–543. doi: 10.1002/ana.21130. [DOI] [PubMed] [Google Scholar]
- 19.Kim JJ, Fischbein NJ, Lu Y, Pham D, Dillon WP. Regional angiographic grading system for collateral flow: correlation with cerebral infarction in patients with middle cerebral artery occlusion. Stroke. 2004;35:1340–1344. doi: 10.1161/01.STR.0000126043.83777.3a. [DOI] [PubMed] [Google Scholar]
- 20.del Zoppo GJ, Mabuchi T. Cerebral microvessel responses to focal ischemia. JCereb Blood Flow Metab. 2003;23:879–894. doi: 10.1097/01.WCB.0000078322.96027.78. [DOI] [PubMed] [Google Scholar]
- 21.Sandoval KE, Witt KA. Blood-brain barrier tight junction permeability and ischemic stroke. Neurobiol Dis. 2008;32:200–219. doi: 10.1016/j.nbd.2008.08.005. [DOI] [PubMed] [Google Scholar]
- 22.Hacke W, Albers G, Al-Rawi Y, Bogousslavsky J, Davalos A, Eliasziw M, Fischer M, Furlan A, Kaste M, Lees KR, Soehngen M, Warach S. The Desmoteplase in Acute Ischemic Stroke Trial (DIAS): a phase II MRI-based 9-hour window acute stroke thrombolysis trial with intravenous desmoteplase. Stroke. 2005;36:66–73. doi: 10.1161/01.STR.0000149938.08731.2c. [DOI] [PubMed] [Google Scholar]
- 23.Furlan AJ, Eyding D, Albers GW, Al-Rawi Y, Lees KR, Rowley HA, Sachara C, Soehngen M, Warach S, Hacke W. Dose Escalation of Desmoteplase for Acute Ischemic Stroke (DEDAS): evidence of safety and efficacy 3 to 9 hours after stroke onset. Stroke. 2006;37:1227–1231. doi: 10.1161/01.STR.0000217403.66996.6d. [DOI] [PubMed] [Google Scholar]
- 24.Hacke W, Furlan AJ, Al-Rawi Y, Davalos A, Fiebach JB, Gruber F, Kaste M, Lipka LJ, Pedraza S, Ringleb PA, Rowley HA, Schneider D, Schwamm LH, Leal JS, Sohngen M, Teal PA, Wilhelm-Ogunbiyi K, Wintermark M, Warach S. Intravenous desmoteplase in patients with acute ischaemic stroke selected by MRI perfusion-diffusion weighted imaging or perfusion CT (DIAS-2): a prospective, randomised, double-blind, placebo-controlled study. Lancet Neurol. 2009;8:141–150. doi: 10.1016/S1474-4422(08)70267-9. [DOI] [PMC free article] [PubMed] [Google Scholar]
- 25.Gaudinski MR, Henning EC, Miracle A, Luby M, Warach S, Latour LL. Establishing final infarct volume: stroke lesion evolution past 30 days is insignificant. Stroke. 2008;39:2765–2768. doi: 10.1161/STROKEAHA.107.512269. [DOI] [PMC free article] [PubMed] [Google Scholar]