

Abstract
The recent discovery of short neural precursors (SNPs) in the murine neocortical ventricular zone (VZ) challenges the widely held view that radial glial cells (RGCs) are the sole occupants of this germinal compartment and suggests that precursor variety is an important factor of brain development. Here, we use in utero electroporation and genetic fate mapping to show that SNPs and RGCs cohabit the VZ but display different cell cycle kinetics and generate phenotypically different progeny. In addition, we find that RGC progeny undergo additional rounds of cell division as intermediate progenitor cells (IPCs), whereas SNP progeny generally produce postmitotic neurons directly from the VZ. By clearly defining SNPs as bona fide VZ residents, separate from both RGCs and IPCs, and uncovering their unique proliferative and lineage properties, these results demonstrate how individual neural precursor groups in the embryonic rodent VZ create diversity in the overlying neocortex.
Introduction
The ventricular zone (VZ) of the dorsal telencephalon contains the progenitor cells that produce all of the various excitatory neurons of the mature neocortex. This process occurs during prenatal mammalian brain development through a precisely regulated series of proliferative and neurogenic divisions. Whether the diversity in neuronal progeny is generated from a similarly heterogeneous pool of precursor cells remains unclear. In fact, numerous studies suggest that the rodent VZ is composed predominantly of a single, multipotent cell type: radial glial cells (RGCs) (Hartfuss et al., 2001; Miyata et al., 2001; Noctor et al., 2001, 2002; Anthony et al., 2004; Pinto et al., 2008). However, this view contrasts with recent studies in which another cell type, termed short neural precursors (SNPs), was identified in the mouse VZ, which differs morphologically and molecularly from RGCs (Gal et al., 2006; Mizutani et al., 2007). Furthermore, primate studies have clearly demonstrated a mix of committed neuronal and glial precursors in the VZ of human and monkey (Levitt et al., 1981; Zecevic, 2004; Howard et al., 2006; Mo et al., 2007). Delineating the composition of the rodent VZ is therefore important both for understanding how neural stem cells and progenitors properly form the cerebral cortex as well as for elucidating possible mechanisms of species-specific diversity.
In addition to the neural precursors in the VZ, a separate class of neuronal progenitors has been described in the overlying subventricular zone (SVZ). These intermediate progenitor cells (IPCs) are generated from RGCs (Noctor et al., 2004) and are now considered a secondary progenitor population within the rodent and primate neocortex. Although IPCs reside in the SVZ, there is some physical intermixing between IPCs and RGCs in the basal VZ (Anthony et al., 2004; Haubensak et al., 2004; Miyata et al., 2004). A small number of IPCs have also been shown to divide at the ventricular surface, where they display morphological characteristics similar to SNPs (Noctor et al., 2008; Kowalczyk et al., 2009). Therefore, it is unclear whether SNPs are a distinct population or whether they simply represent a subset of the IPC population.
To resolve these issues, we developed powerful new methods allowing cell cycle and lineage analyses of multiple contiguously cycling populations in vivo. Here, we show that the cell cycle kinetics, specifically G1-phase duration, of SNPs and RGCs are markedly different. Moreover, genetic fate mapping demonstrates that SNPs and RGCs give rise to distinct neuronal lineages because of differential reliance on IPC amplification. These data for the first time uncover the proliferative differences between SNPs and RGCs and demonstrate how these differences lead to diversity of neuronal daughter cells during neurogenesis.
Materials and Methods
In utero electroporation surgery.
In utero electroporation (IUE) surgeries were performed on ICR mice bred at Children's National Medical Center. Females were checked daily for vaginal plugs; the day of plug was considered embryonic day 0.5 (E0.5). Surgeries were performed at E13.5 or E14.5. Electroporation was performed as previously described (Gal et al., 2006). Briefly, dams were anesthetized with ketamine/xylazine mixture, and their uterine horns were exposed by midline laparotomy. One microliter of plasmid DNA (3–4 μg/μl) mixed with 0.1% fast green dye in phosphate buffer was injected intracerebrally, via pulled micropipette, through the uterine wall and amniotic sac. The anode of a Tweezertrode (Genetronics) was placed over the dorsal telencephalon outside the uterine muscle. Four 40 V pulses (50 ms duration separated by 950 ms) were applied with a BTX ECM830 pulse generator (Genetronics). When the desired number of embryos had been electroporated, the uterine horns were placed back inside the abdomen, the cavity was filled with warm physiological saline, and the abdominal muscle and skin incisions were closed with silk sutures. Dams were placed in clean cage to recover and monitored closely. These procedures conform to U. S. Department of Agriculture regulations and were approved by the Children's National Medical Center Institutional Animal Care and Use Committee.
Plasmid vectors.
The CAG-RFP plasmid expresses red fluorescent protein under the control of the chicken β-actin promoter (gift from J. LoTurco). The Tα1-hGFP plasmid (gift from S. Goldman, University of Rochester, Rochester, NY) expressed humanized green fluorescent protein (GFP) under the control of the tubulin α-1 (Tα1) promoter in SNPs. The glutamate-aspartate transporter (GLAST) promoter (gift from D. J. Volsky, Columbia University, New York, NY) was subcloned into a promoterless, farnesylated eGFP plasmid (Clontech) to make the GLAST-eGFPf plasmid to label RGCs. Tα1-Cre plasmid was made by subcloning the Tα1 promoter (from pTα1-hGFP) into the pBS185 Cre vector (Invitrogen); pGLAST-Cre was made by subcloning the GLAST promoter and the Cre fragment from pBS185 into the pBluescript II SK (+/−) vector (Stratagene). pNestin-Cre was a gift from C. Y. Kuan (Cincinnati Children's Hospital, Cincinnati, OH), and the GFP reporter plasmid (pCALNL-GFP), in which the GFP sequence lies downstream of a floxed Neo cassette under the control of a CAG driver, was a gift from T. Matsuda (Harvard Medical School, Boston, MA).
Determination of plasmid infiltration.
MAX Efficiency DH5α Competent Cells (Invitrogen) were transformed with CAG-RFP plasmid. The cells were grown in LB broth containing 50 μg/ml 5-bromodeoxyuridine (BrdU) (Sigma-Aldrich), after which the plasmid DNA was concentrated and purified with the QIAGEN EndoFree Maxi Kit. The resulting BrdU-laced plasmid was injected intracerebrally and drawn into the cortical wall via IUE. Immediately after surgery, the brains were removed, fixed overnight in 4% paraformaldehyde (PFA) (Sigma-Aldrich), and cryopreserved in 30% sucrose (Sigma-Aldrich) solution for sectioning. To determine the depth of plasmid infiltration after IUE, sectioned brains were processed for BrdU immunofluorescence (see below). It was determined that BrdU reached ∼160 μm into the tissue.
Cell cycle phase dependence of transfection.
IUE was performed with native CAG-RFP plasmid, and single intraperitoneal BrdU injections (50 mg/kg) were administered 2 h before (−2 h), immediately after (0 h), or 2, 4, or 6 h after the surgery. The 0 h injection labeled cells in S-phase at the time of electroporation, whereas the −2 h injection labeled cells in S- through M-phase at the time of IUE; other time points labeled cells in S-phase at given intervals after IUE. Animals were allowed to survive 14 h after IUE, at which time the mother was killed and the fetuses' heads were removed, fixed overnight in 4% PFA, cryopreserved in 30% sucrose, and sectioned on a cryostat. Sectioned tissue (20 μm) was then processed for BrdU immunofluorescence (see below), using a FITC-conjugated secondary antibody (goat anti-mouse IgG1, 1:200 in 1.5% normal goat serum (NGS) in PBS; Southern Biotechnology Associates). CAG-RFP+BrdU+ (double-positive) cells were counted in a 100 × 100 μm area on confocal Z-stacks and divided by the number of RFP+ cells in the same area to determine the percentage of double-positive cells.
IUE/BrdU method.
IUE was performed at E14.5 first using the CAG-RFP plasmid as a control to compare our experimental values to cumulative BrdU values, and subsequently with pTα1-hGFP to label SNPs and pGLAST-eGFPf to label RGCs, once the method had been validated. Single, intraperitoneal BrdU injections were given at increasing intervals after IUE (one injection per mouse), and mice were killed 2 h later. After killing, fetuses' heads were removed, fixed, sectioned, and processed for BrdU immunofluorescence (see below). Double-positive cells were counted in 100 × 100 μm area on confocal Z-stacks obtained with a 40× objective. The number of double-positive cells was then divided by the number of XFP+ cells in the same area to calculate the labeling indices for the respective populations. The time at which the slope of the labeling index increased from zero was established as the length of G1-phase (TG1).
IUE/M–M-phase method.
Tissue from the IUE/BrdU experiments was used for these analyses. The nucleic acid stain SYTO 24 (1:2000; Invitrogen) or propidium iodide (1:1000; Sigma-Aldrich) was used to visualize condensed chromatin on RFP+ or GFP+ sections, respectively. Mitotic electroporated cells at the ventricular surface were counted and divided by the total number of electroporated cells within 70 μm of ventricular surface to calculate the mitotic index. Reentry of transfected (XFP+) cells into M-phase (i.e., cell cycle duration, TC) was determined to be the time at which the slope of the line increased significantly from zero.
Postnatal GFP+ neuron morphological analysis.
Morphological analyses were performed on 50 μm vibratome sections from postnatal day 10 (P10) brains that had been coelectroporated at E14.5 with Tα1-, GLAST-, or Nestin-Cre plasmid and a floxed-stop GFP plasmid. The morphology of labeled neurons was assessed as either pyramidal or stellate compared with Ramon y Cajal's drawings of these subtypes. Zeiss LSM Image Browser software was used to make and rotate three-dimensional projections of confocal Z-stacks so that entire cell soma and projections could be visualized. Cells that were not easily identifiable as either pyramidal or stellate neurons were not counted.
Immunohistochemistry.
Immunostaining for BrdU was performed as follows: 20 μm sections were rehydrated in PBS containing 0.1% Triton X-100 (PBS-T; Sigma-Aldrich). After 5 min treatment with 0.1% trypsin (Sigma-Aldrich) in 0.1 m Tris (Sigma-Aldrich) buffer containing 0.1% calcium chloride (Sigma-Aldrich), sections were incubated in 2N hydrochloric acid (Thermo Fisher Scientific) for 1 h at room temperature. Sections were then blocked in 10% NGS (Sigma-Aldrich) in 0.1% PBS-T for 30 min and incubated overnight in mouse anti-BrdU antibody (13 μl in 1 ml PBS-T; BD Biosciences) at 4°C. Sections were washed five times for 5 min each time in 0.1% PBS-T, incubated at room temperature for 1 h in goat anti-mouse IgG1 antibody, washed five times for 5 min each time in 0.1% PBS-T, and mounted with Vectashield Mounting Medium for Fluorescence (Vector Laboratories). Sections containing CAG-RFP+ cells were processed for BrdU immunofluorescence using a FITC-conjugated secondary antibody, whereas GFP+ sections required a TRITC-conjugated secondary antibody (both 1:200; Southern Biotechnology Associates).
Immunostaining for mouse anti-TUJ1 (1:500; Covance), rabbit anti-T-box brain 2 (Tbr2) (1:500; Abcam), rabbit anti-paired box gene 6 (Pax6) (1:1000; Covance), and mouse anti-Ki67 (1:200; BD Biosciences) was performed on 20 μm coronal sections from embryonic tissue fixed in 4% PFA and cryopreserved in 30% sucrose. Immunostaining for goat anti-Brn1 (1:100; Santa Cruz) was performed on postnatal (P10) tissue from mice perfused intracardially with ice-cold PBS followed by 4% PFA. Tissue was postfixed overnight in 4% PFA and then sectioned on a vibratome (50 μm; Leica). In all cases, sections were blocked 1 h at room temperature in 5% serum and 1% BSA (Sigma-Aldrich) in PBS plus 0.2% Triton X-100 (Sigma-Aldrich). Primary antibodies were applied overnight at 4°C. Sections were then washed three times for 5 min each time in PBS and incubated for 1 h at room temperature in secondary antibodies (1:200 for all). Secondary antibodies used were as follows: Alexa Fluor 546 donkey anti-goat, Alexa Fluor 543 goat anti-mouse IgG2a, Alexa Fluor 633 goat anti-rabbit (all Invitrogen), and TRITC-conjugated goat anti-mouse IgG1 (Southern Biotechnology Associates). Sections were washed three times for 5 min each time in PBS and counterstained with ToPro-3 (1:500; Invitrogen), and then coverslipped with Vectashield Mounting Medium for Fluorescence (Vector Laboratories).
Image acquisition.
Confocal images were acquired with a Zeiss LSM 510 Meta NLO system equipped with an Axiovert 200M microscope. GFP, SYTO 24, and FITC were excited at 488 nm; red fluorescent protein (RFP), propidium iodide, Alexa Fluor 543 and 546, and TRITC were excited at 543 nm; ToPro-3 and Alexa Fluor 633 were excited at 633 nm. Z-stacks 5–20 μm thick, composed of 1024 × 1024 pixel, 0.7- to 5 μm-thick optical sections, were collected using 10, 25, or 40× objectives depending on the experiment.
Image analysis.
To achieve continuity across experiments, only sections from the same general area of the dorsolateral neocortex were analyzed. Using anatomical landmarks such as the ganglionic eminences (fetal tissue) and the fimbria and CA1 of the hippocampus (postnatal tissue), sections from as close to the same rostrocaudal level as possible were used throughout.
Image analysis/cell counting was done with the Zeiss LSM Image Browser program. To determine recombined GFP+ cell allocation at E17.5, the depth of the cortical wall was measured and divided by 5, yielding five bins corresponding to the VZ, SVZ, intermediate zone (IZ), and lower and upper cortical plate (CP). GFP+ cells in each bin were counted across a 300-μm-wide column in collapsed confocal Z-stacks, and then divided by the total number of GFP+ cells in that column to give the percentage of total cells in each bin. For all other experiments, cells were counted in 225 μm2 areas on images taken with the 40× objective. In the Tbr2/TUJ1/Ki67/Pax6 immunostaining images, cells were only counted within 200 μm of the ventricular surface.
Statistical analysis.
Student's t tests were performed using Microsoft Excel to determine significance between groups in most experiments. However, ANOVA (in SigmaPlot) was used for the IUE/BrdU labeling index, and a nonparametric (median) regression was performed for the IUE/M–M-phase experiment. In all cases, confidence intervals were set at 95%, and values of p < 0.05 were considered significant.
Results
The mechanics of in utero electroporation enables VZ kinetic studies
We previously showed that the mouse VZ is heterogeneous with respect to its constituent neural precursors (Gal et al., 2006). Using time-lapse multiphoton imaging, it was determined that SNPs retract their basal processes during division at the ventricular surface, whereas RGCs maintain their basal fibers during mitosis (Miyata et al., 2001; Noctor et al., 2001, 2002). SNPs and RGCs were also distinguished based on their abilities to express GFP driven by the Tα1 or GLAST promoters, respectively. It was also recently found that VZ cells expressing the Tα1 and GLAST promoters differentially use the Notch signaling pathway (Mizutani et al., 2007). However, because these were the only known characteristics distinguishing SNPs from RGCs, we sought to identify additional differences between these precursor populations, starting with their cell cycle kinetics.
The physical intermixing of SNPs and RGCs in the VZ presented challenges for measuring potential differences in their proliferation in vivo. Cumulative BrdU labeling, a common technique for estimating cell cycle kinetics in vivo that labels all S-phase cells indiscriminately (Nowakowski et al., 1989), cannot distinguish between SNPs and RGCs. Since SNPs and RGCs were previously distinguished by their preferential promoter expression via IUE, this method seemed ideal to adapt for in vivo proliferation kinetic studies. However, despite the increasing use of IUE in developmental neuroscience, very little is known about the mechanics and temporal characteristics of IUE-induced transfection.
To use IUE in quantitative measurements of cell proliferation, both the location and the proliferative nature of the starting population of cells needed to be determined. As most IUE is performed with plasmid vectors requiring 10–18 h delays before DNA expression is detectable, it has not been possible to estimate the initial penetration depth of electroporated plasmid since cell division, migration, and apoptosis can all occur within this time frame. Thus, to uncover the location of DNA immediately after electroporation, we created a plasmid that did not require DNA transcription and translation to be detectable by physically tagging the plasmid with BrdU (supplemental Fig. 1B, available at www.jneurosci.org as supplemental material) (see Materials and Methods). Immediately after IUE with this BrdU-laced plasmid, we found that all VZ cells within the electroporated area of the neocortical wall were physically exposed to the delivered plasmid up to a depth of 160 μm from the surface of the ventricle (supplemental Fig. 1C, available at www.jneurosci.org as supplemental material).
The next steps were to determine whether all cells physically exposed to the plasmid also express the exogenous DNA and to uncover which cell cycle phases may be necessary for transfection. To do so, we tagged individual precursor groups by phase location using systemic injections of BrdU at various intervals before or after IUE at E14.5 with the ubiquitously expressed CAG-RFP plasmid. For example, injecting BrdU immediately after the IUE procedure labeled VZ cells in S-phase at the moment of electroporation. In this pulse-labeling procedure, quantification of the percentage of transfected (RFP+) cells that were also BrdU+ revealed that 70.87 ± 6.60% were colabeled (Fig. 1Ai,D), strongly suggesting a link between S-phase and plasmid expression. When BrdU was administered 2 h before IUE, which BrdU labeled cells from S-phase into M-phase at the moment of electroporation (Fig. 1Aii), there was almost complete colabeling of RFP+ cells with BrdU (95.97 ± 4.00%) (Fig. 1B,B′,D). Thus, despite the fact that the entire VZ appears to be exposed to plasmid DNA on IUE, only the cells arrayed through S- and M-phases at the moment of electroporation eventually express the plasmid. To determine the length of time after IUE that transfection and plasmid expression is still possible within the VZ, we allowed longer gap periods between IUE and subsequent BrdU injection. We found that increasing the time between IUE and BrdU administration resulted in steadily decreasing proportions of colabeled cells (Fig. 1D). Thus, the further away from S–M-phases the cells are, the less likely they are to become transfected. From these experiments, we conclude that IUE preferentially transfects cells that transit through S- and M-phases of the cell cycle within 8 h of the surgery and that the vanguard of the transfected population is in M-phase at the moment of electroporation.
Figure 1.

Temporal properties of in utero electroporation. BrdU was administered immediately after IUE with pCAG-RFP to label cells in S-phase at the moment of IUE (0 h) (Ai). Using this paradigm, the majority of cells transfected by IUE (RFP+) were colabeled with BrdU (70.87 ± 6.60%) (D). Administering BrdU 2 h before IUE labeled cells throughout S- to M-phase at the moment of IUE (−2 h) (Aii). Nearly the entire RFP+ population also expressed BrdU using this protocol (95.97 ± 4.00%) (B, B′, D). The arrow in B and B′ denotes an RFP+ cell that was not BrdU+. These data demonstrate that IUE preferentially transfects cells that are in S- and M-phases at the time of electroporation. C, C′, Only a small percentage (23.29 ± 4.16%) of cells were colabeled with RFP and BrdU when BrdU was injected 6 h after IUE; the arrows point to the minority of cells that were colabeled. D, The percentage of colabeled BrdU+RFP+ cells decreased as the time between IUE and BrdU administration increased, indicating that plasmid viability is limited. Together, these data indicate that the cohort of electroporated cells is temporally limited to those in S- through M-phase at the moment of IUE, with the leading edge of the transfected population in M-phase, and that the electroporated plasmid is only viable for 6–8 h after IUE. Error bars represent SE.
Subsequent tracking of this temporally limited cell cohort allowed measurements of cell cycle phase durations. We developed an IUE/BrdU protocol in which IUE with the CAG-RFP plasmid was followed by BrdU injections at different intervals to estimate the duration of G1-phase (TG1) as the time necessary for the electroporated cells to reenter S-phase (Fig. 2A). A labeling index was created by quantifying (BrdU+RFP+)/RFP+ cells in a 100 × 100 μm2 area in confocal images (Fig. 2B). Our IUE/M–M-phase protocol estimated the total cell cycle duration (TC) as the time required for the electroporated VZ cell cohort, the leading edge of which is in M-phase at the moment of electroporation, to reenter the next mitosis at the surface of the ventricle (Fig. 2A). A mitotic index was created by counting the number of mitotic (visibly condensed chromatin) RFP+ cells at the ventricular surface, divided by the total number of RFP+ cells (Fig. 2C). Estimates of TG1 and TC acquired using the IUE/BrdU and IUE/M–M-phase protocols with CAG-RFP (12 and 20 h, respectively) were consistent with previous estimates of the general VZ population (11.8 and 17.5–18.4 h, respectively) (Takahashi et al., 1995). Therefore, we conclude that these novel IUE-based methods represent sensitive and robust alternatives to cumulative BrdU labeling for analyses of cell cycle kinetics.
Figure 2.
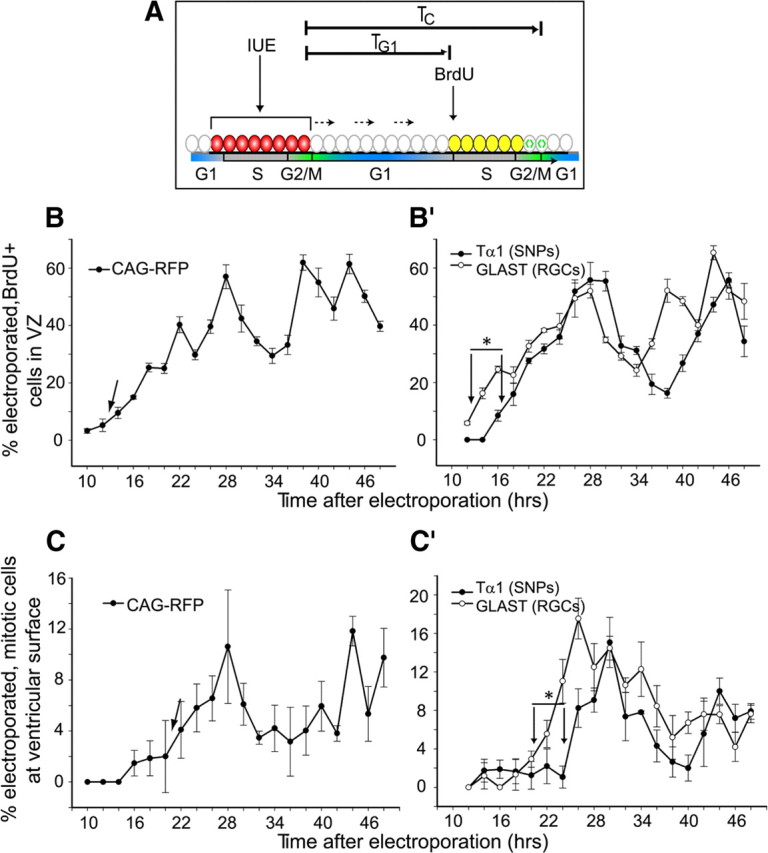
Short neural precursors have distinct cell cycle kinetics. A, Labeling schemes of IUE/BrdU and IUE/M–M-phase methods for estimating TG1 and TC, respectively. TG1 represents the time it takes transfected cells (red) to transit through G1-phase and reenter S-phase, determined by administering BrdU at 2 h intervals after IUE until cells become colabeled with BrdU (yellow). TC represents the cell cycle duration, determined by identifying the time necessary to find mitotic electroporated cells (green) at the ventricular surface. B, For proof of principle, IUE/BrdU method was first performed with CAG-RFP plasmid to label all cells within the VZ; cells reentered S-phase 12–14 h after IUE (arrow). B′, To measure TG1 for individual precursor populations, IUE was performed with pTα1-hGFP or pGLAST-eGFPf; SNPs entered into the next S-phase 4 h later than RGCs (TG1 of 16 vs 12 h, marked with arrows; n ≥ 3 for all time points; ANOVA, *p < 0.0001). C, To determine M-to-M-phase duration, RFP+ cells with condensed chromatin at the ventricular surface were counted after staining with SYTO 24. Transfected RFP+ cells entered into the next M-phase 20–22 h after IUE (arrow). C′, M-phase reentry after IUE for SNPs was delayed by 4 h compared with RGCs (TC of 24–26 vs 20–22 h, marked with arrows; n ≥ 3 for all time points; median regression, *p < 0.009). In all graphs, error bars represent SE.
VZ precursor populations differ in the length of G1-phase
To measure potential differences in cell cycle kinetics between the individual SNP and RGC VZ cell types, we used the IUE/BrdU and IUE/M–M-phase methods with cell type-specific pTα1- and pGLAST-GFP reporter plasmids. Quantification of (BrdU+GFP+)/GFP+ cells for both the Tα1 and GLAST time courses resulted in significantly different labeling curves (Fig. 2B′) (ANOVA, p < 0.0001). Notably, S-phase reentry for SNPs was delayed by 4 h compared with RGCs (16 vs 12 h), indicating that TG1 is 33% longer for SNPs. The IUE/M–M-phase analysis uncovered a statistically significant 4 h delay in M-phase reentry for SNPs compared with RGCs: 24 vs 20 h (Fig. 2C′) (median regression, p < 0.009). Together, these data suggest that the increased cell cycle duration in SNPs is attributable specifically to a lengthened G1-phase. This is the first demonstration of cell cycle differences in the heterogeneous population of mammalian VZ precursor cells. In addition, the biphasic curves for the IUE/BrdU and IUE/M–M-phase studies (Fig. 2B′,C′) demonstrate that some SNPs are retained in the VZ, since they returned to the ventricular surface for at least two successive divisions after beginning to express the exogenous plasmid.
To ensure that potential differences in strength between the GLAST and Tα1 promoters were not biasing the results (i.e., driving transcription and translation of GFP more quickly in one cell type than the other), we examined GFP expression in tissue harvested 10 h after IUE with either pGLAST-eGFPf or pTα1-hGFP (supplemental Fig. 2, available at www.jneurosci.org as supplemental material). Both RGCs (supplemental Fig. 2A, available at www.jneurosci.org as supplemental material) and SNPs (supplemental Fig. 2B, available at www.jneurosci.org as supplemental material) displayed strong, widespread GFP expression. We therefore conclude that there are no temporal differences in promoter expression that could bias the proliferation results. Together, these kinetic experiments confirm that the murine VZ contains multiple types of resident precursors that are distinguished by significant differences in proliferation dynamics.
Neuronal output differs for SNPs and RGCs
We next asked how these differences in SNP and RGC cell cycle kinetics affect the growth of the neocortical wall and the allocation of SNP- and RGC-derived cells to the cortical mantle. Previous studies have shown that VZ cells with longer cell cycles tend toward neurogenic, rather than proliferative, divisions (Calegari et al., 2005). We therefore hypothesized that SNPs would undergo more direct neurogenic divisions than RGCs, quickly producing neurons that migrate away from the VZ. To test this, we used Cre/Lox-based genetic fate mapping to label the progeny of SNPs and RGCs at mid-neurogenesis and analyzed their distribution across the neocortical wall. Coelectroporation of promoter-specific Cre plasmids and floxed stop GFP reporter plasmid was used at E13.5 to label RGCs (GLAST promoter), SNPs (Tα1 promoter), or all NSCs (Nestin promoter) (Fig. 3A). By E17.5, there were noticeable differences in the allocation of labeled (GFP+) progeny of RGCs and SNPs (Fig. 3B). Whereas less than one-third of the total cells produced from each precursor cell type remained in the proliferative areas of the cortical wall (VZ and SVZ) (Fig. 3C), the percentage of RGC progeny in the SVZ was nearly twice that of SNP progeny (18.12 ± 2.66 vs 9.09 ± 3.43%) (Fig. 3C). SNP progeny were primarily localized in the lower one-half of the cortical plate (40.76 ± 7.05% of GFP+ cells) (Fig. 3C), whereas RGC progeny occupied the upper one-half (35.23 ± 2.96% of GFP+ cells) (Fig. 3C). In comparison, Nestin+ NSCs generated cells that were evenly distributed across the depth of the neocortical wall (Fig. 3B,C), as expected for a general precursor population comprised by both SNPs and RGCs.
Figure 3.

Laminar allocation differences in VZ-derived cells at the end of neurogenesis. A, Genetic fate mapping experiments were performed by coelectroporation of cell type-specific Cre plasmids together with a floxed stop GFP reporter plasmid. B, Embryos electroporated at E13.5 were harvested at E17.5 for analysis of the distribution of GFP+ progeny across the thickness of the neocortical wall. C, In collapsed confocal Z-stacks, the thickness of the cortical wall was divided into five bins, yielding regions corresponding to the VZ, SVZ, IZ, and lower and upper CP, and GFP+ cells were counted across a 300 μm width in each region. Most GFP+ progeny of SNPs were found in the lower CP (second box from top on all bars) by the end of neurogenesis, whereas more RGC progeny were found in the upper CP (top box on all bars). pNestin+ NSCs generated progeny with an intermediate distribution between that of RGCs and SNPs. Graph shows percentage of total GFP+ cells (per 300 μm column) in each region. Error bars indicate SE. n = 3 for pNestin and pTα1; n = 4 for pGLAST. Scale bar, 100 μm.
Given the inside-out laminar specification of the mammalian neocortex (Rakic, 1974), these results suggest either that (1) SNP-generated neurons are born earlier than RGC-generated neurons and are thus specified to deeper cortical laminae, or (2) SNP-generated neurons are born later and have not finished migrating by E17.5. To test these possibilities, we conducted a longer-term study, performing the IUE-mediated fate mapping at E14.5 and analyzing the final laminar position of the recombined GFP+ neurons on P10 (Fig. 4). By measuring the depth of GFP+ neuronal soma from a reference line drawn at the top of layer II/III (determined by immunohistochemistry for Brn1), we found that neurons generated from SNPs reside significantly deeper than neurons from RGCs (Fig. 4B–D). The average distance of GFP+ RGC neuronal progeny, which were found in the lower one-half of layer II/III, was 236.00 ± 8.58 μm (Fig. 4D), whereas GFP+ SNP progeny resided >100 μm deeper, primarily in layer IV (average distance, 361.83 ± 21.59 μm) (Fig. 4D). In comparison, neurons generated from pNestin+ NSCs displayed a more diffuse arrangement than the tightly packed bands of RGC or SNP progeny (Fig. 4A–A″), with individual neurons spread throughout the depth of layer II/III (average distance, 163.60 ± 8.76 μm) (Fig. 4D). We also classified all fate-mapped progeny based on morphology to determine whether individual VZ precursor types generate specific neuron subtypes. We found that each of the three precursor populations generated both pyramidal and stellate neurons during this stage of neurogenesis (supplemental Fig. 3, available at www.jneurosci.org as supplemental material) and that most of the GFP-labeled pyramidal neurons sent callosum-projecting axons. These data indicate that RGCs and SNPs labeled at E14.5 produce a similar variety of neuron subtypes but that these neurons are surprisingly specified to different cortical laminae with progeny of SNPs predominantly in layer IV and progeny of RGCs mostly in layer II/III.
Figure 4.
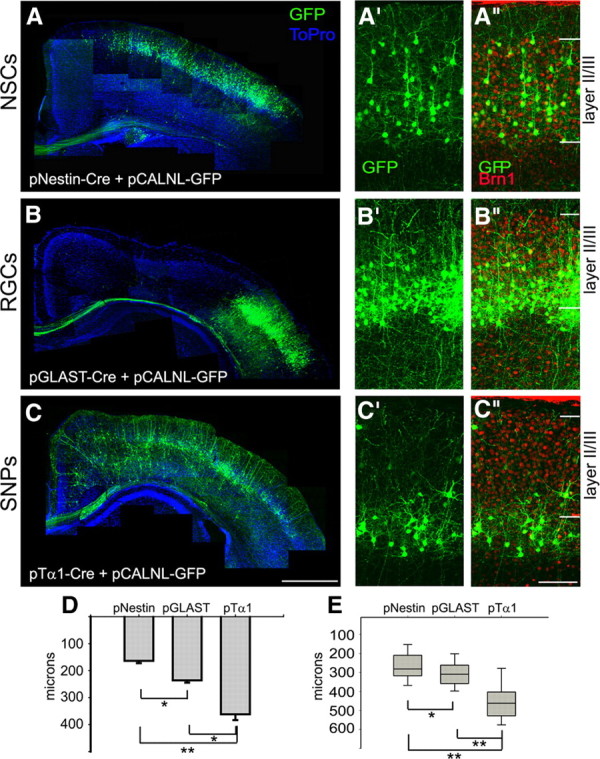
RGCs and SNPs labeled on the same embryonic day generate neuronal progeny specified to different cortical laminae. After IUE with Cre and GFP reporter plasmids at E14.5, brains were harvested at P10. Composite, low-magnification images of GFP+ neuronal progeny and callosal axons are shown for each precursor population in A–C. On examination at higher magnification (A′–C″), variations in cell location became apparent. RGC progeny were grouped tightly in the deep part of layer II/III (labeled with Brn1 staining) (B″). In contrast, SNP progeny formed a thin band deep to layer II/III, in layer IV (C″). D, The average distance (in micrometers) of all GFP+ neuronal soma from the top of layer II/III was significantly greater for cells generated from SNPs (pTα1) compared with neurons produced by RGCs (pGLAST) or NSCs (pNestin). E, GFP+ pyramidal neurons showed similar distribution patterns compared with the entire neuronal populations of NSC (pNestin), RGC (pGLAST), and SNP (pTα1) progeny. Error bars show SE. n = 3 for pNestin and pTα1; n = 2 for pGLAST. *p < 0.01, **p < 0.001, Student's t test. Scale bars: A–C, 900 μm; A′–C″, 100 μm.
Relationship of SNPs and RGCs to intermediate progenitor cells
To uncover the mechanism underlying the different positioning of SNP and RGC progeny, we expanded our focus to include IPCs, reasoning that the time of specification for SNP- and RGC-derived neurons may be different if one subgroup is sequestered within the IPC pool. We performed immunohistochemistry for markers of proliferation (Ki-67) and differentiation (TUJ1), and for the transcription factor Tbr2, which labels IPCs (Englund et al., 2005), on tissue electroporated at E14.5 with pTα1- or pGLAST-GFP and killed 24 h later. We found that 60% more pGLAST+ RGCs coexpressed Tbr2 compared with pTα1+ SNPs (Fig. 5A,A′,D, Table 1). Conversely, two-thirds more SNPs expressed the neuronal marker TUJ1 compared with RGCs (Fig. 5B,B′,D, Table 1). Differences in proliferation (GFP+/Ki67+ cells) between RGCs and SNPs were also apparent, but not significant (Fig. 5D, Table 1). Together with the results from the fate-mapping experiments, these data support the hypothesis that SNPs in the VZ serve a direct neurogenic role, whereas RGCs primarily generate neurons indirectly, via IPCs.
Figure 5.
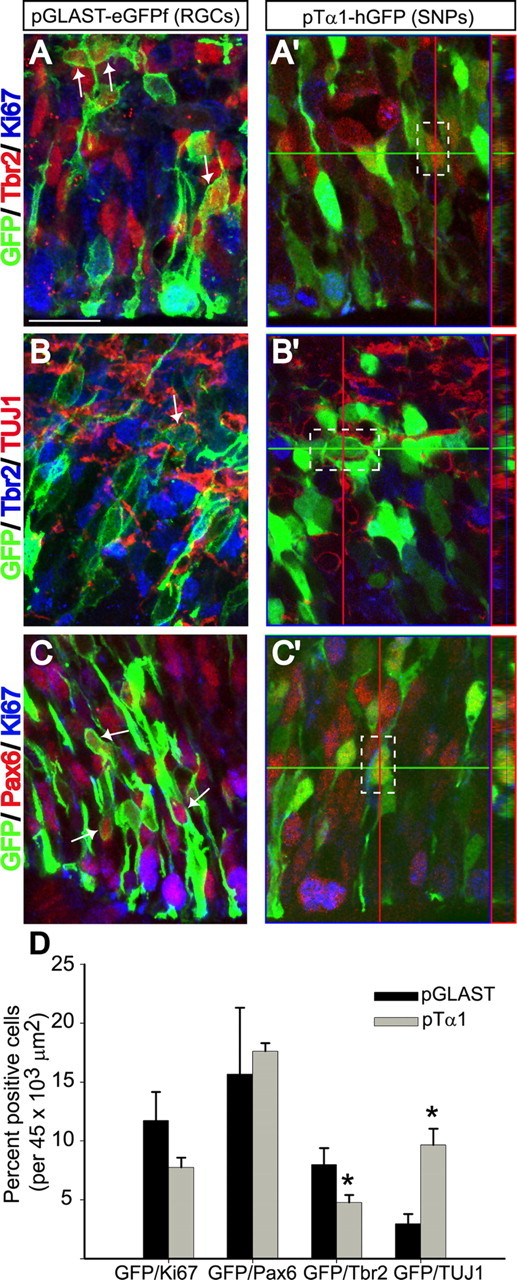
RGC progeny are amplified by proliferative IPCs whereas SNPs generate neurons directly from the VZ. Immunostaining for Tbr2, Ki67, TUJ1 (βIII-tubulin), and Pax6 was performed on tissue electroporated at E14.5 with pTα1-hGFP or pGLAST-eGFPf and fixed 24 h later (A–C′). The arrows in A–C point to GFP+ RGCs double positive for Tbr2, TUJ1, or Pax6, respectively. Orthogonal views of single Z-sections in A′–C′ show double labeling of GFP+ SNPs (outlined in white boxes). D, Nearly twice as many RGCs coexpressed Tbr2 compared with SNPs. Threefold more SNPs coexpressed TUJ1 compared with RGCs. Differences between RGCs and SNPs in coexpression of Ki67 or Pax6 were not statistically significant. Error bars represent SE. n = 4 per group. *p < 0.01, Student's t test. Scale bar, 20 μm.
Table 1.
Summary of colabeling of GFP+ SNPs and RGCs with Ki67, Pax6, Tbr2, and TUJ1
| Percentage of GFP+ cells colabeled with |
||||
|---|---|---|---|---|
| Ki67 | Pax6 | Tbr2 | TUJ1 | |
| RGCs | 11.73 ± 2.41 | 15.66 ± 5.64 | 7.98 ± 1.40 | 2.96 ± 0.84 |
| SNPs | 7.75 ± 0.83 | 17.60 ± 0.69 | 4.78 ± 0.63 | 9.65 ± 1.39 |
Immunostaining was performed on tissue harvested 24 h after electroporation at E14.5 with either pTα1-hGFP or pGLAST-eGFPf. Cell counts were performed on 40× collapsed Z-stacks, across the entire width of the image (225 μm) and up to 200 μm from the ventricular surface. Values represent the percentage of GFP+ cells coexpressing each protein or transcription factor ± SEM; n = 4 per group.
Finally, we examined expression of the transcription factor Pax6, which labels VZ precursors (Götz et al., 1998) and is rarely coexpressed in Tbr2+ cells (Englund et al., 2005). Previous studies identified Tbr2+ cells dividing at the ventricular surface that are morphologically similar to SNPs (Noctor et al., 2008; Kowalczyk et al., 2009), implying that SNPs may be a misclassified population of IPCs. In tissue electroporated with pTα1- or pGLAST-GFP and stained for Pax6, we found that both pTα1+ SNPs and pGLAST+ RGCs were robustly labeled with Pax6 (Fig. 5C,D), supporting our proliferation study, which indicates that SNPs are a resident VZ population (Fig. 2). In addition, in our immunostainings for Tbr2, we did not observe even a single pTα1+/Tbr2+ cell (n = 1707 pTα1+ cells; n = 75 pTα1/Tbr2+ cells) dividing at the ventricle; most pTα1+/Tbr2+ cells were in the basal VZ or SVZ. Thus, we conclude that SNPs and IPCs are distinct precursor cell types.
Discussion
In this study, we used molecular labeling techniques and novel IUE-based methods to uncover diversity in the proliferative properties and lineage potentials of separate VZ precursor populations. We present three main findings that fundamentally increase our knowledge of the rodent neocortical VZ. First, in contrast to the long-standing view that all VZ cells exhibit similar proliferation parameters (Takahashi et al., 1995; Cai et al., 1997), we demonstrate that two populations dividing concurrently at the ventricular surface have significantly different cell cycle kinetics. Second, we find that neurons fate mapped from these two populations migrate to different cortical laminae. Specifically, SNPs and RGCs fate mapped on E14.5 generate neurons that predominantly settle in layer IV and layer II/III, respectively. Finally, we show that this differential laminar allocation is attributable, at least in part, to an increased reliance of RGCs on intermediate progenitor cells for neuronal production compared with SNPs. From the significant and persistent differences in laminar positioning, we conclude that SNPs and RGCs in the murine VZ represent mutually exclusive populations from E14.5 onward and generate phenotypically different neuronal progeny via separate mechanisms.
Our data indicate that SNPs labeled at E14.5 transit through one or two cell cycles at the ventricular surface, directly producing TUJ1+ neuron(s) with each division that migrate away to the cortical plate (Figs. 2B′,C′, 5). Compared with SNPs, RGCs labeled at E14.5 display greater perdurance in the VZ, undergoing multiple rounds of asymmetric divisions to generate a proliferative daughter cell and a Tbr2+ IPC with each mitosis (Noctor et al., 2004). We found that progeny of the labeled RGCs sojourn in the SVZ as IPCs before migrating to the cortical plate, thus arriving later than—and laminating superficially to—neuronal daughters of SNPs (Fig. 6). Although our data do indicate that some SNPs use IPCs for neuronal amplification, just as some RGCs are capable of generating neurons directly (Miyata et al., 2001; Noctor et al., 2001), the results suggest that direct and indirect neuronal production are the primary mechanisms used by SNPs and RGCs, respectively. Not surprisingly, these different modes of neuron generation influence the resulting size of the neuronal progeny: there were considerably more GFP+ RGC-derived neurons than SNP-derived neurons in the brains we examined (Fig. 4B–C″) (average number GFP+ cells per volume analyzed: pGLAST, 135.25 ± 20.61; pTα1, 45.5 ± 8.94). Thus, SNPs augment neuronal output from the RGC population and thereby enhance the overall neuronal production capacity of the VZ. It is therefore tempting to speculate that the SNP pool may have evolved to boost neuronal production in a discrete, region-specific manner. We previously found that SNPs are present in substantial numbers within the murine VZ between E13.5 and E16.5 (Gal et al., 2006), the birth period of neurons destined to the mid to superficial layers of the neocortex. Our current fate-mapping results indicate that the SNP pool provides focused and temporally limited neurogenesis during this period, most likely generating multiple and successive cohorts of neurons to each developing cortical layer. Whether SNPs play a significant role in neurogenesis before this period (E13.5–E16.5) is currently unknown, but it is possible that SNP prevalence may differ across developmental ages and cortical regions and thereby help to finely tune laminar growth across the neocortical mantle.
Figure 6.

Differential neuronal production from VZ precursor subtypes. The experiments in this study were conducted at mid-neurogenesis (E13.5–E14.5), the stage during which stellate and pyramidal neurons begin to be generated from precursors in the VZ and SVZ. Our data demonstrate that pGLAST+ RGCs and pTα1+ SNPs exhibit markedly different cell cycle kinetics and that SNPs persist in the VZ for at least two cell divisions (Fig. 2). The Cre/lox fate-mapping studies show that SNPs and RGCs present in the VZ at the same time produce different types of neurons, as defined by their laminar position (Fig. 4). Because of the inside-out nature of cortical layer formation, layer IV neurons are born before neurons residing in layer II/III. Furthermore, these experiments demonstrate that RGCs divide in the VZ to directly generate a small number of layer IV neurons and that they also indirectly generate layer II/III neurons via IPC divisions in the SVZ. These IPC divisions take additional time; thus, progeny of the RGC antecedents are spread radially over a large laminar area. In contrast, SNPs within the E14.5 VZ do not generate appreciable numbers of INPs but rather generate neuronal progeny directly from the VZ, which are allocated more quickly and specifically to layer IV. Thus, RGCs contribute more substantially to laminar expansion by producing neurons for multiple layers over a longer period of time, whereas SNPs generate discrete neuronal populations over a short time window.
The results presented here complement and extend work demonstrating a link between the cell cycle of VZ precursors and the laminar position of their neuronal progeny (McConnell and Kaznowski, 1991; Pilaz et al., 2009). McConnell's seminal heterochronic transplantation study established that laminar fate is determined before the terminal division of neuronal precursors (McConnell and Kaznowski, 1991). Our fate-mapping data expand on this important study, showing that the time and location of terminal division of simultaneously labeled precursors vary among individual precursor groups. Since the terminal division of a VZ precursor's lineage can either occur at the ventricular surface (as in the case of most SNPs) or in the SVZ (as in the case of most RGC descendant cells), laminar specification is therefore critically dependent on the site of terminal division on a cell-by-cell basis. Recently, the Dehay Laboratory found that forced overexpression of cyclin D1 or E1 in E15 mouse VZ precursors can shorten TG1 and result in an accumulation of neurons in cortical layer II/III and the upper one-half of layer IV at P15. This differed significantly from the neuronal progeny of control precursors, which primarily resided deeper, in layer IV (Pilaz et al., 2009). Here, we demonstrate that the native embryonic mouse VZ contains a heterogeneous pool of endogenous neural precursors that differ both in cell cycle kinetics and whether they undergo secondary proliferation as IPCs. These differences naturally predispose SNPs and RGCs to settle in different laminae.
Although numerous studies have identified variations in morphology and antigen and gene expression within the RGC population (Malatesta et al., 2000, 2003; Hartfuss et al., 2001, 2003; Pinto et al., 2008), our results add to a growing body of evidence suggesting that multiple neural precursor cell types contribute to heterogeneity in the rodent VZ. For example, it has been shown that VZ precursors differentially use the Notch signaling pathway (Kawaguchi et al., 2008). In particular, Notch pathway activation is present in pGLAST+ RGCs but is mostly absent in pTα1+ SNPs (Mizutani et al., 2007). As Notch activity is known to promote proliferation and inhibit differentiation in both invertebrate and vertebrate systems (Gaiano and Fishell, 2002), this finding suggested that pGLAST+ RGCs may remain proliferative, whereas pTα1+ SNPs differentiate more quickly. Indeed, the authors demonstrated in vitro that pTα1-EGFP+ cells generated fewer and smaller neurospheres than cells with active Notch signaling (Mizutani et al., 2007). Here, we present in vivo confirmation of this hypothesis and identify a functional consequence of these differences in gene expression: namely, SNPs generate neurons on an accelerated timescale but in more limited numbers compared with RGCs.
Diversity of the neural precursor pool is likely a critical component of cortical morphogenesis and function. For example, the mature human brain contains up to 100 billion neurons, approximately one-fifth of which are found in the neocortex (Pakkenberg and Gundersen, 1997). The majority of these are excitatory projection neurons, which are further grouped into subtypes based on their morphology, location, connectivity, and function. Evidence from previous studies strongly indicates that these major aspects of neuronal fate are specified in the germinal zone (Rakic, 1988; Miyashita-Lin et al., 1999; Sansom et al., 2005); thus, the full extent of neocortical diversity is thought to require a similarly heterogeneous neuronal precursor population. Data supporting this premise are found in several studies that demonstrate multiple precursor populations coexisting in the human and nonhuman primate dorsal telencephalic VZ that differ in morphology, antigen expression, and regional and temporal prevalence over the course of corticogenesis (Levitt et al., 1981, 1983; Zecevic, 2004; Howard et al., 2006; Mo et al., 2007). Although the number of cortical neurons in rodents is orders of magnitude smaller than in humans (an estimated 4 million in mice) (Roth and Dicke, 2005), their degree of phenotypic diversity is comparable. Here, we provide direct in vivo kinetic evidence of two different proliferative populations intermingled within the murine VZ, demonstrating a fundamental level of similarity between the rodent and primate embryonic neuronal precursor pools. VZ precursor diversity is therefore likely a common mammalian trait necessary to generate the full complement of mature neuronal phenotypes in the neocortex.
Footnotes
This work was supported by National Institutes of Health (NIH) Grant NS051852 (T.F.H.) and the Cellular Imaging and Statistical Cores of the Intellectual and Developmental Disabilities Research Center at Children's National Medical Center (CNMC) (NIH Grant P30HD40677). We thank J. Corbin and V. Gallo of CNMC for critical reading of this manuscript and members of the Haydar and Corbin Laboratories for technical help. E.K.S. is a predoctoral student in the Molecular Medicine program of the Institute for Biomedical Sciences at George Washington University. This work is from dissertation research to be presented to the program in partial fulfillment of the requirements for the PhD degree.
References
- Anthony TE, Klein C, Fishell G, Heintz N. Radial glia serve as neuronal progenitors in all regions of the central nervous system. Neuron. 2004;41:881–890. doi: 10.1016/s0896-6273(04)00140-0. [DOI] [PubMed] [Google Scholar]
- Cai L, Hayes NL, Nowakowski RS. Local homogeneity of cell cycle length in developing mouse cortex. J Neurosci. 1997;17:2079–2087. doi: 10.1523/JNEUROSCI.17-06-02079.1997. [DOI] [PMC free article] [PubMed] [Google Scholar]
- Calegari F, Haubensak W, Haffner C, Huttner WB. Selective lengthening of the cell cycle in the neurogenic subpopulation of neural progenitor cells during mouse brain development. J Neurosci. 2005;25:6533–6538. doi: 10.1523/JNEUROSCI.0778-05.2005. [DOI] [PMC free article] [PubMed] [Google Scholar]
- Englund C, Fink A, Lau C, Pham D, Daza RA, Bulfone A, Kowalczyk T, Hevner RF. Pax6, Tbr2, and Tbr1 are expressed sequentially by radial glia, intermediate progenitor cells, and postmitotic neurons in developing neocortex. J Neurosci. 2005;25:247–251. doi: 10.1523/JNEUROSCI.2899-04.2005. [DOI] [PMC free article] [PubMed] [Google Scholar]
- Gaiano N, Fishell G. The role of notch in promoting glial and neural stem cell fates. Annu Rev Neurosci. 2002;25:471–490. doi: 10.1146/annurev.neuro.25.030702.130823. [DOI] [PubMed] [Google Scholar]
- Gal JS, Morozov YM, Ayoub AE, Chatterjee M, Rakic P, Haydar TF. Molecular and morphological heterogeneity of neural precursors in the mouse neocortical proliferative zones. J Neurosci. 2006;26:1045–1056. doi: 10.1523/JNEUROSCI.4499-05.2006. [DOI] [PMC free article] [PubMed] [Google Scholar]
- Götz M, Stoykova A, Gruss P. Pax6 controls radial glia differentiation in the cerebral cortex. Neuron. 1998;21:1031–1044. doi: 10.1016/s0896-6273(00)80621-2. [DOI] [PubMed] [Google Scholar]
- Hartfuss E, Galli R, Heins N, Götz M. Characterization of CNS precursor subtypes and radial glia. Dev Biol. 2001;229:15–30. doi: 10.1006/dbio.2000.9962. [DOI] [PubMed] [Google Scholar]
- Hartfuss E, Förster E, Bock HH, Hack MA, Leprince P, Luque JM, Herz J, Frotscher M, Götz M. Reelin signaling directly affects radial glia morphology and biochemical maturation. Development. 2003;130:4597–4609. doi: 10.1242/dev.00654. [DOI] [PubMed] [Google Scholar]
- Haubensak W, Attardo A, Denk W, Huttner WB. Neurons arise in the basal neuroepithelium of the early mammalian telencephalon: a major site of neurogenesis. Proc Natl Acad Sci U S A. 2004;101:3196–3201. doi: 10.1073/pnas.0308600100. [DOI] [PMC free article] [PubMed] [Google Scholar]
- Howard B, Chen Y, Zecevic N. Cortical progenitor cells in the developing human telencephalon. Glia. 2006;53:57–66. doi: 10.1002/glia.20259. [DOI] [PubMed] [Google Scholar]
- Kawaguchi A, Ikawa T, Kasukawa T, Ueda HR, Kurimoto K, Saitou M, Matsuzaki F. Single-cell gene profiling defines differential progenitor subclasses in mammalian neurogenesis. Development. 2008;135:3113–3124. doi: 10.1242/dev.022616. [DOI] [PubMed] [Google Scholar]
- Kowalczyk T, Pontious A, Englund C, Daza RA, Bedogni F, Hodge R, Attardo A, Bell C, Huttner WB, Hevner RF. Intermediate neuronal progenitors (basal progenitors) produce pyramidal-projection neurons for all layers of cerebral cortex. Cereb Cortex. 2009;19:12. doi: 10.1093/cercor/bhn260. [DOI] [PMC free article] [PubMed] [Google Scholar]
- Levitt P, Cooper ML, Rakic P. Coexistence of neuronal and glial precursor cells in the cerebral ventricular zone of the fetal monkey: an ultrastructural immunoperoxidase analysis. J Neurosci. 1981;1:27–39. doi: 10.1523/JNEUROSCI.01-01-00027.1981. [DOI] [PMC free article] [PubMed] [Google Scholar]
- Levitt P, Cooper ML, Rakic P. Early divergence and changing proportions of neuronal and glial precursor cells in the primate cerebral ventricular zone. Dev Biol. 1983;96:472–484. doi: 10.1016/0012-1606(83)90184-7. [DOI] [PubMed] [Google Scholar]
- Malatesta P, Hartfuss E, Götz M. Isolation of radial glial cells by fluorescent-activated cell sorting reveals a neuronal lineage. Development. 2000;127:5253–5263. doi: 10.1242/dev.127.24.5253. [DOI] [PubMed] [Google Scholar]
- Malatesta P, Hack MA, Hartfuss E, Kettenmann H, Klinkert W, Kirchhoff F, Götz M. Neuronal or glial progeny: regional differences in radial glia fate. Neuron. 2003;37:751–764. doi: 10.1016/s0896-6273(03)00116-8. [DOI] [PubMed] [Google Scholar]
- McConnell SK, Kaznowski CE. Cell cycle dependence of laminar determination in developing neocortex. Science. 1991;254:282–285. doi: 10.1126/science.254.5029.282. [DOI] [PubMed] [Google Scholar]
- Miyashita-Lin EM, Hevner R, Wassarman KM, Martinez S, Rubenstein JL. Early neocortical regionalization in the absence of thalamic innervation. Science. 1999;285:906–909. doi: 10.1126/science.285.5429.906. [DOI] [PubMed] [Google Scholar]
- Miyata T, Kawaguchi A, Okano H, Ogawa M. Asymmetric inheritance of radial glial fibers by cortical neurons. Neuron. 2001;31:727–741. doi: 10.1016/s0896-6273(01)00420-2. [DOI] [PubMed] [Google Scholar]
- Miyata T, Kawaguchi A, Saito K, Kawano M, Muto T, Ogawa M. Asymmetric production of surface-dividing and non-surface-dividing cortical progenitor cells. Development. 2004;131:3133–3145. doi: 10.1242/dev.01173. [DOI] [PubMed] [Google Scholar]
- Mizutani K, Yoon K, Dang L, Tokunaga A, Gaiano N. Differential Notch signalling distinguishes neural stem cells from intermediate progenitors. Nature. 2007;449:351–355. doi: 10.1038/nature06090. [DOI] [PubMed] [Google Scholar]
- Mo Z, Moore AR, Filipovic R, Ogawa Y, Kazuhiro I, Antic SD, Zecevic N. Human cortical neurons originate from radial glia and neuron-restricted progenitors. J Neurosci. 2007;27:4132–4145. doi: 10.1523/JNEUROSCI.0111-07.2007. [DOI] [PMC free article] [PubMed] [Google Scholar]
- Noctor SC, Flint AC, Weissman TA, Dammerman RS, Kriegstein AR. Neurons derived from radial glial cells establish radial units in neocortex. Nature. 2001;409:714–720. doi: 10.1038/35055553. [DOI] [PubMed] [Google Scholar]
- Noctor SC, Flint AC, Weissman TA, Wong WS, Clinton BK, Kriegstein AR. Dividing precursor cells of the embryonic cortical ventricular zone have morphological and molecular characteristics of radial glia. J Neurosci. 2002;22:3161–3173. doi: 10.1523/JNEUROSCI.22-08-03161.2002. [DOI] [PMC free article] [PubMed] [Google Scholar]
- Noctor SC, Martínez-Cerdeño V, Ivic L, Kriegstein AR. Cortical neurons arise in symmetric and asymmetric division zones and migrate through specific phases. Nat Neurosci. 2004;7:136–144. doi: 10.1038/nn1172. [DOI] [PubMed] [Google Scholar]
- Noctor SC, Martínez-Cerdeño V, Kriegstein AR. Distinct behaviors of neural stem and progenitor cells underlie cortical neurogenesis. J Comp Neurol. 2008;508:28–44. doi: 10.1002/cne.21669. [DOI] [PMC free article] [PubMed] [Google Scholar]
- Nowakowski RS, Lewin SB, Miller MW. Bromodeoxyuridine immunohistochemical determination of the lengths of the cell cycle and the DNA-synthetic phase for an anatomically defined population. J Neurocytol. 1989;18:311–318. doi: 10.1007/BF01190834. [DOI] [PubMed] [Google Scholar]
- Pakkenberg B, Gundersen HJ. Neocortical neuron number in humans: effect of sex and age. J Comp Neurol. 1997;384:312–320. [PubMed] [Google Scholar]
- Pilaz LJ, Patti D, Marcy G, Ollier E, Pfister S, Douglas RJ, Betizeau M, Gautier E, Cortay V, Doerflinger N, Kennedy H, Dehay C. Forced G1-phase reduction alters mode of division, neuron number, and laminar phenotype in the cerebral cortex. Proc Natl Acad Sci U S A. 2009;106:21924–21929. doi: 10.1073/pnas.0909894106. [DOI] [PMC free article] [PubMed] [Google Scholar]
- Pinto L, Mader MT, Irmler M, Gentilini M, Santoni F, Drechsel D, Blum R, Stahl R, Bulfone A, Malatesta P, Beckers J, Götz M. Prospective isolation of functionally distinct radial glial subtypes—lineage and transcriptome analysis. Mol Cell Neurosci. 2008;38:15–42. doi: 10.1016/j.mcn.2008.01.012. [DOI] [PubMed] [Google Scholar]
- Rakic P. Neurons in rhesus monkey visual cortex: systematic relation between time of origin and eventual disposition. Science. 1974;183:425–427. doi: 10.1126/science.183.4123.425. [DOI] [PubMed] [Google Scholar]
- Rakic P. Specification of cerebral cortical areas. Science. 1988;241:170–176. doi: 10.1126/science.3291116. [DOI] [PubMed] [Google Scholar]
- Roth G, Dicke U. Evolution of the brain and intelligence. Trends Cogn Sci. 2005;9:250–257. doi: 10.1016/j.tics.2005.03.005. [DOI] [PubMed] [Google Scholar]
- Sansom SN, Hébert JM, Thammongkol U, Smith J, Nisbet G, Surani MA, McConnell SK, Livesey FJ. Genomic characterisation of a Fgf-regulated gradient-based neocortical protomap. Development. 2005;132:3947–3961. doi: 10.1242/dev.01968. [DOI] [PMC free article] [PubMed] [Google Scholar]
- Takahashi T, Nowakowski RS, Caviness VS., Jr The cell cycle of the pseudostratified ventricular epithelium of the embryonic murine cerebral wall. J Neurosci. 1995;15:6046–6057. doi: 10.1523/JNEUROSCI.15-09-06046.1995. [DOI] [PMC free article] [PubMed] [Google Scholar]
- Zecevic N. Specific characteristic of radial glia in the human fetal telencephalon. Glia. 2004;48:27–35. doi: 10.1002/glia.20044. [DOI] [PubMed] [Google Scholar]