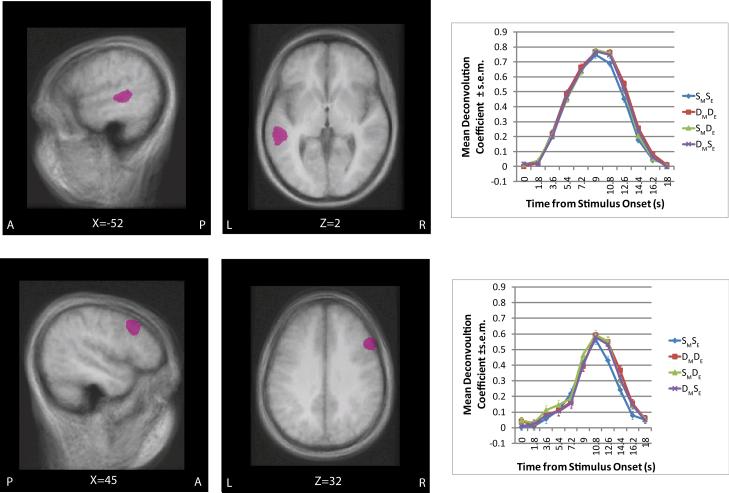
Figure 4.
Presents the clusters of adaptation in the left superior temporal gyrus (STG; upper panel) and Right Inferior Precentral Sulcus (iPS; lower panel) overlaid on a group average MRI. The clusters are presented in sagital and axial planes along with its deconvolution plot. The cluster is thresholded at p<.05 voxel-wise and p<.05 map corrected for multiple-comparisons.

