Abstract
The drive to increase the availability of paediatric pharmacokinetic data with minimum blood loss has led to the development of micro-sampling techniques. However studies have suggested that pharmacokinetic data from venous or capillary blood samples may not be directly comparable.
AIM
The aim of this study was to determine whether paracetamol demonstrates concentration differences between finger-prick and venous blood samples.
METHODS
Paired finger-prick and venous blood samples were taken at 0, 15, 30 and 60 min following 1 g oral paracetamol, from 12 male adult subjects. Paracetamol concentration was determined using HPLC and UV detection with a LLOQ of 2200 pg on column. Intra-assay coefficient of variation for paracetamol at the LLOQ was 3%.
RESULTS
At 15, 30, and 60 min post dose the median finger-prick paracetamol concentration was 349%, 72%, and 9.3% greater than the equivalent venous concentrations, respectively. Regression analysis confirmed a significant relationship between finger-prick and venous paracetamol concentrations at 15 min (r2 = 0.81, P = 0.006), at 30 min (r2 = 0.82, P < 0.0001) and at 60 min (r2 = 0.87, P < 0.0001) post dose. The regression equation for venous and finger-prick blood concentrations at 15, 30 and 60 min post dose were Venous15 = Finger15 − 3.4, Venous30 = Finger30 − 3.4 and Venous60 = 0.68Finger60 + 3.06, respectively.
CONCLUSIONS
Paracetamol demonstrates an arteriovenous difference in concentration, and the use of finger-prick samples may give rise to results which differ from those obtained with traditional venous sampling especially during the first 1 h following drug ingestion.
Keywords: arterio-venous concentration difference, dried blood spot, finger-prick, micro-sampling, paracetamol, pharmacokinetics
WHAT IS ALREADY KNOWN ABOUT THE SUBJECT
Finger-prick blood samples are increasingly used for the clinical and biomedical measurement of drugs and endogenous substance concentration.
The use of different sampling sites can give rise to different drug concentration measurements.
WHAT THIS STUDY ADDS
During the absorption phase, the paracetamol concentration in finger-prick blood samples is significantly greater than that in venous blood samples, following oral administration.
Finger-prick and venous blood samples will result in equivalent pharmacokinetic parameters of oral paracetamol only after distribution equilibrium is attained.
Introduction
With the recent requirement that all new medicines should be trialled in children there has been an increasing move towards the use of micro-sampling techniques such as finger-prick blood sampling [1, 2]. Such moves assume that finger-prick and venous samples yield the same results, and that finger-prick micro-samples may be used for the accurate quantification of drug concentrations and determination of pharmacokinetic parameters.
Finger-prick sampling relies on the collection of whole blood from the finger as a spot on a filter paper, which is then dried and stored. This approach has clear advantages over venous sampling, including the possibility of multiple blood samples permitting traditional pharmacokinetic studies especially in the paediatric population, minimum invasiveness, ease of storage and transport, accepted precision, accuracy and reproducibility [3]. Similar micro-sampling techniques have also been used for the estimation of tacrolimus, cyclosporin, retinol, theophylline, phenytoin, aminoglycoside antibiotics and metformin blood concentrations [2, 4–8]. However these studies were not designed to compare possible differences in drug concentrations as a result of sampling site. While a good correlation between finger-prick and venous blood samples has been reported for tacrolimus, phenytoin and aminoglycoside antibiotics [2, 5–7], these studies either failed to take into account sampling time or to report actual drug concentration differences. Sampling site differences in drug concentration, however, have been reported for theophylline, lignocaine, diazepam, glyceryl trinitrate and artemesinin [2, 9, 10].
The aims of this study were to determine whether the sampling site affects paracetamol blood concentration measurement and pharmacokinetics following oral paracetamol administration to adults, as part of a validation process following the development of a micro-sampling assay to determine blood paracetamol concentrations in children.
Methods
Subjects
Twelve healthy male adult volunteers aged 35–60 years old, who had given prior written informed consent were recruited for the study. The study protocol was approved by the North of Scotland Research Ethics Committee, Aberdeen.
Following an overnight fast each volunteer was asked to ingest 1 g of paracetamol with 100 ml of water. Paired finger-prick (fingers lanced with Unistik, Owen Mumford Ltd, England) and venous blood samples were then collected from each study participant 5 min pre- and 15, 30 and 60 min post paracetamol ingestion. Finger-prick blood samples were spotted in duplicate directly onto a Guthrie card and allowed to dry at room temperature in the dark for 12 h. Venous blood (2 ml) was collected from a peripheral vein into a heparinized tube (Lithium Heparin, Teklab Ltd, UK) and a 30 µl sample then spotted in duplicate on a Guthrie card (Whatman 903, Whatman Gmbh, Germany) and allowed to dry as before.
Paracetamol extraction
Formate buffer (20 mm, pH 3.5) and 200 ng of 2-acetamidophenol (internal standard) were added and vortex mixed (Stuart Auto Vortex Mixer SA2, Rhys International Ltd, Greater Manchester, UK) for 2 min. Protein was then precipitated by the addition of 24.6 µl of 30% perchloric acid followed by centrifugation at 13 000 g for 5 min. The supernatant was then stored at 4°C for later use.
Paracetamol assay
All reagents were purchased from Fisher Scientific, UK. Paracetamol whole blood concentration was quantified using a high performance liquid chromatographic assay, with ultraviolet detection (HPLC-UV) based on the method described by Oliveira et al. and validated according to the International Conference on Harmonization's guidelines for validating analytical methods [11, 12]. In brief, following paracetamol extraction, 20 µl of the supernatant prepared above was introduced onto a Hichrom 3.5 µ C18 (100 × 4.6 mm) column (Hichrom Ltd. Reading, UK) maintained at 25 °C using a Gilson 231 sample injector (Anachem Ltd. Luton, UK). An isocratic mobile phase (methanol : 0.1% triethylamine buffer (pH 3.5), 20:80) was used at a flow rate of 0.8 ml min−1 (Gilson pumps, Anachem Ltd. Luton, UK). The wavelength of detection was fixed at 244 nm on a Waters 486 Tunable Absorbance Detector (Waters Ltd. Elstree, UK) to quantify the analytes. The lower limit of detection (LLOD) and lower limit of quantification (LLOQ) for the method were 900 pg and 2200 pg on column, equivalent to 1 µg ml−1 and 2.5 µg ml−1 of whole blood, respectively.
The intra-assay coefficients of variation at the LLOD and LLOQ were 15% and 3%, respectively. The validation range for the assay was 0.1 µg ml−1–100 µg ml−1. Accuracy expressed as the relative error was always less than 15% at 3 µg ml−1 and 30 µg ml−1 (11%, 7%). A CV of 10.3% determined at 3 µg ml−1 was taken as the precision.
Statistical evaluation
The blood concentration of paracetamol was calculated from the peak area ratio of paracetamol to internal standard, regressed on a set of known standard paracetamol concentrations.
The difference between finger and venous concentrations of paracetamol was analyzed using the Wilcoxon signed-rank test. The level of significance for a statistical difference was set at 0.05. Median and interquartile ranges were determined for the difference in whole blood paracetamol concentrations between finger-prick and venous whole blood samples. Bivariate linear regression analysis was performed to determine the association between finger-prick and venous sample concentration.
Results
Matched venous and finger-prick samples were obtained from 12 male subjects at four time points (−5, 15, 30, 60 min) post oral dosing.
Paracetamol concentrations obtained from finger-prick blood samples were significantly greater than those obtained from venous samples at 15 min (P = 0.043), 30 min (P = 0.006) and 60 min (P = 0.014) post dose. At 15, 30, and 60 min post dose the median finger-prick paracetamol concentrations were 349%, 72%, and 9.3% greater than the equivalent venous concentrations, respectively (Table 1).
Table 1.
Whole blood median (IQR) paracetamol concentration measured from finger-prick and venous blood samples. Samples were obtained after 1 g of oral paracetamol
| Paracetamol concentration Median (IQR) (µg ml−1) | ||
|---|---|---|
| Time after dose (min) | Finger-prick | Venous |
| 15 | 22.9 (0–37.1) | 5.1 (0–25.3) |
| 30 | 16.7 (0.6–27.3) | 9.7 (0–28.2) |
| 60 | 12.9 (1.6–25.5) | 11.8 (0.6–19.8) |
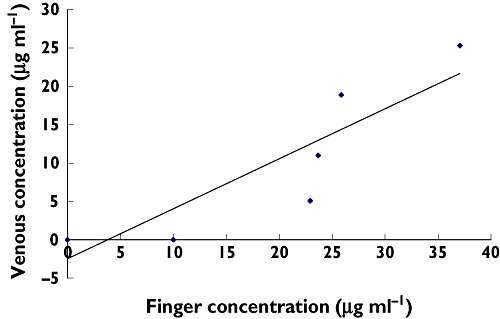
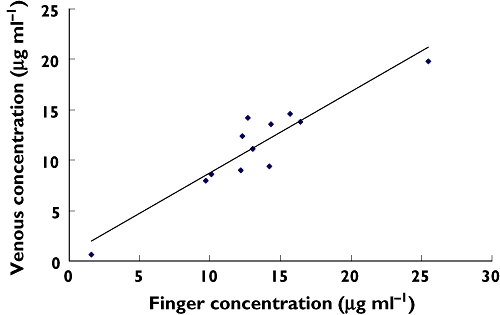
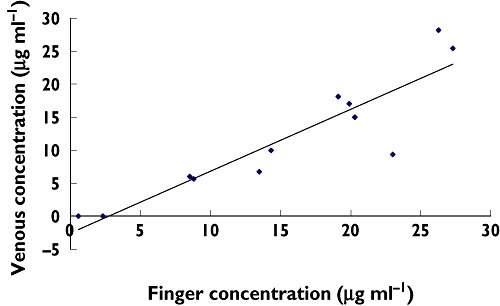
To establish the relationship between finger-prick and venous sample paracetamol concentrations, linear regression analysis was performed. The analysis showed a highly significant relationship between finger-prick and venous paracetamol concentrations at 15 min (r2 = 0.81, P = 0.006), at 30 min (r2 = 0.82, P < 0.0001) and at 60 min (r2 = 0.87, P < 0.0001) post dose. The resultant regression lines are shown in Figures 1–3, and the regression equations are reported in Table 2.
Figure 1.

Linear regression of venous and finger-prick paracetamol concentration at 15 min post dose (r2 = 0.81). n = 6
Figure 3.

Linear regression of venous and finger concentrations at 60 min (r2 value = 0.87). n = 12
Table 2.
Linear model for venous and capillary paracetamol concentration
| Sampling time (min) | Regression equation | r2 |
|---|---|---|
| 15 | V15 = 0.7F15 − 2.5 | 0.81 |
| 30 | V30 = 0.9F30 − 2.5 | 0.82 |
| 60 | V60 = 0.8F60 + 0.6 | 0.87 |
V15 venous concentration measured at 15 min. F15 finger concentration measured at 15 min. V30 venous concentration measured at 30 min. V60 venous concentration measured at 60 min. F30 finger concentration measured at 30 min. F60 finger concentration measured at 60 min.
Figure 2.

Linear regression of venous and finger-prick concentration at 30 min (r2 = 0.82). n = 12
Discussion
This is the first study to report an arteriovenous concentration difference for paracetamol distribution kinetics in humans, with finger-prick blood samples giving a significantly greater paracetamol concentration than venous samples during the first hour post dose.
The development of micro-sampling techniques using capillary blood relies on the assumption that the drug to be assayed achieves rapid equilibrium throughout the blood and body fluids [13], and there are reports of a close correlation between finger-prick and venous sample concentrations to support this view [1, 2]. However while the studies by Pettersen et al. [1] and Webb et al. [2] reported a significant correlation between finger-prick and venous samples concentrations for cyclosporin and tacrolimus, neither study assessed the effects of sampling time. Furthermore Webb et al. reported that finger prick drug concentrations were consistently higher than those obtained from venous samples [2]. There are also a number of reports suggesting that sampling site may affect the measured drug concentration, and a significant difference between venous and finger-prick drug concentration has been reported for at least 40 drugs including artemesinin, gabapentin, ethanol and lignocaine [9, 10]. For finger-prick sampling to be used correctly it is important to ensure that sampling site dependency is recognized and taken into account.
The cause of the sampling site dependency is believed to be due to differences in arterial and venous drug concentrations [9]. Morksnes et al. recently reported a nearly two-fold higher concentration of nasal fentanyl in arterial compared with venous blood samples [14]. Finger-prick blood has generally been regarded as a capillary sample. However in reality it is actually a mixture of arteriolar, venous and capillary blood [15]. Following oral absorption of a drug, which may demonstrate wide inter-individual variability as is the case for oral paracetamol, there is a rapid distribution phase which brings about a fall in intravascular drug concentration as the drug is distributed to the extravascular spaces, a process that continues until equilibrium is achieved [16]. During the rapid distribution phase, drugs which have low molecular size, high lipid solubility and relatively low protein binding are easily transported across capillary walls into the interstitial and intracellular fluids [17]. This results in the creation of an arterio-venous difference in drug concentration [18], which may be manifest as a concentration difference between finger-prick and venous blood. Paracetamol is known to be highly lipid-soluble with negligible binding to plasma proteins [19], resulting in a high volume of distribution (70 l) [20, 21]. These physicochemical properties explain the concentration difference between finger-prick and venous samples observed in our study, suggesting the existence of an arteriovenous difference in concentration for paracetamol during the early phase of distribution.
In our study the difference between finger-prick and venous sample paracetamol concentrations decreased with time and was not significant beyond 60 min post dose, indicating attainment of dynamic equilibrium.
Using compartmental analysis, the drug concentration in sampled plasma or blood is the same as the concentration in circulating blood and perfused organs [19]. In clinical practice, finger-prick samples are a more acceptable, and possibly easier, procedure than venepuncture, using less blood for sampling [22, 23]. However unless the possibility of a concentration site-dependency is recognized this technique may generate significant errors in the calculation of pharmacokinetic parameters such as the absorption rate constant and area under the curve.
In conclusion, the results of this study confirm that finger prick sampling is suitable for sparse sampling in paediatric populations. However the possibility of significant differences between venous and peripheral blood concentrations during the distribution phase should be considered before determining pharmacokinetic parameters.
Acknowledgments
This work was done under the auspices of the Scottish Medicines for Children Network (ScotMSCN), a Centre for mounting clinical trials and addressing the knowledge gaps in support of the effective and safe use of medicines in children.
Competing interests
There are no competing interests to declare.
REFERENCES
- 1.Pettersen MD, Driscoll DJ, Moyer TP, Dearani JA, McGregor CGA. Measurement of blood serum cyclosporine levels using capillary ‘fingerstick’ sampling: a validation study. Transpl Int. 1999;12:429–32. doi: 10.1007/s001470050253. [DOI] [PubMed] [Google Scholar]
- 2.Webb NJA, Roberts D, Preziosi R, Keevil BG. Fingerprick blood samples can be used to accurately measure tacrolimus levels by tandem mass spectrometry. Pediatr Transplant. 2005;9:729–33. doi: 10.1111/j.1399-3046.2005.00367.x. [DOI] [PubMed] [Google Scholar]
- 3.Mei JV, Alexander JR, Adam BW, Hannon WH. Use of filter papers for the collection and analysis of human whole blood samples. J Nutr. 2001;131:S1631–6. doi: 10.1093/jn/131.5.1631S. [DOI] [PubMed] [Google Scholar]
- 4.Craft NE, Haitema T, Brindle LK, Yamini S, Humphrey JH, West KP., Jr Retinol analysis in dried blood spots by HPLC. J Nutr. 2000;130:882–5. doi: 10.1093/jn/130.4.882. [DOI] [PubMed] [Google Scholar]
- 5.Tawa R, Matsuanaga H, Fujimoto Y. High-performance liquid chromatography analysis of aminoglycoside antibiotics. J Chromatogr A. 1998;812:141–50. doi: 10.1016/s0021-9673(98)00342-2. [DOI] [PubMed] [Google Scholar]
- 6.Coombes EJ, Gamlen TR, Batstone GF, Holgate ST. The validation of a fluoroimminoassay for the determination of theophylline concentration in dried blood spot suitable for domiciliary therapeutic drug monitoring. Clin Chim Acta. 1984;136:187–95. doi: 10.1016/0009-8981(84)90291-2. [DOI] [PubMed] [Google Scholar]
- 7.Li PK, Lee JT, Conboy KA, Ellis EF. Fluorescence polarisation immunoassay for theophylline modified for use with dried blood spots on filter paper. Clin Chem. 1986;32:552–5. [PubMed] [Google Scholar]
- 8.AbuRuz S, Millership J, McElnay J. Dried blood spot liquid chromatography assay for therapeutic drug monitoring of metformin. J Chromatogr B. 2006;832:202–7. doi: 10.1016/j.jchromb.2005.12.050. [DOI] [PubMed] [Google Scholar]
- 9.Chiou LW. The phenomenon and rationale of marked dependence of drug concentration on blood sampling site, implications in pharmacokinetics, pharmacodynamics, toxicology and therapeutics (Part I) Clin Pharmacokinet. 1989;17:175–99. doi: 10.2165/00003088-198917030-00004. [DOI] [PubMed] [Google Scholar]
- 10.Gordi T, Hai TN, Hoai NM, Thyberg M, Ashton M. Use of saliva and capillary blood samples as substitutes for venous blood sampling in pharmacokinetic investigation of artemisinin. Eur J Clin Pharmacol. 2000;56:561–6. doi: 10.1007/s002280000179. [DOI] [PubMed] [Google Scholar]
- 11.Oliveira EJ, Watson DG, Morton NS. A simple microanalytical technique for the determination of paracetamol and its main metabolites in blood spots. J Pharm Biochem Anal. 2002;29:803–9. doi: 10.1016/s0731-7085(02)00174-7. [DOI] [PubMed] [Google Scholar]
- 12.Validation of analytical procedures: text and Methodology Q2(R1) 2005. International Conference on harmonisation of technical requirements for registration of pharmaceuticals for human use. ICH Harmonised Tripartite Guideline. Current step 4 version.
- 13.Carlsson KC, Reubsaet JLE. Sample preparation and determination of gabapentin in venous and capillary blood using liquid chromatography-tandem mass spectrometry. J Pharm Biomed Anal. 2004;34:415–23. doi: 10.1016/S0731-7085(03)00572-7. [DOI] [PubMed] [Google Scholar]
- 14.Moksnes K, Fredheim OM, Klepstad P, Kaasa S, Angelsen A, Nilsen T, Dale O. Early pharmacokinetics of nasal fentanyl: is there a significan arterio-venous difference? Eur J Clin Pharmacol. 2008;64:497–502. doi: 10.1007/s00228-007-0444-8. [DOI] [PubMed] [Google Scholar]
- 15.Merton G, Jones K, Lee M, Johnston A, Holt DW. Accuracy of cyclosporine measurement made in capillary blood samples obtained by skin puncture. Ther Drug Monit. 2000;22:594–8. doi: 10.1097/00007691-200010000-00015. [DOI] [PubMed] [Google Scholar]
- 16.Roland M, Tozer TN. Clinical Pharmacokinetics: Concepts and Applications. 3rd. Philadelphia, PA: Lippincott Williams & Wilkins; 1995. [Google Scholar]
- 17.Upton RN, Runciman WB, Nancarrow C, Carapetis RJ. The use of mass balance principles to describe regional drug distribution and elimination. J Pharm Biopharm. 1988;16:13–29. doi: 10.1007/BF01061860. [DOI] [PubMed] [Google Scholar]
- 18.Gyton AC. Textbook of Medical Physiology. 7th. Philadelphia, PA: WB Saunders; 1986. [Google Scholar]
- 19.Sweetman S, editor. 2007. Martindale 35 CD-ROM. Royal Pharmaceutical Society of Great Britain.
- 20.Shinoda S, Aoyama T, Aoyama Y, Tomioka S, Matsumoto Y, Ohe Y. Pharmacokinetics/pharmacodynamics of acetaminophen analgesia in Japanese patients with chronic pain. Biol Pharm Bull. 2007;30:157–61. doi: 10.1248/bpb.30.157. [DOI] [PubMed] [Google Scholar]
- 21.Chiou WL. The physiological significance of the apparent volume of distribution, Vdarea or Vdb in pharmacokinetic studies. Res Commun Chem Pathol Pharmacol. 1981;33:499–508. [PubMed] [Google Scholar]
- 22.Merton G, Jones K, Lee M, Johnston A, Holt DW. Accuracy of cyclosporin measurements made in capillary blood samples obtained by skin puncture. Ther Drug Monit. 2000;22:594–8. doi: 10.1097/00007691-200010000-00015. [DOI] [PubMed] [Google Scholar]
- 23.Shah V, Ohlsson A. Venepuncture versus heel lance for blood sampling in term neonate. Cochrane Database Syst Rev. 2007;4 doi: 10.1002/14651858.CD001452.pub3. Art. No.: CD001452. doi: 10.1002/14651858.CD001452.pub3. [DOI] [PubMed] [Google Scholar]


