

Abstract
AIM
The aim of this study was to find out whether the inhibition of cytochrome P450 2D6 (CYP2D6) with paroxetine or concomitant inhibition of CYP2D6 and CYP3A4 with paroxetine and itraconazole, altered the pharmacokinetics and pharmacological response of orally administered oxycodone.
METHODS
A randomized placebo-controlled cross-over study design with three phases was used. Eleven healthy subjects ingested 10 mg of oral immediate release oxycodone on the fourth day of pre-treatment with either placebo, paroxetine (20 mg once daily) or paroxetine (20 mg once daily) and itraconazole (200 mg once daily) for 5 days. The plasma concentrations of oxycodone and its oxidative metabolites were measured for 48 h, and pharmacological (analgesic and behavioural) effects were evaluated.
RESULTS
Paroxetine alone reduced the area under concentration–time curve (AUC(0,0–48 h)) of the CYP2D6 dependent metabolite oxymorphone by 44% (P < 0.05), but had no significant effects on the plasma concentrations of oxycodone or its pharmacological effects when compared with the placebo phase. When both oxidative pathways of the metabolism of oxycodone were inhibited with paroxetine and itraconazole, the mean AUC(0,∞) of oxycodone increased by 2.9-fold (P < 0.001), and its Cmax by 1.8-fold (P < 0.001). Visual analogue scores for subjective drug effects, drowsiness and deterioration of performance were slightly increased (P < 0.05) after paroxetine + itraconazole pre-treatment when compared with placebo.
CONCLUSIONS
Drug interactions arising from CYP2D6 inhibition most likely have minor clinical importance for oral oxycodone if the function of the CYP3A4 pathway is normal. When both CYP2D6 and CYP3A4 pathways are inhibited, the exposure to oral oxycodone is increased substantially.
Keywords: CYP2D6, CYP3A4, drug–drug interaction, itraconazole, oxycodone, paroxetine
WHAT IS ALREADY KNOWN ABOUT THIS SUBJECT
Oxycodone is an opioid analgesic that is metabolized mainly in the liver by cytochrome P450 (CYP) 2D6 and 3A4 enzymes.
So far, the effects of CYP2D6 or CYP3A4 inhibitors on the pharmacokinetics of oxycodone in humans have not been systematically studied.
WHAT THIS STUDY ADDS
Drug interactions arising from CYP2D6 inhibition most likely have minor clinical importance for oral oxycodone.
When both of CYP2D6 and CYP3A4 pathways are inhibited, the exposure to oral oxycodone is increased substantially.
Introduction
Oxycodone is a semisynthetic opioid agonist widely used in the treatment of acute pain. The use of oxycodone is also increasing in the management of cancer-related and chronic pain [1, 2]. Oxycodone is extensively metabolized by hepatic cytocrome P450 (CYP) isoenzymes, and only 10% is excreted unchanged in urine [3, 4]. The majority of oxycodone is N-demethylated to noroxycodone by CYP3A4, while a smaller fraction is O-demethylated to oxymorphone by CYP2D6 [5]. Since noroxycodone and oxymorphone are potent µ-opioid receptor agonists in vitro, it has been suggested that the analgesic effect of oxycodone is partly mediated by its active metabolites [6]. However, human studies suggest that the central effects of oxycodone are attributed to parent oxycodone [7, 8]. Because of its metabolism via CYP2D6 and CYP3A4 enzymes, oxycodone is prone to pharmacokinetic drug interactions. Drug interactions may unexpectedly increase the exposure to oxycodone and lead to potentially dangerous adverse effects, like respiratory depression [9].
Paroxetine is a selective serotonin re-uptake inhibitor (SSRI) commonly used in the treatment of depression [10]. The capability of paroxetine to inhibit CYP2D6-mediated drug metabolism has been known for years [11, 12]. Previous evidence demonstrates that paroxetine may cause clinically significant drug interactions [13, 14].
Itraconazole is an antimycotic which has been shown to have clinically significant drug interactions with many drugs metabolized by CYP3A4 enzyme [15–19]. It is classified as a strong inhibitor of CYP3A4 and its use as a standard CYP3A4 inhibitor has been recommended in drug–drug interaction studies [20].
The aim of this study was to find out whether the inhibition of CYP2D6 with paroxetine or the inhibition of CYP2D6 and CYP3A4 with a combination of paroxetine and itraconazole altered the pharmacokinetics and pharmacodynamics of orally administered oxycodone.
Methods
Study participants
In view of previous studies, it was calculated that 10 subjects would be required to demonstrate a 30% difference between the largest mean and the smallest mean in the area under the oxycodone plasma concentration–time curve at a level of significance of P = 0.05 and power of 80% [3]. In order to prepare for dropouts, 12 healthy non-smoking subjects were enrolled. All subjects gave written informed consent. Subjects were ascertained to be healthy by clinical examination including an ECG and basic blood chemistry tests. None of the subjects was receiving regular medication including oral contraceptives or taking any natural products. Urine drug screen and pregnancy tests were negative. The risk of participants to develop drug abuse was considered low as evaluated by the Finnish version of the Abuse Questions [21].
Study design
The study protocol was approved by the ethics committee of the Hospital District of Southwest Finland and by the Finnish National Agency for Medicines. We used a randomized three phase placebo-controlled crossover study design with a 4 week wash-out period. Subjects were given placebo, paroxetine or a combination of paroxetine and itraconazole for 5 days in randomized order. The paroxetine dose was 20 mg daily (Seroxat 20 mg tablet, GlaxoSmithKline, Brentford, United Kingdom). The dose of itraconazole was 200 mg once a day (Sporanox 100 mg capsule, Janssen-Cilag, Latina, Italy). A hospital pharmacist not involved in the study, repacked the study drugs and placebos to daily doses in little paper bags according to a randomization list. The number of capsules per day in different pre-treatments was equalized by the use of additional non-matching placebo capsules. The participants were instructed to take the pre-treatment medication at home at 08.00 h. To ensure adherence to the drug dosing schedule, they were asked to send a mobile phone text message to the investigator after each dose. On day 4, pre-treatments were taken in the study facility and 1 h later the subjects ingested a single dose of 10 mg of oxycodone hydrochloride as an immediate release formulation (Oxynorm 10 mg capsule, Mundipharma, Bard pharmaceuticals Ltd, Cambridge, United Kingdom) with 150 ml of water. Last doses of placebo, paroxetine or paroxetine and itraconazole were taken on day 5.
The subjects were instructed to fast for 8 h before the administration of oxycodone. Standard meals were served 4 and 8 h after oxycodone. The use of any other drugs, natural products, alcohol, coffee, tea, grapefruit juice and cola drinks was not permitted on test days. On day 4, a forearm vein was cannulated and blood samples were collected before and 0.5, 1, 1.5, 2, 3, 4, 5, 6, 8, 10, 12, 24 and 48 h after oxycodone administration.
Analysis of blood samples
Plasma was separated within 30 min and stored at −70°C until analysis. Plasma concentrations of oxycodone, noroxycodone, oxymorphone and noroxymorphone were determined using a validated liquid chromatography tandem mass spectrometric (LC-MS/MS) method as previously described [22]. The lower limits of quantification (LLQ) were 0.1 ng ml−1 for oxycodone and oxymorphone and 0.25 ng ml−1 for noroxycodone and noroxymorphone, respectively.
The inter-day coefficients of variation (CV) for oxycodone were 4.6% and 2.7% at 5.0 ng ml−1 and 100 ng ml−1, respectively (n = 10). For oxymorphone the inter-day CVs were 11.6% at 0.1 ng ml−1 and 3.7% at 5.0 ng ml−1 (n = 10). The values of CVs for noroxycodone were 7.2% and 3.8% at 0.5 ng ml−1 and 5.0 ng ml−1 (n = 10), and for noroxymorphone 9.5% and 6.6% at 0.5 ng ml−1 and 10 ng ml−1, respectively (n = 10).
The use of pre-medication was ascertained with liquid chromatography by determining the presence of paroxetine, itraconazole and its metabolite hydroxy-itraconazole in blood samples drawn on the morning of study day 4 before the administration of study drugs [23, 24].
Genotyping
Genotyping for CYP2D6 was performed using a two-step multiplex primer extension method which allowed the detection of 11 of the most relevant polymorphic positions and assessment of whole-gene deletion, duplication and allele composition of gene duplication [25]. Seven subjects were classified as extensive metabolizers (EM). Four of them were homozygous for the CYP2D6*1 allele and the rest three had genotypes CYP2D6*1/*3, CYP2D6*1/*4 and CYP2D6*1/*10. Two subjects had CYP2D6*1/*1 with gene duplication and were therefore classified as ultrarapid metabolizers (UM). Among the subjects, there were also two poor metabolizers (PM), one with CYP2D6*4/*4 genotype and another with CYP2D6*4/*6 genotype. All subjects were Caucasians.
Pharmacokinetics
Peak plasma concentrations (Cmax) and corresponding Cmax times (tmax) of oxycodone and its metabolites were observed directly from plasma concentration data. Individual terminal log-linear phases of the plasma concentration–time curves were identified visually. The elimination rate constant (λz) was determined by regression analysis of the log-linear part of the curve. The elimination half-life (t1/2) was calculated using the equation t1/2 = ln2/λz. The areas under concentration–time curves (AUC) for oxycodone, noroxycodone, oxymorphone and noroxymorphone were calculated using the linear trapezoidal rule when successive concentration values were increasing and the logarithmic trapezoidal rule when values were decreasing. For oxycodone and noroxycodone AUC(0,∞) was extrapolated to infinity by using the respective λz value. Since λz was often impossible to determine due to low plasma concentrations of the metabolite, AUC(0,48 h) was used instead of AUC(0,∞) for oxymorphone and noroxymorphone. The apparent oral clearance (CL/F) and the apparent volume of distribution of oxycodone during elimination (Vz/F) were calculated using standard non-compartmental methods. To compare the relative abundance of each metabolite, metabolite-to-parent drug AUC ratios (AUCm : AUCp) were calculated. To estimate the contribution of oxymorphone in overall opioid exposure as a component of oxycodone's active moiety, AUC values for oxycodone and oxymorphone were also calculated by using molar concentrations.
The pharmacokinetic data were analyzed by use of the WinNonlin pharmacokinetic program (version 4.1; Pharsight, Mountain View, California,USA).
Pharmacodynamics
The participants evaluated subjective effects using 100 mm horizontal visual analogue scales (VAS) for the following items: alertness/drowsiness, very good performance/very poor performance and unpleasant feeling/very pleasant feeling [26]. Drug effect was assessed by asking the subjects to rate on a scale of 0–100 whether they experienced they were under the influence of a drug (0 = no drug effect, 100 = maximal drug effect).
Pupil diameter was assessed using Cogan's pupillometer under steady lighting conditions [27]. Maddox wing was used to measure the central co-ordination of extraocular muscles [28]. Digit symbol substitution test (DSST) was used by recording the number of correct symbols substituted in 3 min [29].
The analgesic effect of oxycodone was evaluated using a cold pressor test [30]. The subject immersed his or her left hand into ice-water (temperature 0.5–2°C) up to the wrist for 1 min. The latency from the immersion to the first sensation of pain was defined as the cold pain threshold (CPT). During the immersion, the subjects were asked to report the intensity of pain at 30 and 60 s using a numerical rating scale (NRS, 0 = no pain, 100 = maximal pain). If pain became intolerable, the subject was instructed to withdraw his or her hand from the water, and pain intensity was recorded as maximal (100).
Pharmacodynamic effects were evaluated prior to and 1, 2, 3, 4, 5, 6, 8, 10 and 12 h after oxycodone administration. The order of tests was standardized as follows: behavioural scales, pupil size, Maddox wing test, DSST and cold pressor test. For each pharmacodynamic variable, the area under the effect–time curve (AUEC) was determined by trapezoidal rule from 0 to 6 and to 12 h.
Statistical analysis
The normality of data was evaluated prior to the statistical analysis. In case of marked positive skewness of the distribution, the data were transformed to logarithms to correct for non-normality of the distribution. Because of the crossover study design, tests were performed to rule out the contribution of phase sequence to overall variance. To compare the differences in pharmacokinetic parameters and AUEC values between the study phases, analysis of variance for repeated measures was used and a posteriori testing was done with Tukey's test. P values of <0.05 were regarded as statistically significant. The tmax was analysed by Friedman's test. Results are expressed as mean values ± SD except for tmax where median and range are given. Percentage differences between phases were calculated within subjects. To assess the possible interaction in terms of bioequivalence, we calculated geometric mean ratios with 90% confidence intervals. Data were analyzed by use of the SYSTAT for Windows statistical program (version 10.2; Systat Software, Richmond, California) and with GraphPad Prism 5 for Windows (GraphPad Software, San Diego, California).
Results
One of the 12 recruited subjects withdrew from study just before the first test day due to personal reasons. Eleven subjects, five men and six women (aged 19–25 years, weighing 50–108 kg) completed the study.
The mean plasma concentrations of oxycodone and its oxidative metabolites during the three phases are presented in Figure 1. We could not demonstrate that paroxetine would have any clinically significant effect on the pharmacokinetic parameters of oxycodone although it markedly altered the plasma concentrations of the primary and secondary metabolites (Table 1). After pre-treatment with the combination of paroxetine and itraconazole, the metabolic clearance of oxycodone was substantially reduced and the mean t1/2 of oxycodone prolonged from 3.6 h to 6.0 h (P < 0.001). The mean apparent oral clearance of oxycodone was decreased by 64% (P < 0.001) and the mean AUC(0,∞) of oxycodone increased by 188% (P < 0.001). Furthermore, the mean Cmax of oxycodone was increased 1.8-fold (P < 0.001) as compared with the placebo phase (Table 1). As shown in Figure 2, these changes in the pharmacokinetics of oral oxycodone were evident in all subjects with the greatest increase being 4-fold and 2.4-fold for AUC(0,∞) and Cmax, respectively.
Figure 1.
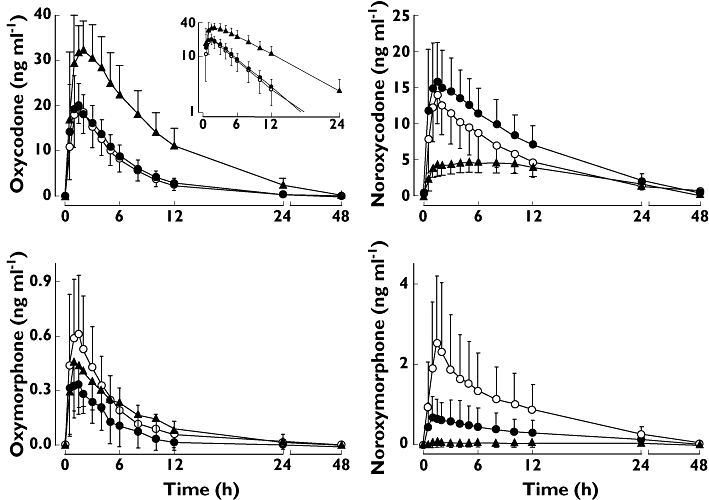
Mean plasma (±SD) concentrations of oxycodone, noroxycodone, oxymorphone and noroxymorphone in 11 healthy volunteers after 10 mg oral oxycodone hydrochloride on the fourth day of pre-treatment either with placebo (open circles), paroxetine 20 mg day−1 (solid circles) or a combination of paroxetine 20 mg day−1 and itraconazole 200 mg day−1 (solid triangles). The inset depicts the same data on a semilogarithmic scale. Oxycodone + placebo (○); Oxycodone + paroxetine (•); Oxycodone + paroxetine + itraconazole (▴)
Table 1.
Pharmacokinetic parameters of oxycodone and its primary and secondary oxidative metabolites after oral administration of 10 mg immediate release oxycodone hydrochloride on the fourth day of pre-treatment with placebo, paroxetine, or with the combination of paroxetine and itraconazole. Doses of paroxetine and itraconazole were 20 mg and 200 mg, respectively, as a single daily dose for 5 days
| Geometric mean ratio (90% CI) for | |||||||
|---|---|---|---|---|---|---|---|
| Parameter | Placebo | Paroxetine | 95% CI of difference between phases | Itraconazole +Paroxetine | 95% CI of difference between phases | Paroxetine/Placebo | Itraconazole +Paroxetine/Placebo |
| Oxycodone | |||||||
| Cmax (ng ml−1) | 21.5 ± 4.6 | 22.6 ± 5.6 | −4.57, 6.84 | 36.9 ± 8.1*** | 9.71, 21.1 | 1.05 (0.96, 1.14) | 1.72 (1.51, 1.96) |
| % of control and range | 100 | 106 (81–139) | 177 (116–242) | ||||
| tmax (h) | 1.5 (1.0–2.0) | 1 (0.5–4.0) | 1.5 (0.5–4) | ||||
| AUC(0,∞) (µg ml−1 min) | 7.5 ± 2.4 | 8.0 ± 1.8 | −2.49, 3.45 | 20.8 ± 5.7*** | 10.38, 16.33 | 1.09 (0.97, 1.21) | 2.82 (2.49, 3.19) |
| % of control and range | 100 | 111 (85–151) | 288 (162–407) | ||||
| t1/2 (h) | 3.6 ± 0.8 | 3.5 ± 0.6 | −0.77, 0.59 | 6.0 ± 1.3*** | 1.73, 3.09 | 0.98 (0.91, 1.06) | 1.65 (1.43, 1.90) |
| % of control and range | 100 | 99 (73–116) | 170 (94–214) | ||||
| CL/F (l min−1) | 1.31 ± 0.40 | 1.18 ± 0.28 | −0.34, 0.09 | 0.45 ± 0.11*** | −1.07, −0.64 | 0.92 (0.82, 1.03) | 0.38 (0.34, 0.43) |
| % of control and range | 100 | 94 (66–118) | 36 (24–61) | ||||
| Vz/F (l) | 400.3 ± 120.8 | 357.0 ± 84.7 | −94.2, 7.5 | 233.5 ± 69.8*** | −217.7, −116.0 | 0.91 (0.82, 1.00) | 0.58 (0.52, 0.65) |
| % of control and range | 100 | 92 (64–115) | 59 (38–81) | ||||
| Noroxycodone | |||||||
| Cmax (ng ml−1) | 14.2 ± 4.4 | 18.0 ± 5.5** | 0.87, 6.80 | 5.3 ± 1.6*** | −11.85, −5.92 | 1.28 (1.15, 1.42) | 0.38 (0.33, 0.43) |
| % of control and range | 100 | 130 (94–178) | 39 (21–51) | ||||
| tmax (h) | 1.5 (0.5–3.0) | 1.0 (0.5–4.0) | 4.0 (1.0–10.0) | ||||
| AUC(0,∞) (µg ml−1 min) | 7.8 ± 3.2 | 11.7 ± 3.8*** | 2.09, 5.78 | 6.3 ± 1.9 | −3.37, 0.32 | 1.59 (1.32, 1.92) | 0.85 (0.72, 0.99) |
| % of control and range | 100 | 168 (83–314) | 88 (53–134) | ||||
| t1/2 (h) | 5.6 ± 0.9 | 6.5 ± 1.0 | −0.11, 1.93 | 8.6 ± 1.6*** | 1.93, 3.97 | 1.16 (1.04, 1.30) | 1.51 (1.35, 1.70) |
| % of control and range | 100 | 118 (92–198) | 154 (107–215) | ||||
| AUCm : AUCp | 1.0 ± 0.3 | 1.5 ± 0.3*** | 0.21, 0.66 | 0.3 ± 0.1*** | −0.96, −0.51 | 1.47 (1.28, 1.68) | 0.30 (0.25, 0.35) |
| % of control and range | 100 | 151 (98–233) | 31 (19–46) | ||||
| Oxymorphone | |||||||
| Cmax (ng ml−1) | 0.68 ± 0.32 | 0.43 ± 0.22* | −0.46, −0.04 | 0.51 ± 0.29 | −0.38, 0.04 | 0.63 (0.50, 0.78) | 0.75 (0.56, 1.00) |
| % of control and range | 100 | 67 (33–101) | 85 (37–157) | ||||
| AUC(0,48h) (µg ml−1 min) | 0.21 ± 0.17 | 0.10 ± 0.07* | −0.19, −0.02 | 0.22 ± 0.15 | −0.07, 0.10 | 0.48 (0.33, 0.69) | 1.06 (0.76, 1.49) |
| % of control and range | 100 | 56 (9–90) | 122 (24–212) | ||||
| AUCm : AUCp | 0.032 ± 0.024 | 0.014 ± 0.011** | −0.029, −0.01 | 0.011 ± 0.008** | −0.03, −0.01 | 0.44 (0.29, 0.66) | 0.37 (0.26, 0.54) |
| % of control and range | 100 | 52 (7–104) | 44 (7–85) | ||||
| Noroxymorphone | |||||||
| Cmax (ng ml−1) | 2.7 ± 1.9 | 0.8 ± 0.6** | −2.92, −0.87 | 0.1 ± 0.2*** | −3.63, −1.56 | 0.31 (0.26, 0.39) | 0.09 (0.05, 0.14) |
| % of control and range | 100 | 25 (0–52) | 3 (0–13) | ||||
| AUC(0,48h) (µg ml−1 min) | 1.6 ± 1.0 | 0.5 ± 0.5*** | −1.55, −0.51 | 0.1 ± 0.2*** | −2.00, −0.95 | 0.20 (0.12, 0.33) | 0.01 (0.00, 0.03) |
| % of control and range | 100 | 26 (0–66) | 4 (0–24) | ||||
| AUCm : AUCp | 0.23 ± 0.17 | 0.07 ± 0.07** | −0.25, −0.07 | 0.01 ± 0.01*** | −0.31, −0.14 | 0.18 (0.11, 0.29) | 0.00 (0.00, 001) |
| % of control and range | 100 | 22 (0–47) | 1 (0–9) | ||||
P < 0.05,
P < 0.01,
P < 0.001 compared with placebo phase, anova for repeated measures. Data is given as mean ± SD (median and range for tmax). Percent of placebo phase was calculated individually for each subject. Cmax, peak plasma concentration; tmax, time to peak plasma concentration; AUC(0,∞), area under plasma concentration–time curve extrapolated to infinity; CL/F, apparent oral clearance; Vz/F, apparent volume of distribution during elimination; t1/2, elimination half-life; AUCm : AUCp, ratio of AUC of metabolite to AUC of parent drug oxycodone; CI, confidence interval.
Figure 2.
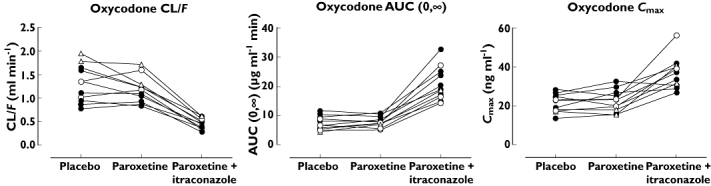
Individual values of AUC(0,∞), t1/2 and apparent oral clearance (CL/F) for oxycodone in 11 healthy volunteers after a singe oral dose of 10 mg oxycodone hydrochloride on the fourth day of pre-treatment with placebo, paroxetine 20 mg day−1 or a combination of paroxetine 20 mg day−1 and itraconazole 200 mg day−1. Symbols for EM genotype (•), PM genotype (○), UM genotype (▵)
Oxymorphone accounted for only 3% of the active moiety of oxycodone in the placebo phase.
When used alone, paroxetine decreased the mean AUC(0,48h) of the CYP2D6 dependent primary metabolite oxymorphone by 44% (P < 0.05) and increased the mean AUC(0,infinity) of the CYP3A4 dependent primary metabolite noroxycodone by 68% (P < 0.001). The concentrations of the secondary metabolite noroxymorphone were also lower during the paroxetine phase (Figure 1, Table 1). During the paroxetine and itraconazole phase, the relative abundance of both primary oxidative metabolites expressed as AUCm : AUCp was reduced mainly due to the increase in AUC of the parent drug. Formation of noroxymorphone was practically abolished when both the CYP2D6 and the CYP3A4 pathways were inhibited with paroxetine and itraconazole (Table 1). These changes in the relative abundance of oxidative metabolites of oxycodone were evident in all subjects, except those two with PM genotype for CYP2D6. As expected, the subjects with UM genotype appeared to have higher, and the subjects with PM genotype, lower oxymorphone concentrations than extensive metabolizers.
The mean plasma trough concentrations of itraconazole and hydroxy-itraconazole during the itraconazole-paroxetine phase were 65 ng ml−1 and 174 ng ml−1, respectively, prior to itraconazole dosing on day 4. The mean plasma trough concentrations of paroxetine were 9.7 ng ml−1 and 12.3 ng ml−1 during the paroxetine and itraconazole + paroxetine phases, respectively.
As shown in Figure 3, the maximum effect of oxycodone on the behavioural tests and on cold pain scores was observed 1–3 h after oxycodone administration. Oxycodone induced miosis during the placebo phase but not during the other phases. When comparing the AUEC(0,6h) values of the pharmacodynamic variables, pre-treatment with paroxetine and itraconazole increased (P < 0.05) VAS scores for oxycodone induced drowsiness, drug effect and deterioration of performance. The administration of paroxetine alone increased the VAS score for deterioration of performance for the first 6 h following oxycodone (P < 0.01). However, when comparing the AUEC(0,12 h) values of these pharmacodynamic variables, no statistically significant differences were detected between the study phases (Figure 3, Table S1). There were no differences in the AUEC values for cold pain scores, Maddox wing, DSST and VAS score for pleasantness between the study phases.
Figure 3.
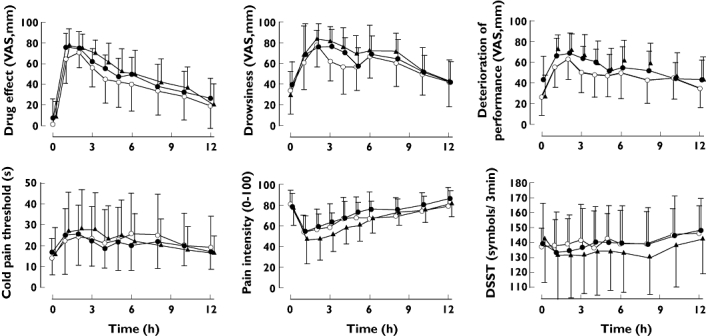
Mean (±SD) self-reported drug effect, drowsiness, deterioration of performance, cold pain threshold, cold pain intensity at 60 s (CPI60) and number of digits substituted in 3 min (DSST) after an oral dose of 10 mg of oxycodone hydrochloride on the fourth day of pre-treatment either with placebo (open circles), paroxetine 20 mg day−1 (solid circles) or a combination of paroxetine 20 mg day−1 and itraconazole 200 mg day−1 (solid triangles). Oxycodone + placebo (○); Oxycodone + paroxetine (•); Oxycodone + paroxetine + itraconazole (▴)
Adverse effects
One subject complained of nausea during paroxetine pre-treatment. Five subjects (three during the paroxetine and two during the paroxetine and itraconazole phases) experienced nausea on the test day approximately 3–4 h after oxycodone administration. It was relieved in a couple of hours, but one subject continued to have nausea until the end of the day. Among those five subjects who complained nausea, there were four subjects with EM genotype and one subject with UM genotype.
Discussion
Paroxetine is a strong mechanism-based inhibitor of the CYP2D6 enzyme [31]. Although paroxetine considerably decreased the CYP2D6 mediated O-demethylation of oxycodone to oxymorphone in this study, it had no effect on the pharmacokinetics of the parent drug oxycodone when the CYP3A4 dependent pathway of oxycodone metabolism was left intact. Similar results have previously been reported with the CYP2D6 inhibitor quinidine [32]. The present results are in agreement with the findings of Lalovic et al. in demonstrating that the CYP3A4 mediated N-demethylation to noroxycodone is the principal oxidative metabolic pathway for oxycodone, and CYP2D6 is responsible only for about 10% of the metabolism of oxycodone [5]. The effect of paroxetine on the concentrations of the parent drug oxycodone was nonexistent even when the two poor metabolizers of CYP2D6 were excluded. Our pre-treatments lasted for 5 days. One could argue that the inhibitory effect might have been somewhat stronger had we continued paroxetine treatment for longer. However, the inhibitory effect of paroxetine on CYP2D6 activity has previously been demonstrated even after a few days' treatment or a single oral dose [11, 33].
Although oxymorphone, the CYP2D6-dependent metabolite of oxycodone is an effective analgesic when administered orally [34], its role in the analgesic effect of oxycodone has not been confirmed. Since it has a notably higher affinity for µ-opioid receptor than oxycodone, theoretically it may act as an active metabolite of oxycodone [6]. However, its ability to penetrate the blood-brain barrier is weaker than that of oxycodone [7]. Similarly to previous studies [8, 32], plasma concentrations of oxymorphone in the present study were very low and oxymorphone accounted for only 3% of the active moiety of oxycodone. Although paroxetine significantly decreased oxymorphone concentrations, the AUC(0,∞) of oxycodone and cold pain scores remained unaltered. Based on these findings, we suggest that oxymorphone does not play a role in the analgesic effects of oxycodone in the cold pain test in healthy subjects.
When both CYP2D6 and CYP3A4 pathways were inhibited with concomitant paroxetine and itraconazole administration, the exposure to oxycodone increased significantly as indicated by a 2.9-fold increase in the AUC(0,∞) of oxycodone. After paroxetine and itraconazole, the mean plasma concentrations of oxycodone at 6 and 12 h after oxycodone administration were 2.7- and 4.3-fold higher than after placebo. Also the Cmax of oxycodone was almost two times higher when compared with placebo. The observed pharmacokinetic changes were most likely due to enzyme inhibition induced decrease in the plasma clearance and first-pass metabolism of oxycodone. Because the therapeutic index of opioids is relatively narrow, the increase of oxycodone concentrations to the degree shown in the present study may potentiate the risk of clinically relevant adverse effects like respiratory depression, especially when higher and multiple doses are used [9].
The oxidative metabolism of oxycodone is normally mediated by two different CYP isoforms and this may reduce the risk of clinically relevant drug interactions with the inhibitors of CYP enzymes when just a single pathway is inhibited. When the CYP2D6 pathway is inhibited, the remaining pathway may compensate for the changes in the overall metabolism of oxycodone. However, the capacity of the CYP2D6 pathway to compensate the principal CYP3A4 catalyzed pathway is limited, especially in subjects with PM genotype. In the present study, the metabolism of oxycodone, oxymorphone and noroxycodone were presumably shifted more towards the reductive pathways when both the oxidative metabolic pathways were inhibited [7].
The inhibition of CYP3A4 with the azole antimycotic voriconazole has been shown to increase the exposure to oral oxycodone by 3.6-fold [35]. In the present study, the observed increases in oxycodone concentrations were smaller even though both CYP3A4 and 2D6 were concomitantly inhibited. In vitro data have suggested that CYP enzymes other than CYP2D6 and CYP3A4 may have some minor contribution to the metabolism of oxycodone [5]. Since voriconazole has been shown to be a very strong inhibitor of not only CYP3A4 but also 2C9 and 2C19 [36], the observed difference in the magnitude of the interaction may be partly explained by the increased role of these other CYP enzymes, assuming that these enzymes are not inhibited by itraconazole. The magnitude of the interaction between the combination of paroxetine and itraconazole with oxycodone was stronger than the interaction of telithromycin, an inhibitor of both CYP2D6 and CYP3A4, with oxycodone. In our previous study, telithromycin caused a 1.8-fold increase in the AUC(0,∞) value of oxycodone [37]. This is plausible because although telithromycin is a strong inhibitor of CYP3A4, it is a weaker inhibitor of CYP2D6 [38].
Itraconazole is an inhibitor of the transmembrane transporter protein P-glycoprotein. Itraconazole could therefore increase the bioavailability of oral oxycodone due its inhibitory effect on intestinal and hepatic P-glycoprotein, delay the excretion of oxycodone in the kidneys and augment its access through the blood-brain barrier [39]. Regarding opioids, morphine and loperamide are substrates of P-glycoprotein [40, 41]. However, based on a few animal studies, the role of P-glycoprotein in the pharmacokinetics of oxycodone is controversial [42, 43].
Although oxycodone concentrations were sustantially increased when both of its oxidative metabolic pathways were inhibited, we did not observe any major changes in pharmacological response. A minor increase in opioid effects was seen following the administration oxycodone after pre-treatment with paroxetine and itraconazole. These changes were recorded only for the first 6 h after oxycodone administration, since a rapidly absorbed immediate release formulation of oxycodone was used. Oxycodone induced miosis during the placebo phase, but during the other phases the measurement of pupil size as a surrogate for opioid effect was obviously hampered by paroxetine induced mydriasis [44, 45]. We cannot rule out the possible influence of paroxetine on other pharmacodynamic measurements as well. In addition small sample size, relatively small dose of oxycodone, rather insensitive pharmacodynamic measurements and the high inter-individual variability in opioid responses [46] may have contributed to the pharmacodynamic findings of this study.
It can be concluded that since blocking of the CYP2D6 pathway with the potent CYP2D6 inhibitor paroxetine had no clinically significant effect on the pharmacokinetics of oral oxycodone, the drug interactions arising from CYP2D6 inhibition most likely have negligible clinical importance for oral oxycodone if the function of the CYP3A4 pathway is normal. Concomitant inhibition of the CYP3A4 pathway with itraconazole increased the exposure to oral oxycodone substantially, but after a single dose of oxycodone this did not significantly influence opioid effects. However, as the clearance of oxycodone is decreased there is an increased risk of accumulation during repeated administration.
Acknowledgments
We want to thank Mrs Elina Kahra for her skilful technical assistance. This study was supported by the Turku University Foundation and the EVO grants 13821 of the Hospital District of the Southwest Finland.
Competing interests
KO has received an unrestricted research grant from Mundipharma Inc, Finland. There are no other competing interests to declare.
Supporting information
Additional supporting information may be found in the online version of this article:
Table S1
AUEC(0,6 h) values of the pharmacodynamic variables after oral administration of 10 mg immediate release oxycodone hydrochloride on the fourth day of pre-treatment with placebo paroxetine, or with the combination of paroxetine and itraconazole
Please note: Wiley-Blackwell are not responsible for the content or functionality of any supporting materials supplied by the authors. Any queries (other than missing material) should be directed to the corresponding author for the article.
REFERENCES
- 1.Kalso E. Oxycodone. J Pain Symptom Manage. 2005;29:S47–56. doi: 10.1016/j.jpainsymman.2005.01.010. [DOI] [PubMed] [Google Scholar]
- 2.Hamunen K, Paakkari P, Kalso E. Trends in opioid consumption in the Nordic countries 2002–2006. Eur J Pain. 2009;13:954–62. doi: 10.1016/j.ejpain.2008.11.006. [DOI] [PubMed] [Google Scholar]
- 3.Pöyhiä R, Seppälä T, Olkkola KT, Kalso E. The pharmacokinetics and metabolism of oxycodone after intramuscular and oral administration to healthy subjects. Br J Clin Pharmacol. 1992;33:617–21. doi: 10.1111/j.1365-2125.1992.tb04090.x. [DOI] [PMC free article] [PubMed] [Google Scholar]
- 4.Kirvelä M, Lindgren L, Seppälä T, Olkkola KT. The pharmacokinetics of oxycodone in uremic patients undergoing renal transplantation. J Clin Anesth. 1996;8:13–8. doi: 10.1016/0952-8180(95)00092-5. [DOI] [PubMed] [Google Scholar]
- 5.Lalovic B, Phillips B, Risler LL, Howald W, Shen DD. Quantitative contribution of CYP2D6 and CYP3A to oxycodone metabolism in human liver and intestinal microsomes. Drug Metab Dispos. 2004;32:447–54. doi: 10.1124/dmd.32.4.447. [DOI] [PubMed] [Google Scholar]
- 6.Thompson CM, Wojno H, Greiner E, May EL, Rice KC, Selley DE. Activation of G-proteins by morphine and codeine congeners: insights to the relevance of O- and N-demethylated metabolites at mu- and delta-opioid receptors. J Pharmacol Exp Ther. 2004;308:547–54. doi: 10.1124/jpet.103.058602. [DOI] [PubMed] [Google Scholar]
- 7.Lalovic B, Kharasch E, Hoffer C, Risler L, Liu-Chen LY, Shen DD. Pharmacokinetics and pharmacodynamics of oral oxycodone in healthy human subjects: role of circulating active metabolites. Clin Pharmacol Ther. 2006;79:461–79. doi: 10.1016/j.clpt.2006.01.009. [DOI] [PubMed] [Google Scholar]
- 8.Kaiko RF, Benziger DP, Fitzmartin RD, Burke BE, Reder RF, Goldenheim PD. Pharmacokinetic-pharmacodynamic relationships of controlled-release oxycodone. Clin Pharmacol Ther. 1996;59:52–61. doi: 10.1016/S0009-9236(96)90024-7. [DOI] [PubMed] [Google Scholar]
- 9.Pattinson KT. Opioids and the control of respiration. Br J Anaesth. 2008;100:747–58. doi: 10.1093/bja/aen094. [DOI] [PubMed] [Google Scholar]
- 10.Wagstaff AJ, Cheer SM, Matheson AJ, Ormrod D, Goa KL. Paroxetine: an update of its use in psychiatric disorders in adults. Drugs. 2002;62:655–703. doi: 10.2165/00003495-200262040-00010. [DOI] [PubMed] [Google Scholar]
- 11.Brosen K, Hansen JG, Nielsen KK, Sindrup SH, Gram LF. Inhibition by paroxetine of desipramine metabolism in extensive but not in poor metabolizers of sparteine. Eur J Clin Pharmacol. 1993;44:349–55. doi: 10.1007/BF00316471. [DOI] [PubMed] [Google Scholar]
- 12.Jeppesen U, Gram LF, Vistisen K, Loft S, Poulsen HE, Brosen K. Dose-dependent inhibition of CYP1A2, CYP2C19 and CYP2D6 by citalopram, fluoxetine, fluvoxamine and paroxetine. Eur J Clin Pharmacol. 1996;51:73–8. doi: 10.1007/s002280050163. [DOI] [PubMed] [Google Scholar]
- 13.Özdemir V, Naranjo CA, Herrmann N, Reed K, Sellers EM, Kalow W. Paroxetine potentiates the central nervous system side effects of perphenazine: contribution of cytochrome P4502D6 inhibition in vivo. Clin Pharmacol Ther. 1997;62:334–47. doi: 10.1016/S0009-9236(97)90037-0. [DOI] [PubMed] [Google Scholar]
- 14.Goryachkina K, Burbello A, Boldueva S, Babak S, Bergman U, Bertilsson L. Inhibition of metoprolol metabolism and potentiation of its effects by paroxetine in routinely treated patients with acute myocardial infarction (AMI) Eur J Clin Pharmacol. 2008;64:275–82. doi: 10.1007/s00228-007-0404-3. [DOI] [PubMed] [Google Scholar]
- 15.Venkatakrishnan K, von Moltke LL, Greenblatt DJ. Effects of the antifungal agents on oxidative drug metabolism: clinical relevance. Clin Pharmacokinet. 2000;38:111–80. doi: 10.2165/00003088-200038020-00002. [DOI] [PubMed] [Google Scholar]
- 16.Olkkola KT, Ahonen J, Neuvonen PJ. The effects of the systemic antimycotics, itraconazole and fluconazole, on the pharmacokinetics and pharmacodynamics of intravenous and oral midazolam. Anesth Analg. 1996;82:511–6. doi: 10.1097/00000539-199603000-00015. [DOI] [PubMed] [Google Scholar]
- 17.Kaukonen KM, Olkkola KT, Neuvonen PJ. Itraconazole increases plasma concentrations of quinidine. Clin Pharmacol Ther. 1997;62:510–7. doi: 10.1016/S0009-9236(97)90046-1. [DOI] [PubMed] [Google Scholar]
- 18.Jalava KM, Olkkola KT, Neuvonen PJ. Itraconazole greatly increases plasma concentrations and effects of felodipine. Clin Pharmacol Ther. 1997;61:410–5. doi: 10.1016/S0009-9236(97)90191-0. [DOI] [PubMed] [Google Scholar]
- 19.Varhe A, Olkkola KT, Neuvonen PJ. Oral triazolam is potentially hazardous to patients receiving systemic antimycotics ketoconazole or itraconazole. Clin Pharmacol Ther. 1994;56:601–7. doi: 10.1038/clpt.1994.184. [DOI] [PubMed] [Google Scholar]
- 20.Huang SM, Temple R, Throckmorton DC, Lesko LJ. Drug interaction studies: study design, data analysis, and implications for dosing and labeling. Clin Pharmacol Ther. 2007;81:298–304. doi: 10.1038/sj.clpt.6100054. [DOI] [PubMed] [Google Scholar]
- 21.Michna E, Ross EL, Hynes WL, Nedeljkovic SS, Soumekh S, Janfaza D, Palombi D, Jamison RN. Predicting aberrant drug behavior in patients treated for chronic pain: importance of abuse history. J Pain Symptom Manage. 2004;28:250–8. doi: 10.1016/j.jpainsymman.2004.04.007. [DOI] [PubMed] [Google Scholar]
- 22.Neuvonen M, Neuvonen PJ. Determination of oxycodone, noroxycodone, oxymorphone, and noroxymorphone in human plasma by liquid chromatography-electrospray-tandem mass spectrometry. Ther Drug Monit. 2008;30:333–40. doi: 10.1097/FTD.0b013e31816e2d4b. [DOI] [PubMed] [Google Scholar]
- 23.Chu S, Metcalfe CD. Analysis of paroxetine, fluoxetine and norfluoxetine in fish tissues using pressurized liquid extraction, mixed mode solid phase extraction cleanup and liquid chromatography-tandem mass spectrometry. J Chromatogr A. 2007;1163:112–8. doi: 10.1016/j.chroma.2007.06.014. [DOI] [PubMed] [Google Scholar]
- 24.Gubbins PO, Gurley BJ, Bowman J. Rapid and sensitive high performance liquid chromatographic method for the determination of itraconazole and its hydroxy-metabolite in human serum. J Pharm Biomed Anal. 1998;16:1005–12. doi: 10.1016/s0731-7085(97)00062-9. [DOI] [PubMed] [Google Scholar]
- 25.Sistonen J, Fuselli S, Levo A, Sajantila A. CYP2D6 genotyping by a multiplex primer extension reaction. Clin Chem. 2005;51:1291–5. doi: 10.1373/clinchem.2004.046466. [DOI] [PubMed] [Google Scholar]
- 26.Bond A, Lader M. Use of analogue scales in rating subjective feelings. Br J Med Psychol. 1974;47:211–8. [Google Scholar]
- 27.Cogan DG. Simlified entopic pupillometer. Am J Ophthalmol. 1941;24:1431–3. [Google Scholar]
- 28.Hannington-Kiff JG. Measurement of recovery from outpatient general anaesthesia with a simple ocular test. Br Med J. 1970;3:132–5. doi: 10.1136/bmj.3.5715.132. [DOI] [PMC free article] [PubMed] [Google Scholar]
- 29.Stone BM. Pencil and paper tests – sensitivity to psychotropic drugs. Br J Clin Pharmacol. 1984;18(Suppl 1):15S–20S. doi: 10.1111/j.1365-2125.1984.tb02578.x. [DOI] [PMC free article] [PubMed] [Google Scholar]
- 30.Staahl C, Drewes AM. Experimental human pain models: a review of standardised methods for preclinical testing of analgesics. Basic Clin Pharmacol Toxicol. 2004;95:97–111. doi: 10.1111/j.1742-7843.2004.950301.x. [DOI] [PubMed] [Google Scholar]
- 31.Bertelsen KM, Venkatakrishnan K, Von Moltke LL, Obach RS, Greenblatt DJ. Apparent mechanism-based inhibition of human CYP2D6 in vitro by paroxetine: comparison with fluoxetine and quinidine. Drug Metab Dispos. 2003;31:289–93. doi: 10.1124/dmd.31.3.289. [DOI] [PubMed] [Google Scholar]
- 32.Heiskanen T, Olkkola KT, Kalso E. Effects of blocking CYP2D6 on the pharmacokinetics and pharmacodynamics of oxycodone. Clin Pharmacol Ther. 1998;64:603–11. doi: 10.1016/S0009-9236(98)90051-0. [DOI] [PubMed] [Google Scholar]
- 33.Laugesen S, Enggaard TP, Pedersen RS, Sindrup SH, Brosen K. Paroxetine, a cytochrome P450 2D6 inhibitor, diminishes the stereoselective O-demethylation and reduces the hypoalgesic effect of tramadol. Clin Pharmacol Ther. 2005;77:312–23. doi: 10.1016/j.clpt.2004.11.002. [DOI] [PubMed] [Google Scholar]
- 34.Prommer E. Oxymorphone: a review. Support Care Cancer. 2006;14:109–15. doi: 10.1007/s00520-005-0917-1. [DOI] [PubMed] [Google Scholar]
- 35.Hagelberg NM, Nieminen TH, Saari TI, Neuvonen M, Neuvonen PJ, Laine K, Olkkola KT. Voriconazole drastically increases exposure to oral oxycodone. Eur J Clin Pharmacol. 2009;65:263–71. doi: 10.1007/s00228-008-0568-5. [DOI] [PubMed] [Google Scholar]
- 36.Niwa T, Shiraga T, Takagi A. Effect of antifungal drugs on cytochrome P450 (CYP) 2C9, CYP2C19, and CYP3A4 activities in human liver microsomes. Biol Pharm Bull. 2005;28:1805–8. doi: 10.1248/bpb.28.1805. [DOI] [PubMed] [Google Scholar]
- 37.Grönlund J, Saari TI, Hagelberg NM, Martikainen IK, Neuvonen PJ, Olkkola KT, Laine K. Effect of telithromycin on the pharmacokinetics and pharmacodynamics of oral oxycodone. J Clin Pharmacol. 2010;50:101–8. doi: 10.1177/0091270009336444. [DOI] [PubMed] [Google Scholar]
- 38.File TM. Telithromycin new product overview. J Allergy Clin Immunol. 2005;115:S1–13. doi: 10.1016/j.jaci.2004.11.029. [DOI] [PubMed] [Google Scholar]
- 39.Wang EJ, Lew K, Casciano CN, Clement RP, Johnson WW. Interaction of common azole antifungals with P-glycoprotein. Antimicrob Agents Chemother. 2002;46:160–5. doi: 10.1128/AAC.46.1.160-165.2002. [DOI] [PMC free article] [PubMed] [Google Scholar]
- 40.Wandel C, Kim R, Wood M, Wood A. Interaction of morphine, fentanyl, sufentanil, alfentanil, and loperamide with the efflux drug transporter P-glycoprotein. Anesthesiology. 2002;96:913–20. doi: 10.1097/00000542-200204000-00019. [DOI] [PubMed] [Google Scholar]
- 41.Heiskanen T, Backman JT, Neuvonen M, Kontinen VK, Neuvonen PJ, Kalso E. Itraconazole, a potent inhibitor of P-glycoprotein, moderately increases plasma concentrations of oral morphine. Acta Anaesthesiol Scand. 2008;52:1319–26. doi: 10.1111/j.1399-6576.2008.01739.x. [DOI] [PubMed] [Google Scholar]
- 42.Boström E, Simonsson US, Hammarlund-Udenaes M. Oxycodone pharmacokinetics and pharmacodynamics in the rat in the presence of the P-glycoprotein inhibitor PSC833. J Pharm Sci. 2005;94:1060–6. doi: 10.1002/jps.20327. [DOI] [PubMed] [Google Scholar]
- 43.Hassan HE, Myers AL, Lee IJ, Coop A, Eddington ND. Oxycodone induces overexpression of P-glycoprotein (ABCB1) and affects paclitaxel's tissue distribution in Sprague Dawley rats. J Pharm Sci. 2007;96:2494–506. doi: 10.1002/jps.20893. [DOI] [PMC free article] [PubMed] [Google Scholar]
- 44.Schmitt JA, Riedel WJ, Vuurman EF, Kruizinga M, Ramaekers JG. Modulation of the critical flicker fusion effects of serotonin reuptake inhibitors by concomitant pupillary changes. Psychopharmacology. 2002;160:381–6. doi: 10.1007/s00213-001-0993-y. [DOI] [PubMed] [Google Scholar]
- 45.Erjavec MK, Coda BA, Nguyen Q, Donaldson G, Risler L, Shen DD. Morphine-fluoxetine interactions in healthy volunteers: analgesia and side effects. J Clin Pharmacol. 2000;40:1286–95. [PubMed] [Google Scholar]
- 46.Koltzenburg M, Pokorny R, Gasser UE, Richarz U. Differential sensitivity of three experimental pain models in detecting the analgesic effects of transdermal fentanyl and buprenorphine. Pain. 2006;126:165–74. doi: 10.1016/j.pain.2006.06.028. [DOI] [PubMed] [Google Scholar]
Associated Data
This section collects any data citations, data availability statements, or supplementary materials included in this article.