Abstract
Real-time optical registration of electrical activity in the heart allows the study of arrhythmogenic mechanisms, in particular due to global ischemia. It is known that global ischemia increases electrical heterogeneity in the heart. However, inter-ventricular differences between the right (RV) and left ventricle (LV) during ischemia and their relationship to arrhythmogenesis remains poorly understood. We used high resolution optical mapping (di-4-ANEPPS, excitation at 532nm, emission at 640±50 nm) of Langendorff-perfused rabbit hearts to quantify inter-ventricular heterogeneity in the heart during periodic pacing and ventricular fibrillation. Two fast CCD cameras were used to record electrical activity from the RV and LV during control, global ischemia (20 min), and reperfusion. Hearts were paced at progressively reduced (from 300 ms to 100 ms) basic cycle lengths and ventricular fibrillation was induced by burst pacing and recorded before the global ischemia, and after the reperfusion. The action potential durations (APD), maximum slopes of APD restitution curves (Smax), and mean dominant frequency (DF) of ventricular fibrillation were measured for both LV and RV surfaces. No APD heterogeneity was observed in control hearts. Global ischemia induced inter-ventricular heterogeneity in APDs (RV: 109±21 ms, LV: 89±23 ms; p<0.01) that was abolished upon reperfusion. However, Smax was uniformly decreased in both RV (control: 0.94±0.25, ischemia: 0.36±0.12; p<0.01) and LV (control: 0.99±0.24, ischemia: 0.43±0.21; p<0.01) and did not recover upon reperfusion. In addition, the DF of ventricular fibrillation during reperfusion decreased significantly in RV (from 8.6±1.3 Hz to 6.2±1.1 Hz; p<0.05) but remained the same in LV (9.0±0.8 Hz vs 8.5±1.0 Hz). Thus, our results demonstrate that global ischemia induces inter-ventricular heterogeneity in APD during periodic pacing. Although this effect was abolished upon reperfusion, Smax did not recover, indicating the presence of residual changes in electrical properties of the heart. Therefore, reperfusion reveals the presence of inter-ventricular heterogeneities in the dynamics of ventricular fibrillation.
I. INTRODUCTION
Cardia arrhythmias compromise the mechanical function of the heart, which is related to one of the leading causes of death in the US. One of the physiological conditions facilitating arrhythmias is ischemia resulting from reduced oxygen supply. Acute ischemia can amplify the electrical heterogeneity in the heart, and thereby contribute toward an arrhythmogenic substrate [1]. The interaction of this substrate with ectopic triggers can give rise to fatal arrhythmias such as ventricular fibrillation, which is a major cause of sudden cardiac death [2]. Previous studies have shown that during ischemia, the electrophysiological properties change more prominently in the epicardium than the endocardium [3]. This transmural asymmetry increases the risk of reentrant arrhythmias [4]. However, changes in the electrical and ionic heterogeneities between the right (RV) and the left ventricle (LV) during ischemia and their relationship to arrhythmogenesis remains poorly understood [5].
Optical mapping provides an efficient tool to study electrophysiological heterogeneity and its role in the mechanisms of arrhythmogenesis. In this paper we aim to quantify inter-ventricular heterogeneity in the heart during periodic pacing and to understand whether the inter-ventricular APD heterogeneity during ischemia plays a role in arrhythmogenesis.
II. MATERIALS AND METHODS
A. Whole-heart preparation
Animals (n = 7) were used according to National Institutes of Health guidelines. New Zealand White rabbits of either sex (2.5 to 3 kg) were injected with heparin sulfate (300 U) and anesthetized with sodium pentobarbital (75 mg/kg IV). After thoracotomy, the hearts were quickly removed and immersed in cardioplegic solution containing (mmol/L) glucose 280, KCl 13.44, NaHCO3 12.6, and mannitol 34. The aorta was quickly cannulated and retrogradely perfused with warm (36±1°C) oxygenated Tyrode’s solution under constant pressure (70 mm Hg). The Tyrode’s solution contained (mmol/L) NaCl 130, CaCl2 1.8, KCl 4, MgCl2 1.0, NaH2PO4 1.2, NaHCO3 24, and glucose 5.5 (pH 7.4 adjusted with HCl). The hearts were immersed in a transparent glass chamber and superfused with the same Tyrode’s solution; temperature was controlled (36±1°C). Hearts were rotated on the cannula to enable optical mapping of the RV and LV epicardial surfaces of the heart.
Blebbistatin (10 µmol/L) was added to the Tyrode’s solution to reduce motion artifacts. In addition, the hearts were gently pressed between the chamber wall and a sliding transparent wall during optical recordings.
Global ischemia was induced by stopping the perfusion of the heart and switching superfusion to nitrogenated Tyrode’s solution. After 20 min., the reperfusion was induced by switching back to normal conditions.
B. Optical Mapping Setup
Fluorescent membrane potential indicator (voltage-sensitive dye) Di-4-ANEPPS was used to stain the heart. A bolus of 5 mL of the dye (at concentration 10 mol/L) was injected 5 minutes before optical recordings. If necessary, the heart was restained by another bolus injection. Two diode-pumped continuous-excitation green lasers (532 nm, 1 W, SDL-532-1000T, Shanghai Dream Laser Technology Co, China) were used for excitation. Their beams were expanded by 20 mm focal distance lenses to provide uniform illumination on the RV and LV epicardial surfaces. Two fast charge-coupled device cameras (CA-D1-0128T, DALSA, Waterloo, Ontario, Canada) located on both sides of the chamber were used to record both ventricles simultaneously. 640±50 nm bandpass filter located before each camera was used to block the excitation light and pass the membrane-voltage sensitive fluorescence. Movies (5 – 8 seconds duration) were acquired at 600 frames per second, with 64×64-pixel resolution (0.4 mm per pixel). The movies were amended with time markers showing the timing of the pacing stimuli. A volume-conducted ECG was recorded.
C. Pacing Protocols
For a periodic pacing mode, a dynamic pacing protocol was used, in which the basic cycle length (BCL) was changed from 300 to 200 ms in steps of 20 ms and from 200 to 100 ms in steps of 5 ms. Two hundred stimuli were applied at each BCL to achieve a steady state. Movies were taken to capture responses to the last 10 stimuli at each BCL (steady state). We applied the pacing protocol 2 to 5 times in each heart while pacing from the RV and LV bases.
To induce ventricular fibrillation, a rapid (burst) pacing protocol was used in which 100 stimuli were applied at BCLs of 50–80 ms. Optical movies (2–3 seconds) of ventricular fibrillation were recorded.
All pacing protocols were generated using a custom program based on Labview software (National Instruments, Austin, TX). A stimulus isolator (Pulsar 6i, FHM, Brunswick, ME) was used to provide the required stimulus parameters (amplitude 0.5–2.0 mA, duration 5 ms). Hearts were paced via a silver electrode at twice the excitation threshold.
D. Electrophysiological Parameter Measurements
The processing of the recorded movies was performed offline using custom software based on PV-wave (Visual Numerics, Inc). Movies recorded during periodic pacing were ensembled - averaged to improve signal-to-noise ratio. The background fluorescence was subtracted from each frame, and spatial (5×5 pixels) and temporal (9 frames) conical convolution filters were used to increase signal-to-noise ratio. The optical action potential durations (APD) were measured in each pixel at 60% repolarization level. Further, the mean value and standard deviation (SD) were calculated for the visible RV and LV epicardial surfaces at each BCL.
Restitution curves, i.e. the dependence of APD on preceding diastolic interval (DI), were constructed at each pixel and fitted with either a polynomial (for control and reperfusion) or linear (ischemia) functions. Then the maximum slopes Smax of the restitution curves were calculated at the lowest BCL exhibiting normal (1:1) propagation. The mean and SDs of Smax were calculated for the visible RV and LV epicardial surfaces.
Optical movies of ventricular fibrillation were spatiotemporarily filtered three times (as described above) to reduce noise because fibrillation occurs at significantly lower amplitude. Fast Fourier transform was used to determine dominant frequency (DF) map in 3×3 pixel domain, as described previously [6]. Both spatial distribution map and spatial average were calculated for the visible RV and LV epicardial surfaces.
E. Statistical Analysis
Group data are presented as mean±SD. Statistical comparisons between RV and LV surfaces, and different perfusion conditions were tested using a paired 2-sample t test. Values of P<0.05 were considered statistically significant.
III. RESULTS
A. Electrical Heterogeneity
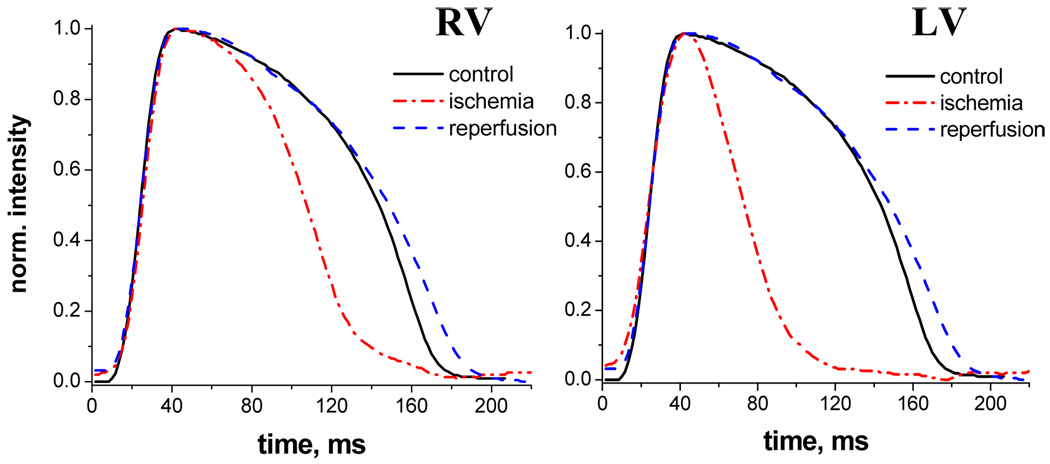
Typical traces of optical action potentials recorded from a single pixel are shown in Fig.1 for the control condition, ischemia and reperfusion. Note that ischemia shortens the APD both for RV and LV, but the effect is more pronounced for LV. Reperfusion restored the action potential profiles in both ventricles. The mean±SD of APDs from all experiments are presented in Table I for BCL=300 ms and 150 ms.
Fig. 1.
Optical action potentials recorded from a single pixel of RV and LV of isolated rabbit hearts for control condition (black), 20 min of ischemia (red), and reperfusion (blue).
TABLE I.
Mean±SD of APDs (Ms) for RV and LV during control, ischemia and reperfusion at different values of BCL
| Location, BCL | Control | Ischemia | Reperfusion |
|---|---|---|---|
| RV, BCL 300 ms | 166±23 | 109±21*x | 158±20 |
| LV, BCL 300 ms | 159±19 | 89±23*x | 143±22 |
| RV, BCL 150 ms | 96±6 | 66±10*x | 96±8 |
| LV, BCL 150 ms | 94±5 | 58±6*x | 92±5 |
RV-LV difference,
difference from both control and reperfusion
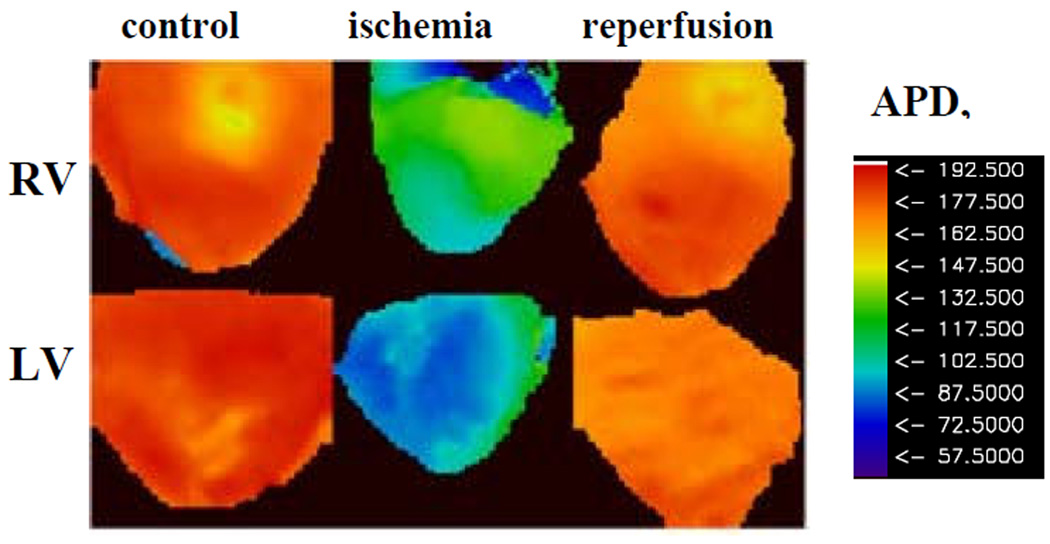
Fig. 2 illustrates APDs maps constructed for the RV and LV epicardial surfaces of the heart during periodic pacing at BCL=300 ms for the control condition, ischemia and reperfusion. Note that in the control condition, spatial distribution of APDs are similar in RV and LV indicating the absence of inter-ventricular electrical heterogeneity (p=N/S). Ischemia shortens APDs in both ventricles, but the effect is more pronounced in LV (blue color) than in RV (green color) (P<0.05, see also Table I). Thus, ischemia induces inter-ventricular heterogeneity in the heart that is abolished upon reperfusion (P=N/S between RV and LV). These effects are consistent throughout all our experiments, both for long and for short values of BCL (see Table I).
Fig. 2.
APD maps of RV and LV of isolated rabbit hearts for control condition, 20 min of ischemia, and reperfusion for BCL= 300 ms.
B. Heterogeneity of Smax
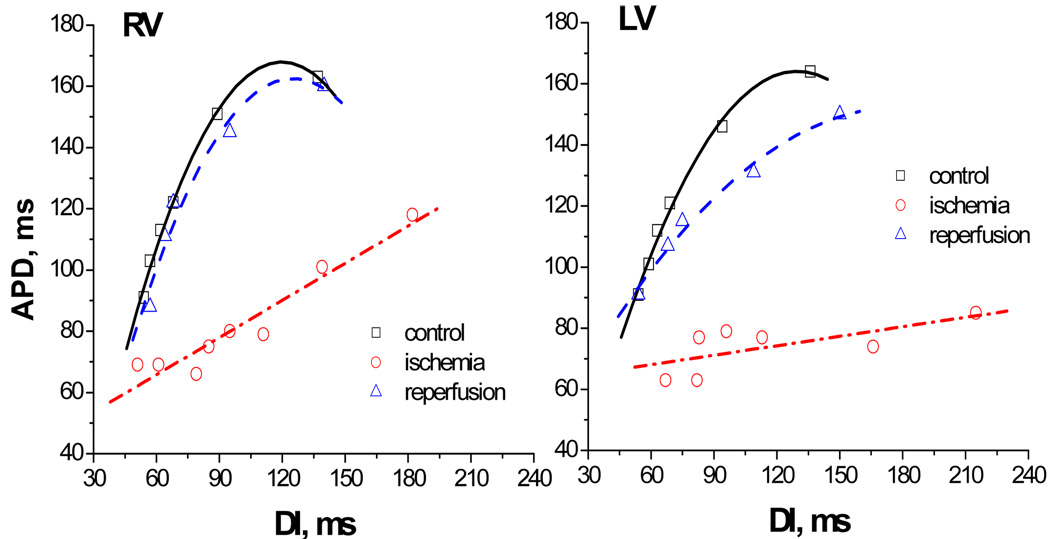
It is known that the slope of the restitution curve plays an important role in determining the dynamics of cardiac myocytes [7], being an indicator of its vulnerability to arrhythmias. In this manuscript, we aimed to reveal the effect of ischemia and reperfusion on the slope of the APD restitution. Typical examples of the restitution curves constructed for a single pixel are shown in Fig.3 for the control condition, ischemia and reperfusion. One can see that ischemia flattens the APD restitution for both ventricles and this effect is vanishes upon reperfusion.
Fig. 3.
Restitution curves constructed from a single pixel for RV and LV of isolated rabbit hearts for control condition (black), 20 min of ischemia (red), and reperfusion (blue).
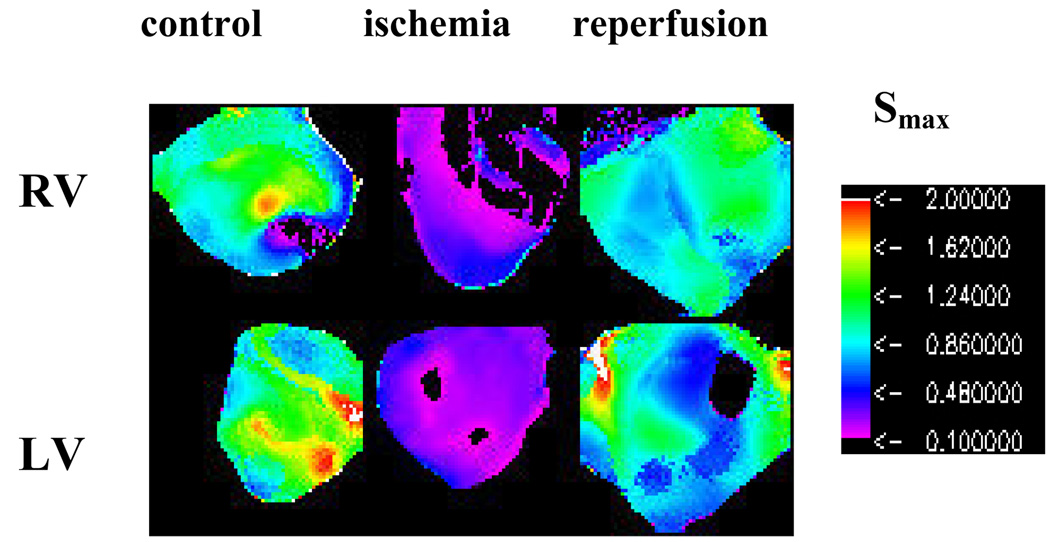
The maximum values of APD restitutions (Smax) were calculated at each pixel for visible surface of the heart at the lowest value of DI that exhibit 1:1 responses. The typical examples of spatial distribution of Smax for the RV and LV epicardial surfaces are illustrated in Fig.4 for the control condition, 20 min of ischemia and reperfusion. Note that Smax is close to or larger than 1 for both ventricles at the control condition. In this particular example, there is some spatial heterogeneity of Smax within and between RV and LV in the control, but the mean values of Smax are similar for both ventricles (P=N/S). Ischemia reduced Smax uniformly both in LV and RV (P<0.05), and thus, does not induce inter-ventricular heterogeneity in Smax. Note that reperfusion significantly increased Smax in both ventricles in comparison to the ischemic condition (P<0.05). Although Smax upon reperfusion is smaller than under the control condition for both ventricles, this difference is not statistically significant (P=N/S). The mean±SD of Smax from all experiments are presented in Table II. Thus, our results demonstrate that Smax does not display any inter-ventricular heterogeneity during ischemia despite of the presence of electrical (APD) heterogeneity.
Fig.4.
Spatial distribution of Smax for RV and LV of isolated rabbit hearts for control condition, 20 min of ischemia, and reperfusion.
TABLE II.
Mean±SD of maximum slope of APD restitution curve Smax for RV and LV during control, ischemia and reperfusion
| Location | Control | Ischemia | Reperfusion |
|---|---|---|---|
| RV | 1.26±0.31 | 0.36±0.13*x | 0.98±0.11 |
| LV | 1.2±0.34 | 0.32±0.19*x | 1.04±0.24 |
difference from control,
difference from reperfusion
C. Heterogeneity of DF
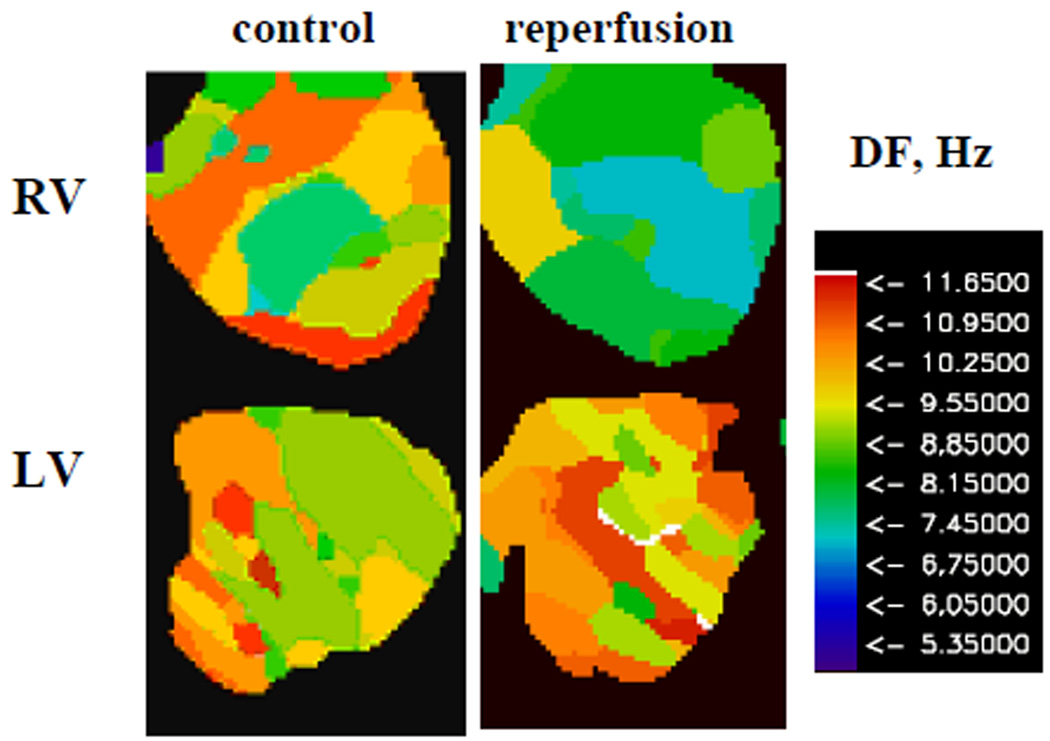
One of the aims of our study was to investigate the effect of reperfusion on the dynamics of ventricular fibrillation, which can be illustrated by changes in DF maps [6]. Fig. 5 shows typical examples of DF maps calculated for episodes of ventricular fibrillation during control conditions and after reperfusion in RV and LV of the rabbit hearts. As ventricular fibrillation is a complex spatio-temporal phenomenon, we observe a range of DFs over the epicardial ventricular surfaces for both conditions. The mean±SD of DFs from all experiments are presented in Table III. Note that mean DFs are similar in both ventricles under the control condition. However, DF significantly decreased in RV, but not in LV upon reperfusion, in comparison to the control condition. Thus, reperfusion induces inter-ventricular heterogeneity in DF during ventricular fibrillation. This result is compatible with mother motor mechanism of VF and presence of a larger outward component of IK1 in the LV than in the RV [8].
Fig. 5.
Typical example of DF maps of RV and LV of isolated rabbit hearts during ventricular fibrillation for control condition and reperfusion .
TABLE III.
Mean±SD of dominant frequency (DF) of ventricular fibrillation (Hz) for RV and LV during control and reperfusion
RV-LV difference,
difference from control
The mean±SD of DFs from all experiments are presented in Table III.
IV. DISCUSSION
We quantified the inter-ventricular heterogeneity during global ischemia and reperfusion by monitoring three electrophysiological parameters: APD, maximum slope of APD restitution (Smax), and the DF of ventricular fibrillation. There are several major new findings in this study. First, our results demonstrate that ischemia induces electrical inter-ventricular heterogeneity in the heart. Specifically, mean value of APDs in LV was significantly shorter than that in RV. This effect could be due to different contribution of transient outward potassium current, Ito, in RV and LV. The inter-ventricular electrical heterogeneity was abolished upon reperfusion. Second, we demonstrate, for the first time, that Smax was significantly reduced during ischemia in both ventricles, but no difference in Smax was observed between RV and LV. Although Smax increased upon reperfusion in both ventricles, it did not return to the control values (P=N/S). Third, we show that changes of the electrophysiological properties of the heart induced by ischemia also affect the dynamics of ventricular fibrillation. Specifically, we observe inter-ventricular heterogeneity of DF during ventricular fibrillation upon reperfusion that was not present under the control condition.
V. CONCLUSION
Global ischemia induced inter-ventricular electrical heterogeneity during periodic pacing. Although this effect was abolished upon reperfusion, Smax did not recover, indicating the presence of residual changes in electrical properties of the heart. In addition, reperfusion induces inter-ventricular heterogeneity in the heart during ventricular fibrillation.
Acknowledgments
The work was supported by NIH grants R01-HL07 1762-01A1 and R01-HL07 1635-01 (A.M and A.M.P), and AHA Scientist Development Grant 0635061N (E.G.T).
Contributor Information
Arvydas Matiukas, Department of Pharmacology, SUNY Upstate Medical University, Syracuse, NY 13210 USA (matiukaa@upstate.edu).
Arkady M. Pertsov, Department of Pharmacology, SUNY Upstate Medical University, Syracuse, NY 13210 USA (pertsova@upstate.edu)
P. Kothari, Biomedical Engineering Department, University of Minnesota, Minneapolis, MN 55455 USA (koth0039@umn.edu)
A. Cram, Biomedical Engineering Department, University of Minnesota, Minneapolis, MN 55455 USA (cramx008@umn.edu)
Elena G. Tolkacheva, Biomedical Engineering Department, University of Minnesota, 312 Church street SE, 7-112 NHH, Minneapolis, MN 55455 USA (phone: 612-626-2719; fax: 612-626-6585; talkacal@umn.edu)
REFERENCES
- 1.Janse MJ, Wit AL. Electrophysiological mechanisms of ventricular arrhythmias resulting from myocardial ischemia and infarction. Physiol. Rev. 1989 Oct;vol. 69(no.4):1049–1169. doi: 10.1152/physrev.1989.69.4.1049. [DOI] [PubMed] [Google Scholar]
- 2.Zipes DP, Wellens HJ. Sudden cardiac death. Circulation. 1998 Nov;vol. 98(no. 21):2334–2351. doi: 10.1161/01.cir.98.21.2334. [DOI] [PubMed] [Google Scholar]
- 3.Kimura S, Bassett AL, Kozlovskis PL, Myeburg RJ. Simultaneous recording of action potentials from endocardium and epicardium during ischemia in the isolated cat ventricle: relation of temporal electrophysiologic heterogeneities to arrhythmias. Circulation. 1986 Aug;vol. 74(no. 2):401–409. doi: 10.1161/01.cir.74.2.401. [DOI] [PubMed] [Google Scholar]
- 4.Wu J, Zipes DP. Transmural reentry during acute global ischemia and reperfusion in canine ventricular muscle. Am. J. Physiol. Heart Circ. Physiol. 2001 Jun;vol. 280(no. 6):H2717–H2725. doi: 10.1152/ajpheart.2001.280.6.H2717. [DOI] [PubMed] [Google Scholar]
- 5.Antzelevitch C. Role of spatial dispersion of repolarization in inherited and acquired sudden cardiac death syndromes. Am. J. Physiol. Heart Circ. Physiol. 2007 Oct;vol. 293(no. 4):H2024–H2038. doi: 10.1152/ajpheart.00355.2007. [DOI] [PMC free article] [PubMed] [Google Scholar]
- 6.Zaitsev AV, Berenfeld O, Mironov SF, Jalife J, Pertsov AM. Distribution of excitation frequencies on the epicardial and endocardial surfaces of fibrillating ventricular wall of the sheep heart. Circ. Res. 2000 Mar;vol. 86(no. 4):408–417. doi: 10.1161/01.res.86.4.408. [DOI] [PubMed] [Google Scholar]
- 7.Mironov S, Jalife J, Tolkacheva EG. Role of conduction velocity restitution and short-term memory in the development of action potential duration alternans in isolated rabbit hearts. Circulation. 2008 Jul;vol. 118(no. 1):17–25. doi: 10.1161/CIRCULATIONAHA.107.737254. [DOI] [PMC free article] [PubMed] [Google Scholar]
- 8.Samie FH, Berenfeld O, Anumonwo J, Mironov SF, Udassi S, Beaumont J, Taffet S, Pertsov AM, Jalife J. Rectification of the background potassium current: A determinant of rotor dynamics in ventricular fibrillation. Circ Res. 2001;89:1216–1223. doi: 10.1161/hh2401.100818. [DOI] [PubMed] [Google Scholar]


