

Abstract
We investigated the effect of the mitochondrial DNA (mtDNA) polymorphism G10398A found in African-American women with aggressive breast cancer on apoptosis and tumorigenesis. We generated human cytoplasmic hybrid (cybrid) by repopulation of recipient ρ0 cells (devoid of mtDNA) with donor mtDNA derived from patients with breast cancer harboring the G10398A polymorphism. We investigated a number of functional phenotypes of the G10398A cybrid. The G10398A cybrid showed a slower proliferation rate and progression through the cell cycle, as well as increased complex I activity, increased levels of reactive oxygen species and depolarized mitochondria. The G10398A cybrid also showed resistance to apoptosis triggered by etoposide. Resistance to apoptosis was mediated by Akt activation. In addition, our studies showed that the G10398A cybrid cells form an increased number of anchorage-independent colonies in vitro and metastases in mice. Together our studies suggest that the G10398A variant confers resistance to apoptosis and promotes metastasis.
Keywords: African American, Akt, apoptosis, breast cancer, cybrid, G10398A, metastasis, mitochondria
INTRODUCTION
Mitochondrial DNA (mtDNA) mutations have been associated with various types of disorders from mild myopathies to multisystem disorders.1 Somatic mtDNA mutations have been reported in cancers and are associated with the development of cancer.2–5 Similarly, inherited mtDNA polymorphisms are reported to increase the risk of breast, prostate, oral, colorectal and thyroid cancers.2,6–9
Canter et al.10 described that the G10398A polymorphism occurs at a low frequency in the African-American (AA) population; however, it was prominent among AA women with aggressive breast cancer. Darvishi et al.11 also reported that the G10398A polymorphism increased the risk of breast cancer in the Indian population. In addition, an analysis of 69 polymorphisms in European American women showed that G10398A was associated with increased breast cancer risk.12 Czarnecka et al.13 reported the abundance of the G10398A polymorphism in 23% of the Polish breast cancer population compared with 3% of controls, concluding that this polymorphism predisposed women to breast cancer. G10398A also imparts a high risk of prostate cancer in AA men8 and esophageal cancer in the Indian population.11
Position 10398 in the mtDNA is located in the gene encoding NADH dehydrogenase 3 (ND3). The G to A polymorphism in ND3 causes the substitution of alanine by threonine in amino acid 114 in the ND3 peptide.14 This amino acid substitution in the ND3 gene is hypothesized to affect protein function.10 To investigate the biological consequences of the G10398A mtDNA polymorphism, we used the trans-mitochondrial hybrid cell (cybrid) technique. Cybrid cells were generated by repopulating ρ0 cells devoid of mtDNA with mtDNA from an AA breast cancer patient containing the G10398A polymorphism. Our study suggests that the G10398A polymorphism variant alters NADH dehydrogenase activity, increases reactive oxygen species (ROS) production, confers apoptosis resistance and increases tumorigenicity in vitro and in vivo.
MATERIALS AND METHODS
Clinical samples
A total of 50 DNA samples extracted from the blood of breast cancer patients of AA origin were obtained from Data Bank BioRep, Cancer Prevention and Control Department at Roswell Park Cancer Institute (RPCI) according to Institutional Review Board (IRB) approval. Blood samples collected from an AA patient with identified G10398A polymorphism as well as from an AA healthy volunteer with G10398 were obtained with patient consent.
Identification of the G10398A polymorphism
The polymorphic site 10398 of mtDNA was analyzed by direct sequencing of PCR products. The primer pairs 5-CTCCATCTATTGATGAGGGTCTT-3 and 5-GGAAAGTCATGTCAGTGGTAGTA-3 were used for the amplification of an 845-bp DNA fragment from the ND3 gene of mtDNA. The same primers were used for sequencing to determine the 10398 nucleotide. PCR was performed in a BioRad Thermal Cycler, iCycler (Bio-Rad, Hercules, CA, USA). The reactions were carried out for 35 cycles in a 50 μl reaction mixture containing 100 ng DNA, 200 μM of each dNTP, 20 pmol of each primer, 2.5 U of Taq polymerase and 1× Taq polymerase reaction buffer (Invitrogen, Carlsbad, CA, USA). The PCR cycles consisted of 30 s denaturation at 95 °C, 30 s annealing at 58 °C and 45 s primer extension at 72 °C. All the PCR products were sequenced on an ABI PRISM 3130XL Genetic Analyzer (ABI, Foster City, CA, USA) by the RPCI DNA Sequencing Core Facility.
Cell lines and culture conditions
Cells completely depleted of mtDNA (ρ0) by a genetic method15 were grown in Dulbecco’s modified Eagle’s medium (DMEM) supplemented with 10% fetal bovine serum (FBS), and penicillin/streptomycin with the addition of 100 μg ml−1 pyruvate and 50 μg ml−1 uridine. Cybrid cell lines were generated by the fusion of ρ0 cells with platelets obtained from an AA breast cancer patient or from an AA healthy volunteer. Platelets (106 cells) were mixed with an equal number of ρ0 cells and the culture medium was carefully eliminated by centrifugation. Cells were resuspended for 1 min in 0.2 ml of sterile polyethylene–glycol 1500 (50% w/v) (Roche, Nutley, NJ, USA). After cell fusions, screening was performed by growing cells in standard DMEM for 24 h and then in selective medium composed of pyruvate- and uridine-free DMEM supplemented with 10% FBS. After 10 days, ~30 independent colonies were observed. Cybrid cells were expanded and analyzed for mtDNA protein expression (COXII).
Enzymatic measurements of respiratory enzyme activities
The mitochondria from cybrid cells were harvested from 150 cm dishes by scrapping in cold phosphate-buffered saline (PBS) and were isolated by differential centrifugation as described in the study by O’Malley et al.16 Protein concentrations were determined by the Bradford protein assay. The activities of respiratory chain complexes NADH dehydrogenase (complex I), succinate dehydrogenase (complex II), coenzyme Q-cytochrome c reductase (complex III) and cytochrome c oxidase (complex IV) were measured spectrophotometrically according to the methods described by Birch-Machin et al.17 ATP synthase (complex V) activity was measured according to the methods described by Buchet and Godinot,18 and Pullman et al.19 All spectrophotometric measurements were performed in 1 ml cuvettes (1 cm) using a Thermo-Spectronic Genesis-6 spectrophotometer (Thermo Scientific, Waltham, MA, USA). In all, 20–50 μg of cybrid mitochondria was used for each enzyme assay. Complex activity is expressed as a ratio to control the G10398 cybrid for each individual respiratory chain complex.
Analysis of proliferation and cell cycle
The MTT assay was performed by a routine method. For each cell line, 12 wells of the 96-well microplate were used. Cells were plated at a density of 5000 cells per well in 200 μl of media. After 24 h and subsequent time points, 10 μl of MTT stock solution (5 mg of MTT per ml of PBS) was placed in each well. After 3 h incubation, DMSO (dimethyl sulfoxide) was added to dissolve formazan crystals. The optical density of samples was measured immediately using a Microplate Spectrophotometer (Bio-Tek Instruments, Winooski, VT, USA) at a wavelength of 560 nm. Cell cycle analysis was performed according to the method used by Krishan20 with slight modifications. Both attached and floating cells were harvested fixed, permeabilized and stained with Krishan’s buffer (0.1% sodium citrate, 50 μg ml−1 propidium iodide (PI), 20 μg ml−1 RNase A, 0.5% NP40). PI is a DNA intercalating fluorescent dye that excites at 488 nm. To quantify cell distributions, cells were read on a FACscan flow cytometer (Becton Dickinson, Franklin Lakes, NJ, USA) and histograms were analyzed using ModFit LT (Verity Software House, Topsham, ME, USA).
Measurement of ROS production
Analysis of ROS production was conducted as described in the study by Desouki et al.21 Intracellular ROS was detected using two oxidation-sensitive fluorescent probe dyes, 2′,7′-dichlorodihydrofluorescein diacetate (CMH2 DCFDA) (Molecular Probes, Eugene, OR, USA) and dihydroethidium (DHE) (Molecular Probes). In brief, trypsinized cells were washed in Hank’s buffered salt solution and incubated with 20 μM CMH2DCFDA or 5 μM DHE at 37 °C for 30 min according to the manufacturer’s instructions. Oxidation of the dyes was detected on an FACSCalibur flow cytometer (Becton Dickinson), and the results were analyzed using WinList software (Verity Software House).
Measurement of mitochondrial membrane potential
Cellular ΔΨm was determined using a fluorescent cationic dye, 5,50,6,60-tetrachloro-1,10,3,30-tetraethylbenzamidazolocarbocyanin iodide (JC-1; Molecular Probes), according to the manufacturer’s instructions. In brief, cells were trypsinized, washed twice with PBS and incubated with 2.5 μg ml−1 JC-1 at 37 °C for 30 min. JC-1 intensity was determined on an FACSCalibur flow cytometer (Becton Dickinson). The changes in ΔΨm were measured with the levels of MFI, with a 485-nm excitation filter and a 525–595 nm emission filter. Depolarization of mitochondrial membrane potential (ΔΨm) results in the lower ratio of JC-1 oligomers to monomers.
Detection of apoptosis
Apoptosis was determined by staining cells with annexin V-fluorescein isothiocyanate (FITC) and PI labeling (PharMingen, San Diego, CA, USA). Annexin V binds to translocated phosphatidylserine during the progression of apoptosis and can therefore detect cells early in apoptosis. Staining was performed according to the manufacturer’s instructions. Briefly, floating and trypsinized cells were collected and washed twice with cold PBS and resuspended in 500 μl of binding buffer (10 mM HEPES/NaOH pH 7.4, 140 mM NaCl, 2.5 mM CaCl2) at a concentration of 1×10⁶ cells per ml. A volume of 5 μl of annexin V-FITC and PI (1 μg ml−1) was then added to these cells, which were analyzed using a flow cytometer. Viable cells were negative for both PI and annexin V; apoptotic cells were positive for annexin V and negative for PI, whereas late apoptotic dead cells displayed both high annexin V and PI labeling. Non-viable cells, which underwent necrosis, were positive for PI and negative for annexin V. Apoptosis was induced in cybrid cell lines by pretreatment with 12.5 or 25 μM etoposide (Sigma, St Louis, MO, USA) for 24 h. Inhibition of Akt phosphorylation was achieved by 48 h treatment with either 25 or 50 μM LY249002.
Activation of caspase-3/7 was measured using the Caspase-Glo 3/7 Assay (Promega, Madison, WI, USA) according to the manufacturer’s instructions. This luminescent assay measures caspase-3 and caspase-7 activities in purified enzyme preparations. DEVD (Asp-Glu-Val-Asp) substrate is cleaved to release aminoluciferin, a substrate of luciferase. The luminescence of each sample was measured in a SpectraMax M2e microplate reader (Molecular Devices, Sunnyvale, CA, USA).
Activation of caspase-3 was assayed by flow cytometry with an FITC-conjugated monoclonal rabbit anti-active caspase-3 antibody C92-605 (BD Pharmingen, Franklin Lakes, NJ, USA). Briefly, cells were washed once with PBS, sequentially fixed with 2% (w/v) paraformaldehyde and ice-cold methanol, permeabilized with TBST containing 0.1% Triton X-100 (Sigma) and pelleted and washed in PBS. Unspecific binding was prevented by incubation in TBST containing 15% FBS after staining with an FITC-conjugated rabbit anti-active caspase-3 monoclonal antibody. For each sample, 10 000 events were collected by a flow cytometer and analyzed using the WinList software.
Western blot analysis
Cells were lysed in RIPA lysis buffer (50 mM Tris pH 7.4, 150 mM NaCl, 1 mM PMSF (phenylmethanesulfonyl fluoride), 1 mM EDTA (ethylenediaminetetraacetic acid), 1% Triton X-100, 1% sodium deoxycholate and 0.1% SDS) with the addition of Protease Inhibitor Cocktail (Roche) and Phosphatase Inhibitor Cocktail I (Sigma). Immunoblot analysis of protein extracts was performed as described in the study by Desouki et al.21 The antibodies used were as follows: anti-CoxII antibody (Molecular Probes), anti-Akt total and Aktser473 antibodies (Cell Signaling Technology, Beverly, MA, USA) and peroxidase-labeled anti-rabbit IgG (H+L) secondary antibody (Vector Laboratories, Burlingame, CA, USA). Anti-bovine α-tubulin antibody (Molecular Probes) was used to assess equal protein loading. The 7.2 μg ml−1 of premixed cocktail containing five monoclonal antibodies against subunits of OXPHOS complexes MS601 MitoProfile Human Total OXPHOS Complexes Detection Kit (Mitosciences, Eugene, OR, USA) was used to detect a representative subunit from all five OXPHOS complexes.
Analysis of in vitro tumorigenic phenotype: soft agar assay and Matrigel invasion assay
Soft agar and Matrigel invasion assays were performed as described previously by Singh et al.22 and Desouki et al.21
Measurement of metastatic potential by tail vein assay in SCID mice
Experimental metastatic potential was tested using a tail vein assay. All animal experiments were carried out with the approval of IACUC of RPCI at Buffalo, NY. Female severe combined immunodeficient (SCID) mice, 6–8 weeks old, were obtained from the Department of Laboratory Animal Resources. Cybrid cells were prepared for injection from cultures in logarithmic growth at the time of harvest. The cells were briefly treated with 0.025% trypsin, collected by centrifugation, resuspended in PBS and injected (0.5×10⁶ cells per 200 μl PBS) into the lateral tail vein with a 26-gauge needle. The mice were maintained under aseptic barrier conditions until the end time point of the experiment. After 30 days, one mouse from each group was killed and their lungs were removed, stained with Indian ink and examined using a stereomicroscope for metastatic foci. After another 15 days, the remaining mice were killed, and their lungs, spleens, livers, kidneys and bones were harvested and fixed in 10% (v/v) formalin. The fixed organ samples were embedded in paraffin, sectioned and stained with hematoxylin and eosin for histopathological evaluation to identify micrometastatic foci.
RESULTS
Generation and confirmation of the G10398A trans-mitochondrial cybrid cell line
We analyzed mtDNA from AA women with breast cancer enrolled at the RPCI. We identified the 10398A allele in 3 out of 50 breast cancer patients, but not in the healthy woman volunteer of AA origin (control). Figure 1a (bottom) showed the presence of allele A at position 10398 in mtDNA from a breast cancer patient of AA origin. Blood samples were collected from G10398A patients with the proper consent and approval of the IRB committee. Platelets containing G10398A mtDNA were separated from serum by centrifugation and were fused with the ρ0 recipient cell line.15 Post-fusion cells were cultured in the media without uridine and single clones were selected by ring cloning. The authenticity of the G10398A cybrid was confirmed by DNA resequencing and western blot analysis of Cox II expression to measure the level of mtDNA-encoded proteins. The wild-type cybrid (G10398) was generated in the same manner (Figure 1b).
Figure 1.
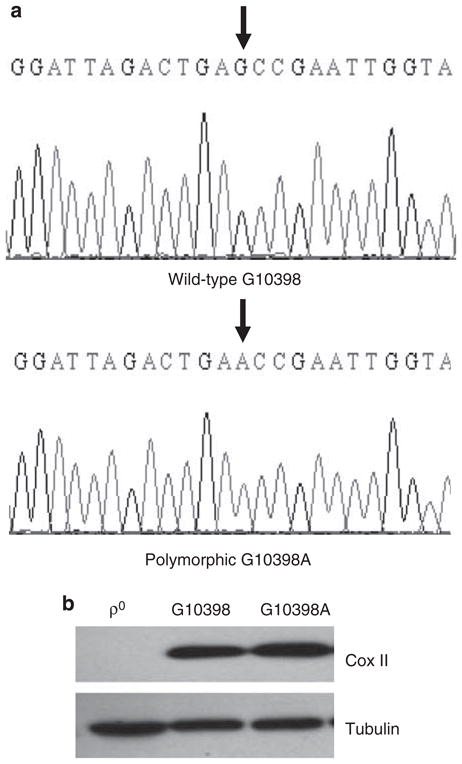
Identification of cybrid cell lines harboring G10398 and the G10398A variant in mitochondrial DNA (mtDNA). (a) Examples of chromatograms from G10398A single-nucleotide polymorphism (SNP). A ‘G’ is present at position 10398 of NADH dehydrogenase 3 (ND3) in healthy volunteer sequence (upper panel), whereas an ‘A’ is present in the breast cancer patient sequence (lower panel). Both individuals are of African-American origin. The sequences shown are of the complementary strand. Arrows show the single nucleotide of interest. (b) Repopulation of recipient ρ0 cells with the mitochondria from donors: platelets containing mtDNA harboring G10398A and wild-type G10398 resulted in restoration of expression of COXII protein, whereas in ρ0 cells this protein is absent. A full color version of this figure is available at the Journal of Human Genetics journal online.
G10398A variant induces cell cycle delay and decreases mitochondrial membrane potential
We measured the influence of the G10398A polymorphism on cell proliferation and cell cycle distribution. Our study showed a lower rate of proliferation in the case of the G10398A cybrid compared with the wild-type control (G10398) cybrid (Figure 2a). Next, we analyzed the cell cycle pattern in cybrid cell lines. Figure 2b shows that G10398A cybrids have altered cell cycle distribution compared with G10398 cybrids. The G10398A cybrid has an increased accumulation in G1 and a decreased percentage in the G2/M phase. We conclude that the G10398A polymorphism influences cell proliferation and cell cycle distribution.
Figure 2.

Growth of cybrid cell lines harboring G10398 and the G10398A variant in mitochondrial DNA (mtDNA). (a) Assessment of cell proliferation rate by MTT assay. G10398A cybrid shows a decreased growth rate compared with wild-type control. (b) Altered cell cycle distribution in the G10398A cybrid. Percentages of cells in subsequent phases of the cell cycle are presented. The G2/M phase in the G10398A cybrid is significantly shorter. (c) Reactive oxygen species (ROS) production analysis in cybrid cell lines. ROS production was measured using two probes: CMH2DCFDA (left panel) and dihydroethidium (DHE) (right panel). Representative histograms of five independent assays are depicted. (d) JC-1 measurement of inner mitochondrial membrane potential (ΔΨm). JC-1 analysis revealed cells having mitochondria with low membrane potential in G10398A cybrid cells (lower panel), whereas G10398 cybrid cells contain mostly mitochondria with high membrane potential (upper panel).
The mtDNA G10398A polymorphism results in amino acid substitution of alanine (encoded by the G allele) by threonine (encoded by the A allele) within the NADH dehydrogenase (ND3) subunit of complex I. The G10398A polymorphism is hypothesized to alter the structure of complex I resulting in increased ROS generation at this site.9 We therefore measured ROS production by flow cytometry using CM-H2DCFDA and DHE probes. No difference was found in the oxidation of the CM-H2DCFDA probe; however, oxidation of DHE was greatly increased, indicating an increase in intracellular ROS in the G10398A cybrid (Figure 2c).
Inner mitochondrial membrane potential (Δψm) is generated by the mitochondrial electron transport chain, which drives proton translocation from the matrix through the inner mitochondrial membrane to the intermembrane space, thus creating an electrochemical gradient. We used JC-1 staining to detect alterations in Δψm.23 We observed an increase in JC-1 monomers in cybrid harboring the G10398A polymorphism, indicating the presence of depolarized mitochondria (Figure 2d). These studies suggest that the G10398A variant increased ROS and decreased the mitochondrial membrane potential.
G10398A variant effects OXPHOS activity
To identify an underlying cause of increased ROS in the G10398A cybrid, we performed an expression analysis of representative subunits of OXPHOS complexes. Interestingly, the G10398A cybrid showed a noticeable increase in expression of the 20-kDa subunit of complex I, 48.5-kDa core and 2-kDa subunit of complex III and 25.6-kDa Cox II subunit of complex IV in the G10398A cybrid (Figure 3a).
Figure 3.

Analysis of expression and enzymatic activities of OXPHOS in cybrid cell lines. (a) Western blot analysis of representative subunits from all OXPHOS complexes in cybrid cell lines. Each line contains 40 μg of total protein lysate from individual cybrid cell lines. Bands from the top represent: 59.8-kDa F1α subunit of complex V; 48.5-kDa core 2 subunit of complex III; 31.5-kDa Ip subunit of complex II; 25.6-kDa COXII subunit of complex IV and 20-kDa NDUFB8 subunit of complex I. As a control, 1 μg of Human Heart Mitochondria was used in the first lane. Ponceau S stained blot serves as a loading control. (b) Analysis of enzymatic activities of OXPHOS in cybrid cell lines. Individual complexes activities were measured in mitochondrial isolates and are normalized to G10398 cybrid activity. Error bars represent s.d.
Alteration in the expression of representative subunits of OXPHOS complexes may consequently alter their activities. Therefore, we measured activities of OXPHOS complexes I–V using the mitochondria isolated from G10398A and the wild-type cybrid. Significant differences were found in the activity of complex I, which was three times higher in the G10398A cybrid when compared with the wild-type cybrid (Figure 3b). It is noteworthy that the other OXPHOS (complexes II–V) activities were similar to wild type. We conclude that the G10398A variant affects complex I activity.
G10398A contributes to apoptosis resistance
Resistance to apoptosis is one of the hallmarks of transformed cell phenotype. To test the response of the cybrid cell line to apoptotic stimuli, we treated cybrid cell lines with etoposide. We quantitated apoptotic cell death from etoposide treatment by annexin V-FITC staining and flow cytometry. Cybrid cells were treated with 12.5 and 25 μM of etoposide for 24 h, harvested by trypsinization and stained with anti-Annexin V-FITC antibody. PI was used as a standard flow cytometric viability dye. Cells that stain positive for annexin V-FITC and negative for PI are undergoing apoptosis. Figure 4a shows that baseline levels of annexin V-positive cells are lower in G10398A cells. Furthermore, etoposide treatment of G10398 cells induced apoptosis, whereas G10398A cells did not show a noticeable increase in annexin V-positive cells. Next, we measured caspase-3 activity, a key protease that is activated during the early stages of apoptosis.24 First, we used a pro-luminescence caspase 3–7 substrate containing the tetrapeptide sequence DEVD (Asp-Glu-Val-Asp), which is cleaved to release aminoluciferin, a luciferase substrate. Figure 4b shows a significantly lower amount of caspase 3–7 activity in G10398A cybrid cells when compared with wild-type cybrid. As an additional quantitative estimation of apoptosis, we used an anti-active caspase-3 antibody staining to measure the activation of caspase-3 after treatment with etoposide. Cybrid cells were prepared as described in the ‘Materials and methods’ section, stained with FITC-conjugated anti-active caspase-3 antibody and analyzed by flow cytometry. Figure 4c shows markedly less active caspase-3-FITC-positive cells following treatment with 12.5 μM of etoposide (6.12 and 37.74% in G10398A and G10398 cybrids, respectively) and 25 μM of etoposide (4.38 and 39.44%, respectively). Taken together, these studies suggest that G10398A confers resistance to apoptosis induced by etoposide.
Figure 4.

Resistance to apoptosis induced by etoposide in the G10398A cybrid. (a) Annexin V-propidium iodide (PI) staining of cybrid cells after exposure to 12.5 and 25 μM of etoposide for 24 h. The percentages of annexin V-positive/PI-negative cells representing early apoptosis are depicted. Error bars represent s.d., *P<0.05 compared with the G10398 cybrid of the same treatment. (b) Assessment of caspase-3/7 activity in whole (living) cybrid cells. Caspase-3/7 activity is represented as normalized luminescence proportional to DEVD substrate cleavage by active caspase-3/7. The activity of caspase-3/7 is lower in G10398A cybrid. Error bars represent s.d. (c) Detection of apoptosis using monoclonal antibody against the active form of caspase-3. Cybrid cells were incubated with either no additions or etoposide, and labeled with fluorescein isothiocyanate (FITC)-conjugated anti-active caspase-3. Percentages of cells showing active caspase-3 (M2) are indicated on each histogram. A representative experiment is shown. The caspase-3 activity is decreased in G10398A cybrid. All assays were repeated thrice.
Akt is constitutively phosphorylated in the G10398A cybrid
One of the major pathways involved in apoptosis resistance is mediated by the phosphoinositide 3-kinase (PI3K)-Akt.25 Akt is activated by phosphorylation within the carboxy terminus serine 473 (Ser473). We tested Aktser473 and Akt by western blot analysis. As shown in Figure 5a, Akt phosphorylation at Ser473 increased in the G10398A cybrid; however, the total Akt protein was not altered in both cybrid cell lines.
Figure 5.

Effect of mutant mitochondrial DNA (mtDNA) on Akt phosphorylation and activity. (a) Akt is constitutively phosphorylated at Ser473 in the G10398A cybrid. Cell lysates (50 μg per lane) were probed for Ser473 phosphorylated Akt and analyzed by western blot. (b) Dose response of Akt phosphorylation by the PI3K inhibitor LY294002 in cybrid cell lines. (c) Apoptosis response of cybrid cells pretreated with LY294002 (50 μM for 48 h) after etoposide (25 μM for 24 h) by flow cytometry analysis of annexin V-propidium iodide (PI) staining. Assay was repeated thrice. Error bars represent s.d., ***P<0.0005 compared with untreated.
Next, we sought to evaluate the contribution of Akt phosphorylation in resistance to etoposide-induced cell death. LY249002, an inhibitor of the PI3K-Akt pathway, caused a decrease in Akt phosphorylation at Ser473 (Figure 5b). Although pretreatment with LY249002 sensitized both cybrid cell lines to etoposide, as shown by increased annexin V binding (Figure 5c), the G10398A cybrid remained resistant to apoptotic stimuli when compared with wild type. We conclude that phosphorylation of Akt is one of the pathways that protects the G10398A cybrid from apoptosis.
G10398A induced increased in vitro and in vivo tumorigenicity in mice
We used the in vitro soft agar assay to access the anchorage dependence of cybrid cell lines. As presented in Figure 6a, the G10398A cybrid formed four times more colonies in soft agar when compared with G10398. Analysis of invasiveness showed a significantly lower number of cells invading through the Matrigel membrane in the G10398A cybrid (Figure 6b). To compare the G10398A and wild-type cybrids in terms of their potential to metastasize in vivo, 0.5×10⁶ cells were injected into the tail vein of SCID mice. We observed differences in lung metastatic foci formation in the G10398A cybrid compared with the wild-type mice group. Overall, 66% of mice (4/6) injected with the G10398A cybrid cells had metastatic foci, whereas 40% mice from wild-type control developed foci (2/5) (Figure 6c).
Figure 6.

The G10398A variant confers tumorigenic potential in cybrid. (a) Soft agar colony formation assay. The G10398A cybrid has significantly higher anchorage-independent growth ability compared with wild type. Representative images of wells with colonies formed in the soft agar medium are shown. Assay was repeated thrice. Error bars represent s.d. (b) Matrigel invasion assay. The ability of cells to invade through the Matrigel membrane is significantly lower in the G10298A cybrid. Representative images of cells invaded through the Matrigel membrane are shown (×200). Assay was repeated four times. Error bars represent s.d., ***P<0.0005. (c) Representative images (×200) show the hematoxylin and eosin (H&E) staining of lung metastasis of the G10398A (left) and G10398 (right) cybrids. A full color version of this figure is available at the Journal of Human Genetics journal online.
DISCUSSION
We generated a trans-mitochondrial cybrid cell lines containing mtDNA either from an AA breast cancer patient harboring a G to A polymorphism at position 10398 of mtDNA or from a healthy AA woman with a G allele at position 10398. Both cybrid cell lines contain an isogenic nuclear background. The ρ0 cells used for a trans-mitochondrial cybrid were generated by a genetic method;15 therefore, the cell line was not affected by chemical treatment generally used for depleting mtDNA (ρ0). This method allowed us to investigate the effect of the A allele on the cell phenotype of the cybrid containing mtDNA of AA origin in an isogenic background. The G10398A cybrid proliferated significantly slower when compared with the wild-type G10398 cybrid. The G10398A cybrid also showed increased G1-phase accumulation and a decrease in the G2/M phase. Previous studies in our laboratory have shown that the inhibition of mitochondrial metabolism induces cell cycle delay.26–28 This cell cycle delay seems to be part of a mitocheckpoint response to mitochondrial defects.28 Other laboratories have also reported a G1/S phase arrest in response to mitochondrial dysfunction.29
Analysis of DHE oxidation showed that the levels of ROS are increased in the G10398A cybrid. The rate of superoxide production can be increased when electron flow slows down in the OXPHOS complexes. Indeed, our study shows that the level of the 20-kDa subunit of complex I is increased in the G10308A cybrid. Consequently, complex I activity in the G10398A cybrid was higher when compared with wild type. With an increase in complex I activity and no increase in complex III activity, the electron transport chain may be in a more reduced state, thus increasing the residence times of electrons and providing more opportunity for univalent reduction of oxygen, as complexes I and III are the major sources of ROS in cells.30,31 We also observed low mitochondrial membrane potential in the G10398A cybrid. Interestingly, low mitochondrial membrane potential in the G10398A cybrid has also been reported by another laboratory.32
G10398A cybrid cells showed significant resistance to etoposide. We observed similar apoptosis resistance in ρ0 cells entirely lacking mtDNA.33 One proposed method of apoptosis resistance in G10398A cells is through the upregulation of the Akt pathway. Akt regulates growth and survival in normal and cancer cells. In this study, we examined the possible role of Akt on the inhibition of etoposide-induced apoptosis in G10398A cybrid. We found constitutive activation of Akt in cells containing the G10398A polymorphism. LY294002, an inhibitor of the PI-3 kinase, reduced Akt phosphorylation (Figure 5b) and partially sensitized G10398A cybrid cells to etoposide-induced apoptotic cell death (Figure 5c), suggesting that the Akt pathway is one of the apoptotic resistance pathways in G10398A cybrid cells.
The tumorigenic properties of the G10398A cybrid were analyzed by anchorage-independent growth in soft agar, in vitro Matrigel invasion and in vivo metastasis. Our study suggests that activation of the Akt pathway is involved in increased anchorage-independent growth and the tumorigenic potential of the G10398A cybrid. We studied the invasiveness of cybrid cell lines using the in vitro Matrigel chamber. Interestingly, we noticed a significant decrease in the ability of the G10398A cybrid to invade through the Matrigel membrane when compared with wild-type cybrid (Figure 6b). A similar effect has been reported previously in which activation of Akt inhibits invasion of MDA-MB-435, MDA-MB-231 and SUM-159-PT cell lines through the Matrigel membrane.34 Although invasion of the basement membrane is considered an early stage of metastasis, establishment of micro-metastatic foci is a late event in metastatic progression. It has long been known that highly metastatic cells have increased resistance to apoptosis.35 In addition, the activation of Akt by phosphorylation at Ser473 has a role in a number of events in the metastatic pathway.36
The apoptosis resistance of the G10398A cybrid may impart a selective advantage that allows establishment and growth in the lungs. In summary, our data suggest a possible apoptosis resistance-mediated mechanism for an increase in invasive breast cancer in AA women with the G10398A polymorphism.
Acknowledgments
This work was supported by an NIH grant RO1 CA12194 (to KKS). It was also supported in part by the National Cancer Institute Support Grant CA16056 awarded to the Roswell Park Cancer Institute. We thank Dr Andrei Bakin, Dr Alfyia Safina and Dr MingQiang Ren for help with animal experiments. We thank Ms Paula Jones for editing this paper.
References
- 1.Schapira AH. Mitochondrial disease. Lancet. 2006;368:70–82. doi: 10.1016/S0140-6736(06)68970-8. [DOI] [PubMed] [Google Scholar]
- 2.Singh KK, Kulawiec M. Mitochondrial DNA polymorphism and risk of cancer. Methods Mol Biol. 2009;471:291–303. doi: 10.1007/978-1-59745-416-2_15. [DOI] [PMC free article] [PubMed] [Google Scholar]
- 3.Modica-Napolitano JS, Singh KK. Mitochondrial dysfunction in cancer. Mitochondrion. 2004;4:755–762. doi: 10.1016/j.mito.2004.07.027. [DOI] [PubMed] [Google Scholar]
- 4.Owens KM, Modica-Napolitano JS, Singh K. In: Mitochondria and Cancer. Singh KK, Costello L, editors. Springer; New York: 2009. pp. 1–21. [Google Scholar]
- 5.Kulawiec M, Owens KM, Singh KK. Cancer cell mitochondria confer apoptosis resistance and promote metastasis. Cancer Biol Ther. 2009;8:69–76. doi: 10.4161/cbt.8.14.8751. [DOI] [PubMed] [Google Scholar]
- 6.Aikhionbare FO, Khan M, Carey D, Okoli J, Go R. Is cumulative frequency of mitochondrial DNA variants a biomarker for colorectal tumor progression? Mol Cancer. 2004;3:30–34. doi: 10.1186/1476-4598-3-30. [DOI] [PMC free article] [PubMed] [Google Scholar]
- 7.Datta S, Majumder M, Biswas NK, Sikdar N, Roy B. Increased risk of oral cancer in relation to common Indian mitochondrial polymorphisms and autosomal GSTP1 locus. Cancer. 2007;110:1991–1999. doi: 10.1002/cncr.23016. [DOI] [PubMed] [Google Scholar]
- 8.Mims MP, Hayes TG, Zheng S, Leal SM, Frolov A, Ittmann MM, et al. Mitochondrial DNA G10398A polymorphism and invasive breast cancer in African-American women. Cancer Res. 2006;66:1880–1881. doi: 10.1158/0008-5472.CAN-05-3774. [DOI] [PMC free article] [PubMed] [Google Scholar]
- 9.Yeh JJ, Lunetta KL, van Orsouw NJ, Moore FD, Jr, Mutter GL, Vijg J, et al. Somatic mitochondrial DNA (mtDNA) mutations in papillary thyroid carcinomas and differential mtDNA sequence variants in cases with thyroid tumours. Oncogene. 2000;19:2060–2066. doi: 10.1038/sj.onc.1203537. [DOI] [PubMed] [Google Scholar]
- 10.Canter JA, Kallianpur AR, Parl FF, Millikan RC. Mitochondrial DNA G10398A polymorphism and invasive breast cancer in African-American women. Cancer Res. 2005;65:8028–8033. doi: 10.1158/0008-5472.CAN-05-1428. [DOI] [PubMed] [Google Scholar]
- 11.Darvishi K, Sharma S, Bhat AK, Rai E, Bamezai RN. Mitochondrial DNA G10398A polymorphism imparts maternal Haplogroup N a risk for breast and esophageal cancer. Cancer Lett. 2007;249:249–255. doi: 10.1016/j.canlet.2006.09.005. [DOI] [PubMed] [Google Scholar]
- 12.Bai RK, Leal SM, Covarrubias D, Liu A, Wong LJ. Mitochondrial genetic background modifies breast cancer risk. Cancer Res. 2007;67:4687–4694. doi: 10.1158/0008-5472.CAN-06-3554. [DOI] [PubMed] [Google Scholar]
- 13.Czarnecka AM, Krawczyk T, Zdrozny M, Lubinski J, Arnold RS, Kukwa W, et al. Mitochondrial NADH-dehydrogenase subunit 3 (ND3) polymorphism (A10398G) and sporadic breast cancer in Poland. Breast Cancer Res Treat. 2009 doi: 10.1007/s10549-009-0358-5. e-pub ahead of print. [DOI] [PubMed] [Google Scholar]
- 14.van der Walt JM, Martin ER, Scott WK, Zhang F, Nance MA, Watts RL, et al. Genetic polymorphisms of the N-acetyltransferase genes and risk of Parkinson’s disease. Neurology. 2003;60:1189–1191. doi: 10.1212/01.wnl.0000055929.84668.9a. [DOI] [PubMed] [Google Scholar]
- 15.Saffran HA, Pare JM, Corcoran JA, Weller SK, Smiley JR. Herpes simplex virus eliminates host mitochondrial DNA. EMBO Rep. 2007;8:188–193. doi: 10.1038/sj.embor.7400878. [DOI] [PMC free article] [PubMed] [Google Scholar]
- 16.O’Malley Y, Fink BD, Ross NC, Prisinzano TE, Sivitz WI. Reactive oxygen and targeted antioxidant administration in endothelial cell mitochondria. J Biol Chem. 2006;281:39766–39775. doi: 10.1074/jbc.M608268200. [DOI] [PubMed] [Google Scholar]
- 17.Birch-Machin MA, Briggs HL, Saborido AA, Bindoff LA, Turnbull DM. An evaluation of the measurement of the activities of complexes I–IV in the respiratory chain of human skeletal muscle mitochondria. Biochem Med Metab Biol. 1994;51:35–42. doi: 10.1006/bmmb.1994.1004. [DOI] [PubMed] [Google Scholar]
- 18.Buchet K, Godinot C. Functional F1-ATPase essential in maintaining growth and membrane potential of human mitochondrial DNA-depleted rho degrees cells. J Biol Chem. 1998;273:22983–22989. doi: 10.1074/jbc.273.36.22983. [DOI] [PubMed] [Google Scholar]
- 19.Pullman ME, Penefsky HS, Datta A, Racker E. Partial resolution of the enzymes catalyzing oxidative phosphorylation. I. Purification and properties of soluble dinitrophenol-stimulated adenosine triphosphatase. J Biol Chem. 1960;235:3322–3329. [PubMed] [Google Scholar]
- 20.Krishan A. Rapid flow cytofluorometric analysis of mammalian cell cycle by propidium iodide staining. J Cell Biol. 1975;66:188–193. doi: 10.1083/jcb.66.1.188. [DOI] [PMC free article] [PubMed] [Google Scholar]
- 21.Desouki MM, Kulawiec M, Bansal S, Das GM, Singh KK. Cross talk between mitochondria and superoxide generating NADPH oxidase in breast and ovarian tumors. Cancer Biol Ther. 2005;4:1367–1373. doi: 10.4161/cbt.4.12.2233. [DOI] [PubMed] [Google Scholar]
- 22.Singh KK, Kulawiec M, Still I, Desouki MM, Geradts J, Matsui S. Inter-genomic cross talk between mitochondria and the nucleus plays an important role in tumorigenesis. Gene. 2005;354:140–146. doi: 10.1016/j.gene.2005.03.027. [DOI] [PubMed] [Google Scholar]
- 23.Garner DL, Thomas CA. Organelle-specific probe JC-1 identifies membrane potential differences in the mitochondrial function of bovine sperm. Mol Reprod Dev. 1999;53:222–229. doi: 10.1002/(SICI)1098-2795(199906)53:2<222::AID-MRD11>3.0.CO;2-L. [DOI] [PubMed] [Google Scholar]
- 24.Dai C, Krantz SB. Interferon gamma induces upregulation and activation of caspases 1, 3, and 8 to produce apoptosis in human erythroid progenitor cells. Blood. 1999;93:3309–3316. [PubMed] [Google Scholar]
- 25.Osaki M, Oshimura M, Ito H. PI3K-Akt pathway: its functions and alterations in human cancer. Apoptosis. 2004;9:667–676. doi: 10.1023/B:APPT.0000045801.15585.dd. [DOI] [PubMed] [Google Scholar]
- 26.Desler C, Munch-Petersen B, Stevnsner T, Matsui S, Kulawiec M, Singh KK, et al. Mitochondria as determinant of nucleotide pools and chromosomal stability. Mutat Res. 2007;625:112–124. doi: 10.1016/j.mrfmmm.2007.06.002. [DOI] [PubMed] [Google Scholar]
- 27.Park SY, Choi B, Cheon H, Pak YK, Kulawiec M, Singh KK, et al. Cellular aging of mitochondrial DNA-depleted cells. Biochem Biophys Res Commun. 2004;325:1399–1405. doi: 10.1016/j.bbrc.2004.10.182. [DOI] [PubMed] [Google Scholar]
- 28.Kulawiec M, Ayyasamy V, Singh KK. p53 regulates mtDNA copy number and mitocheckpoint pathway. J Carcin. 2009;8:8. doi: 10.4103/1477-3163.50893. [DOI] [PMC free article] [PubMed] [Google Scholar]
- 29.Gemin A, Sweet S, Preston TJ, Singh G. Regulation of the cell cycle in response to inhibition of mitochondrial generated energy. Biochem Biophys Res Commun. 2005;332:1122–1132. doi: 10.1016/j.bbrc.2005.05.061. [DOI] [PubMed] [Google Scholar]
- 30.Turrens JF, Boveris A. Generation of superoxide anion by the NADH dehydrogenase of bovine heart mitochondria. Biochem J. 1980;191:421–427. doi: 10.1042/bj1910421. [DOI] [PMC free article] [PubMed] [Google Scholar]
- 31.Turrens JF, Alexandre A, Lehninger AL. Ubisemiquinone is the electron donor for superoxide formation by complex III of heart mitochondria. Arch Biochem Biophys. 1985;237:408–414. doi: 10.1016/0003-9861(85)90293-0. [DOI] [PubMed] [Google Scholar]
- 32.Kazuno AA, Munakata K, Kato N, Kato T. Mitochondrial DNA-dependent effects of valproate on mitochondrial calcium levels in transmitochondrial cybrids. Int J Neuropsychopharmacol. 2008;11:71–78. doi: 10.1017/S1461145707007614. [DOI] [PubMed] [Google Scholar]
- 33.Park SY, Chang I, Kim JY, Kang SW, Park SH, Singh K, et al. Resistance of mitochondrial DNA-depleted cells against cell death: role of mitochondrial superoxide dismutase. J Biol Chem. 2004;279:7512–7520. doi: 10.1074/jbc.M307677200. [DOI] [PubMed] [Google Scholar]
- 34.Yoeli-Lerner M, Yiu GK, Rabinovitz I, Erhardt P, Jauliac S, Toker A. Akt blocks breast cancer cell motility and invasion through the transcription factor NFAT. Mol Cell. 2005;20:539–550. doi: 10.1016/j.molcel.2005.10.033. [DOI] [PubMed] [Google Scholar]
- 35.Glinsky GV, Glinsky VV. Apoptosis and metastasis: a superior resistance of metastatic cancer cells to programmed cell death. Cancer Lett. 1996;101:43–51. doi: 10.1016/0304-3835(96)04112-2. [DOI] [PubMed] [Google Scholar]
- 36.Qiao M, Sheng S, Pardee AB. Metastasis and AKT activation. Cell Cycle. 2008;7:2991–2996. doi: 10.4161/cc.7.19.6784. [DOI] [PubMed] [Google Scholar]