Abstract
A theoretical model is described for application in ultrasonic tissue characterization using a calibrated 2-D spectrum analysis method. This model relates 2-D spectra computed from ultrasonic backscatter signals to intrinsic physical properties of tissue microstructures, e.g., size, shape, and acoustic impedance. The model is applicable to most clinical diagnostic ultrasound systems. Two experiments employing two types of tissue architectures, spherical and cylindrical scatterers, are conducted using ultrasound with center frequencies of 10 and 40 MHz, respectively. Measurements of a tissue-mimicking phantom with an internal suspension of microscopic glass beads are used to validate the theoretical model. Results from in vitro muscle fibers are presented to further elucidate the utility of 2-D spectrum analysis in ultrasonic tissue characterization.
Keywords: ultrasonic tissue characterization (UTC), tissue model, 2-D power spectrum, spectral parameter
I. INTRODUCTION
The goal of ultrasonic tissue characterization (UTC) is to improve ultrasonic diagnostic capabilities by providing quantitative measures of the physical properties of soft tissues. During the past two decades, a number of investigators have explored clinical ultrasonic tissue characterization for disease diagnosis using a one-dimensional (1-D) spectrum analysis method.1-3 Zagzebski et al. constructed quantitative ultrasound images based on the frequency-dependent backscatter coefficient of tissues to study liver diseases.4 Miller and associates developed the integrated backscatter to study cardiovascular tissue.5-7 Insana and Hall studied the acoustic backscatter of kidney microstructures.8,9 Donohue et al. investigated a generalized spectrum method in breast tumor classification.10 Among these groups, anisotropy in attenuation and in backscatter was reported for tissues, e.g., skeletal muscles,11 myocardium,7,12 and kidney.8,13
In the early 1980s, Lizzi et al. developed a calibrated (normalized) 1-D spectrum method to quantitatively characterize tissue in terms of its physical properties.14 This technique utilizes the radio-frequency (rf) echo signals measured directly at conventional clinical ultrasound probes. It has proven to be useful in the diagnosis of diseases in various organs, ranging from eye,15,16 breast,17,18 prostate,19 kidney and liver,20,21 to plaque22,23 and lymph nodes.24 We have extended this 1-D technique to 2-D using the same clinical data to more fully characterize tissue microstructures in terms of their physical properties.25 For example, 2-D spectra are distinctly different for asymmetric microstructures, e.g., muscles, and isotropic scatterers, all of which can produce similar 1-D spectra.
In 1-D spectrum analysis, ultrasonic rf echo data undergo Fourier transform only with respect to the range direction. In 2-D spectrum computation, rf data from adjacent scan lines are treated in a coherent fashion so that both range and cross-range tissue features can be examined. In an earlier paper, we outlined the ultrasonic tissue characterization method using 2-D spectrum analysis and demonstrated the feasibility of employing this 2-D spectrum analysis method with clinical rf data from ocular melanomas.26 In this paper we present the theoretical model underlying our UTC method using 2-D spectrum analysis. Our theoretical model is based on wave propagation in a statistically homogenous medium with randomly distributed local inhomogeneities, which are characterized by a 3-D Gaussian spectral autocorrelation function (ACF). Our analysis shows that 2-D power spectra are related to known transducer factors and to tissue physical properties such as size, shape, and acoustic impedance fluctuation.
Two series of experiments were conducted to validate the theoretical model. We obtained 2-D spectra relevant to two types of tissue architectures, spherical and cylindrical scatterers. For studies of isotropic scatterers, we employed a tissue-mimicking phantom with an internal distribution of glass beads (spherical scatterers); the phantom was scanned with 10 MHz ultrasound. For studies of cylindrical scatterers, we scanned in vitro muscle fibers with 40 MHz ultrasound. These studies were conducted to further elucidate the utility of 2-D spectrum analysis and to evaluate the ability to detect tissue structural features, such as anisotropy, that are not apparent in 1-D spectrum analysis.
The rest of the paper is organized as follows. The 2-D spectrum analysis method and operations are described in Sec. II. The theoretical model is derived based on wave propagation in random medium in Sec. III. In Sec. IV, two separate experiments are presented to corroborate the theoretical model.
II. 2-D SPECTRUM ANALYSIS METHOD
2-D spectrum analyses are performed on the digital rf echo signals as described in our previous reports.26 These rf data are acquired directly at the transducer of a conventional medical ultrasound. Figure 1 is a diagram showing the geometry in which the transducer is linearly scanned in the Y direction to examine tissue structures. For data acquisition, the sampling rates in both range (points/mm) and cross-range (scan lines/mm) must be set higher than the Nyquist rates to avoid aliasing for later Fourier analysis. In the range direction, the Nyquist rate was determined by the band-width of the ultrasound beam. In the cross-range direction, the Nyquist rate was determined by the beam-width.
Fig. 1.
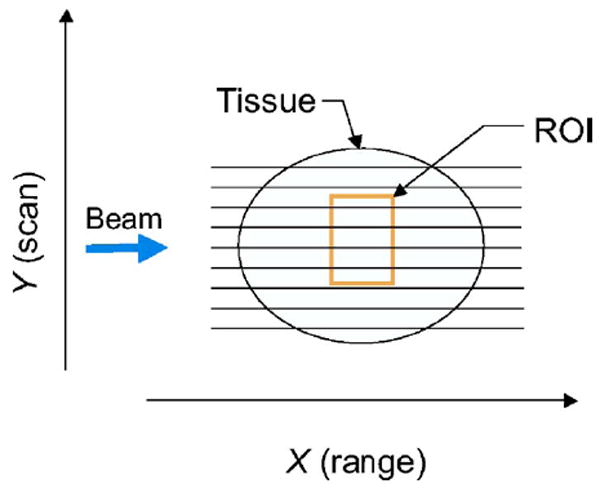
Diagram showing a transducer scanning a specimen.
Figure 2 is the diagram showing the sequence of operations of 2-D spectrum analysis. The first step is a digital reconstruction of the B-mode image from the rf echo signals captured from each scan plane. The B-mode image serves to identify overall anatomic relationships and guides region-of-interest (ROI) position. In this study, all ROIs were placed manually. The ROI specifies the region where the rf signals will be analyzed. To compute 2-D spectrum of the ROI, the 2-D rf signals inside the ROI are multiplied by a 2-D Hamming function with window lengths LX and LY along the range and cross-range directions, respectively. A 1-D fast Fourier transform (FFT) with respect to range is applied along each scan line. To remove the effects of the transducer and system electronic modules, the 1-D spectrum is divided by a calibration spectrum, which is the spectrum of rf echo signals from a glass planar reflector in the transducer’s focal region.14 The resulting normalized complex 1-D spectrum is then Fourier transformed along the cross-range direction to obtain a 2-D spectrum. The spectral magnitude is squared to compute a single realization of the 2-D power spectrum. The resulting 2-D spectrum, s2D(f,μ) ≡ s2D(k,μ), is specified in terms of the temporal frequency f (MHz) and the cross-range spatial frequency μ (cm−1). The spatial frequency k pertains to the range direction, k=2πf/c, where f is the temporal frequency and c is the speed of ultrasound propagation in the medium. The spatial frequency μ pertains to the cross-range direction. The “true”2-D power spectrum, S2D(k,μ), is estimated as the ensemble mean, formed by averaging 2-D power spectra of many nonoverlapping segments in the tissue being examined or different scans of the same region. Power spectra are usually expressed in decibel units. All subsequent plots of 2-D power spectra in this report are calculated in dB as S′(f,μ)=10 log S(k,μ).
Fig. 2.
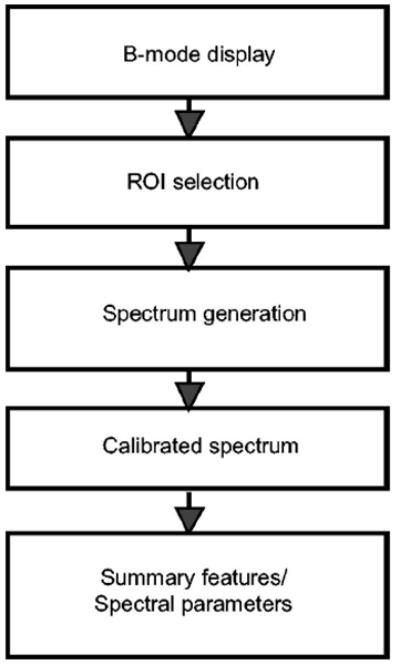
Diagram showing 2-D spectrum analysis procedure.
III. THEORETICAL MODEL OF 2-D SPECTRUM ANALYSIS
In ultrasonic tissue characterization, the main challenge is to understand the alternation of the acoustic properties of the tissue during diseases. In this section, we derive the theoretical model of the 2-D spectrum analysis for UTC to better interpret the interaction of the biological tissues and the ultrasound wave. This 2-D model is an extension of the 1-D spectrum theoretical framework introduced by Lizzi et al. We start the section with the basic assumptions of the model, followed by the mathematical formulation. We then treat a specific class of stochastic scatterers characterized by a 3-D Gaussian ACF. Last, we show simulation results for isotropic and quasi-cylindrical scatterers.
A. Mathematical formulation
The interactions between ultrasonic wave and biological tissues are complex. As the result of this complexity, scattering from tissues remains an empirical science, but one requiring the guidance of a realistic theoretical treatment.27 Before describing the details of the mathematics, we will first review the basic assumptions underlying the theoretical model.
The initial assumptions of the model are
Assumption 1: The scatterers in the examined tissue are stochastic weak scatterers (Born approximation). This assumption holds for most soft tissues.
Assumption 2: The tissue acoustic impedance fluctuations can be modeled as statistically homogenous within the ROI. The stochastic tissue microstructures are specified in terms of an ACF that quantifies the spatial disposition of acoustic impedance within the ROI.
Assumption 3: The ROIs are located within the focal region of the transducer and the beam does not exhibit significant variations in pressure amplitude over the axial length of the ROI. Under this condition, the beam can be treated as a quasi-plane wave.
Assumption 4: The time duration of the gate is much longer than the echo from a single scatterer.
Two additional assumptions are made for further simplification. They are not essential and can be removed by making corrections to the model.
Assumption 5: The transducers are single-element, moderately focused devices. These are very commonly used in medical ultrasound imaging. But the analysis is not limited to single-element transducers and can be extended to most clinical array transducers.
Assumption 6: Attenuation within the tissue is negligible for this report. If the intervening attenuation is present, it can be compensated through the effective intensity attenuation coefficient.14 The attenuation estimations can convey a great deal of information concerning the tissue microstructure and have been studied by a number of laboratories.28,29
The theoretical model of 2-D spectrum analysis builds upon the theoretical framework for 1-D spectra.14 Under those assumptions, tissue scattering is related to acoustic impedance fluctuations. The acoustic impedance (Z) is defined as the product of sound speed (c) and density (ρ) in a medium. The calibrated 1-D power spectrum of the ROI analysis is the 1-D tissue spectra divided by the calibration spectrum, which is the spectrum of rf echo signals from a glass planar reflector in the transducer’s focal plane. It is the Fourier transform of the product of the rf signal and a gating function,
| (1) |
where the transducer is located at the origin of the Cartesian coordinate system; g1(x) is the gating function along the beam propagation, or range, direction; T(x, y, z) is the fractional variation of acoustic impedance of tissue in space; and D(y, z) is the beam directivity function, given by the transducer geometry and frequency. All integrals in this report are from −∞ to ∞.
The 2-D spectral analysis extends this result by considering the case in which the transducer is scanned along the Y axis, which is orthogonal to the X axis, as shown in Fig. 1. From Eq. (1), the 1-D spectrum along a scan line centered at yt is
| (2) |
where yt denotes the transducer location along the Y direction.
A 2-D spectrum is obtained by multiplying the complex 1-D spectrum from adjacent scan lines with a gating function g2(yt) that encompasses a number of scan lines along the Y direction. The product is then Fourier transformed with respect to yt,
| (3) |
where μ is the spatial frequency (cm−1) along the Y direction. The complex 2-D spectrum is obtained by combining Eqs. (2) and (3),
| (4) |
The 2-D power spectrum is computed as
| (5) |
where is the complex conjugate of s2D(k,μ).
Substituting Eq. (4) into Eq. (5), one obtains the following equation,
| (6) |
Equation (6) is a general expression for the 2-D power spectrum of ultrasound echo signals. To simplify the analysis of the conjugate functions, we make the assumptions regarding the ultrasound beam, the impedance distribution, etc.
Since the scatterers in soft tissues that this model intends to characterize are randomly distributed, a meaningful descriptor must be statistical by nature and involves an averaging over a statistical ensemble. The “true” power spectrum, S2D, is estimated as the ensemble mean, formed by averaging 2-D power spectra of many nonoverlapping segments in the tissue being examined, or alternatively over different scans of the same tissue region,
| (7) |
where 〈〉 indicates ensemble average. We apply this operation to Eq. (6) and note that both the beam directivity function and the gating function are deterministic. The tissue function T(x, y, z) is the only random variable. Thus, from Eq. (6), the corresponding ensemble-averaged 2-D power spectrum is
| (8) |
We now treat the specific case in which T(x, y, z) exhibits wide-sense stationarity. Under the wide-sense stationarity condition, the mean value of a process is independent of the absolute position and is only a function of the relative position. To express this mathematically,
| (9a) |
| (9b) |
where Δx, Δy, Δz, and Δξ are the lags along X, Y, Z, and yt coordinates, respectively, and RT is the ACF of T(x, y, z). Equation (8) can be rewritten as
| (10) |
where , and RD is a spatial ACF describing the two-way directivity function of the beam,
| (11) |
and RG is a spatial ACF of the 2-D gating function, i.e.,
| (12) |
Equation (10) is the general equation of the calibrated 2-D power spectrum for tissues exhibiting wide-sense stationarity. It demonstrates that 2-D power spectra of rf signals are basically determined by three ACFs: the ACF of the 2-D gating function, the ACF of the ultrasonic two-way beam directivity function, and, the ACF of the tissue acoustic impedance function. The second degree of freedom in the frequency domain allows the better exposition of spatial anisotropy and orientation of three-dimensional tissue scatterers than the previous 1-D spectrum method.
B. 3-D Gaussian tissue model and 2-D power spectra
The back-scattering power spectrum given in Eq. (10) assumes wide-sense stationarity for tissue scatterers, but not any particular forms for the constituent ACFs. In this section, we will derive analytic results for 2-D power spectra using specific functions for each ACF.
A Gaussian autocorrelation function represents a useful approximation for stochastic, but continuous, variations in space of the tissue acoustic impedance function.30 The Gaussian ACF is widely employed and has been found to agree with 1-D spectral shapes observed in various clinical examinations.31 For broadband data such as in kidney, a single Gaussian model might not fit the data well and a sum of Gaussian functions or a narrower band analysis might be required.31,32
We generalize the 1-D Gaussian scattering model to a full three-dimensional Gaussian function of separate characteristic lengths with the aim of taking into account the spatial anisotropy of the average scatterers,
| (13) |
where C specifies the effective volumetric scatterer concentration; Q specifies the relative acoustic impedance difference between the scatterers (with acoustic impedance Z) and the surrounding medium (with average acoustic impedance Z0); Vs specifies the volume of an average scatterer; and, α, β, and γ represent effective sizes along the X, Y, and Z directions, respectively.
In general, this function represents continuous, random spatial distributions of acoustic impedance fluctuation with correlation lengths of α, β, and γ in the X, Y, and Z directions, respectively. It is often useful to interpret the ACF in terms of a random spatial distribution of discrete scatterers with effective dimensions of α, β, and γ in the three orthogonal directions. Q is a spatially dependent function that is only being sampled along x and that, if the sample were rotated (90 deg in many media), this analysis would provide a different 2-D spectrum in anisotropic media. The acoustic beam interacts primarily with the axial component of the impedance fluctuations, and to a much lesser extent with the lateral or longitudinal components.
The treatment of the beam directivity ACF is greatly simplified by the fact that the transducers commonly used in clinical ultrasound are moderately focused. In the focal zone of such transducers, the beam ACF can be closely approximated as a 2-D Gaussian function:14
| (14) |
where a is the aperture radius and R is the focal length of the transducer. The −3 dB beam-width is approximately equal to πR/ak.
The gating functions used along the X and Y directions are Hamming window functions. The Hamming window gating functions reduce the spectral side lobes of a windowed Fourier transform. Hamming window lengths LX and LY are the axial length and cross-range length of the Hamming window, respectively.
Typically LX and LY are selected to be much larger than the corresponding correlation lengths of the tissue microstructure, α and β. Following the earlier treatment for 1-D spectrum analysis, the Hamming ACFs along the X and Y directions can be approximated as RG1(0) and RG2(0).14 These functions equal 0.4LX and 0.4LY, respectively, so that the 2-D Hamming window ACF is approximated as 0.16LXLY.
Substituting the ACFs into the integral expression of (Eq. 8), the 2-D power spectrum for small scatterers with 3-D Gaussian ACF can be evaluated. The closed form solution is expressed as
| (15) |
Equation (15) is a closed form solution that relates 2-D spectra to scatterer features including their effective sizes (α,β,γ), concentration (C), relative acoustic impedance (Q), and beam features (e.g., the −3 dB beam-width πR/ak). It shows that the 2-D power spectra are linearly proportional to the FFT window lengths LX, LY and CQ2.
The gate lengths (LX,LY), scatterer concentration (C), and fractional difference of acoustic impedance (Q) affect the overall spectral magnitude of S′(k,μ), but do not affect the spectral shapes. Therefore, for convenience, LX, LY, and CQ2 are all set to unity in the following plots. They can be applied to specific spectral results (in dB) by adding the term 10 log (LXLYCQ2).
The 1-D power spectrum is obtained by integrating the 2-D power spectrum over μ. The result is
| (16) |
This expression is consistent with previous 1-D results.33
C. Illustrations of the theoretical 2-D power spectra
The theoretical 2-D power spectrum result is now applied to specific illustrative cases. In discussing these results, a very high frequency transducer, referred to as a VHFU transducer, was used. The transducer is representative of those used in high-resolution examinations of the eye. It has a nominal center frequency of 40 MHz with −15 dB bandwidth from 10 to 60 MHz. The focal length is 15 mm and the aperture radius is 3 mm. The wavelength and −3 dB beam-width at 40 MHz are computed to be 37.5 and 75 μm, respectively.
Figure 3(a) shows the theoretical 2-D power spectra of isotropic spherical scatterers with 10 μm correlation length (α=β=γ=10 μm). The horizontal axis for the 2-D power spectrum is the spatial frequency k, which is proportional to the temporal frequency f (k=2πf/c). The temporal frequency varies from 10 to 60 MHz; for a typical value of c (1500 m/s), this corresponds to a spatial frequency k ranging from 40 to 250 mm−1. The vertical axis is the spatial frequency μ, which varies from −250 to 250 mm−1. The color indicates the intensity of the spectral power, which varies from −15 dB (colored red) to −75 dB (colored blue).
Fig. 3.
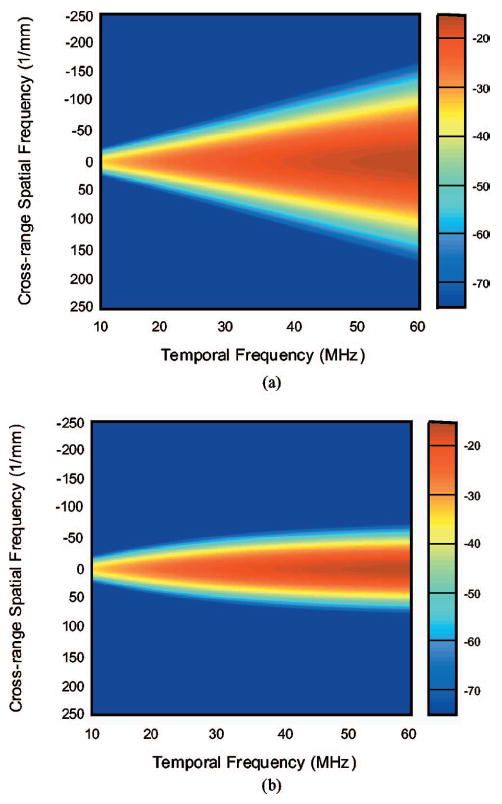
2-D power spectrum (a) Spherical scatterers α=β=γ=10 μm. (b) Cylindrical scatterers α=β=10 μm, γ=100 μm.
Figure 3(b) shows 2-D power spectra of the cylindrical scatterers with 10 μm diameter (α=β=10 μm) and 100 μm length (γ =100 μm). The cylinders are aligned perpendicularly to the incident beam and their centers are randomly positioned. The transducer aperture radius and focal length are 3 and 15 mm, respectively. The maximum spectral amplitudes is −2.2 dB. The angular spreads for cylindrical scatterers are much smaller than those of the isotropic scatterers, shown in Fig. 3.
The triangular spread of the 2-D spectrum of typical isotropic scatterers that are much smaller than the beam-width is primarily associated with the beam characteristics. This shape can be understood by noting that the −3 dB beam-width is approximately equal to πR/ak(=Rc/af), which is inversely proportional to temporal frequency. The beam is relatively wide for low temporal frequencies and narrow for high temporal frequencies, so that its spectrum in the spatial-frequency domain is narrow for low frequencies and becomes progressively wider for higher frequencies. Mathematically, this is due to the exp [(−1/0.88)(μR/ka)] dependence of S(k,μ), seen in (Eq. 15). A theory for the elastic scattering response from a cylinder insonified by a plane wave was previously derived by Faran.34 Faran’s theory is not directly applicable to the biological tissues, for which the quasi-cylindrical scatterers in biological tissue are nonuniform and the incident beam is not planar. Our theoretical model indicates that for long cylindrical scatterers, γ ⪢ πR/ak, 2-D power spectrum is proportional to f2 and α4. Wear et al. have also reported that, for cylindrical scatterers, the association of Faran’s predictions with the measured backscatter coefficient is not as clear as in the case of spherical scatterers.35
IV. EXPERIMENTAL RESULTS
Two series of experiments were conducted to validate the theoretical model. A benchmark study was carried out using a tissue-mimicking phantom with suspended microscopic glass beads to simulate isotropic scatterers. In vitro beef muscle study was conducted to investigate the utility of the 2-D spectrum analysis in characterizing biological tissues with cylindrical microstructures.
A. Phantom experiments
For the phantom study, 2-D rf data were acquired by the standard linear transducer scanning (B-mode procedure). The tissue-mimicking phantom (ATS Laboratories, Bridgeport, CT) is a rectangular rubber block with dimensions 5×5×8 cm3. Its basic material, TE rubber, has an attenuation coefficient of 0.5 dB/MHz-cm and speed of sound of 1450 m/ s. Glass beads are randomly distributed inside the rubber to serve as isotropic scatterers. The mean diameter of the scatterers is 10.2±2.3 μm. The nominal concentration of the scatterers is 12.8×10⁷ particles/cm3.
The ultrasound transducer (Panametrics, Waltham, MA) used in this experiment is a single-element, moderately focused, and broadband unit with a nominal center frequency of 10 MHz. It has a 10 mm aperture and 50 mm focal length. The data acquisition parameters are shown in Table I.
Table I.
Data acquisition parameters for the phantom measurements.
| Sampling rate | 50 MHz |
| Bit depth | 8 bit/sample |
| Sampling points | 1 Kbyte/line |
| Scan lines | 256 lines/scan |
| Scan line separation | 100 μm |
Figure 4 is the B-mode image of the tissue-mimicking phantom with the ROI demarcated. The attenuation is neglected, because the ROI is placed right below the surface and its size along the range direction is small (0.28 cm). Figure 5 shows the 2-D spectrum of the ROI. The horizontal axis is the temporal frequency, which varies from 5 to 15 MHz. The vertical axis is the cross-range spatial frequency, varying from −25 to 25 mm−1. The color of the spectrum indicates the intensity of spectral power ranging from 2 dB (in red) to −38 dB (in blue), as shown in the colorbar.
Fig. 4.
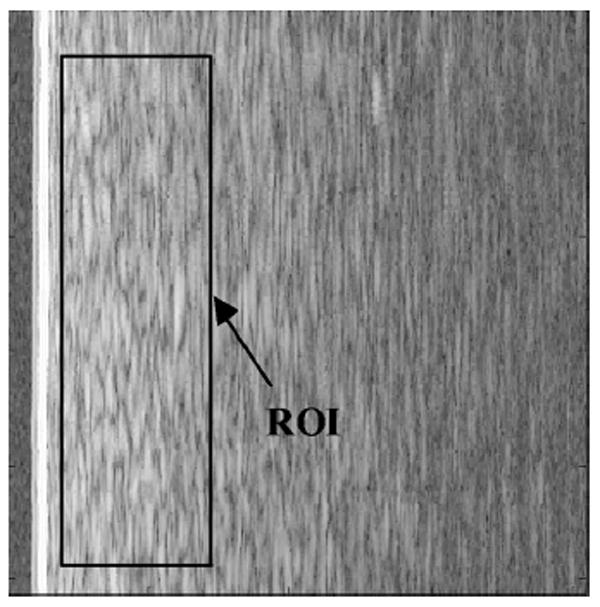
B-mode image of scan plane 1 of the tissue mimicking phantom. Image size is 3.08 cm along the horizontal direction (range) and 2.56 cm along the vertical direction (cross-range). The ROI size is 0.78 cm (range) by 2.2 cm (cross-range).
Fig. 5.
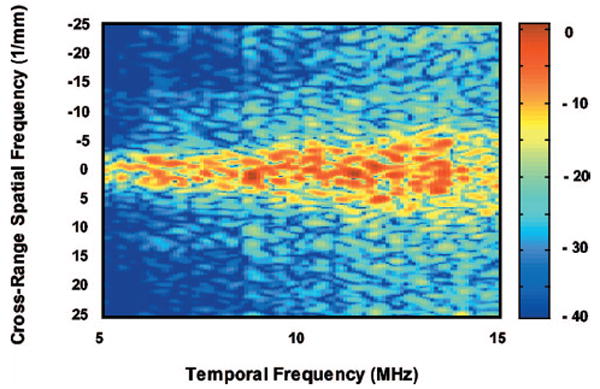
2-D power spectrum of the ROI of the tissue-mimicking phantom.
Since the scatterers are spatially distributed in a random manner, the single 2-D spectrum exhibits stochastic fluctuations similar to the random speckle pattern in B-mode images. Averaging 2-D power spectra from uncorrelated regions produce a more reliable representation of the 2-D spectrum. Ten ROIs from ten independent scan planes located in the same distance from the phantom surface were analyzed with the procedure described in Sec. II.
Figure 6 is the averaged 2-D power spectrum obtained from ten independent ROIs. Figure 7 is the theoretical 2-D power spectrum of 10 μm spherical scatterers scanned with a 10 MHz transducer computed from Eq. (15). For this study, only the frequency dependence of the theoretical model and the experiment result were compared. The theoretical prediction of the spectral magnitude was not evaluated. It is interesting to note that both experimental and theoretical results show a triangular spectral power distribution defined by the beam transfer function, as expected for collections of scatterers that are much smaller than the beam-width and the constituent ultrasonic wavelengths. As discussed in the theory section, the beam transfer function is the Fourier transform of the beam’s two-way directivity function and is inversely proportional to beamwidth, so that its 3 dB width increases with temporal frequency f. The theoretical one is predictably smoother and less noisy. The close but less than perfect agreement between the experimental spectra data and that of the theoretical model is encouraging. The deviations may be caused by the various sources. One possible source is sizes of the glass beads (10.2±2.3 μm). The larger glass beads with diameter near 12.5 μm generate larger backscatter than small beads and could disproportionately cause the 2-D power spectra to be much narrower than expected. The main source may come from the assumption of the Gaussian beam ACF for the single element transducer.
Fig. 6.
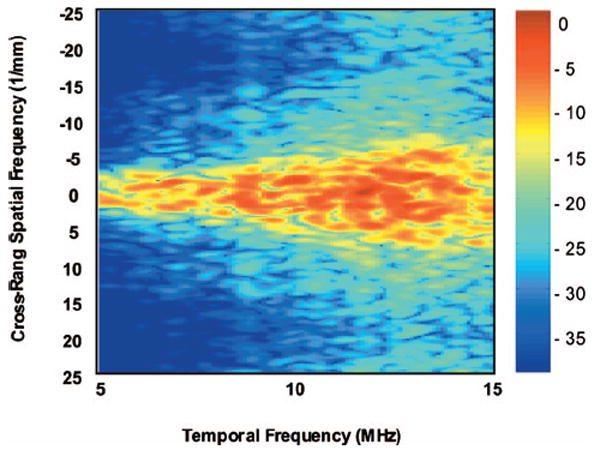
2-D power spectrum over 10 ROIs of the tissue-mimicking phantom.
Fig. 7.
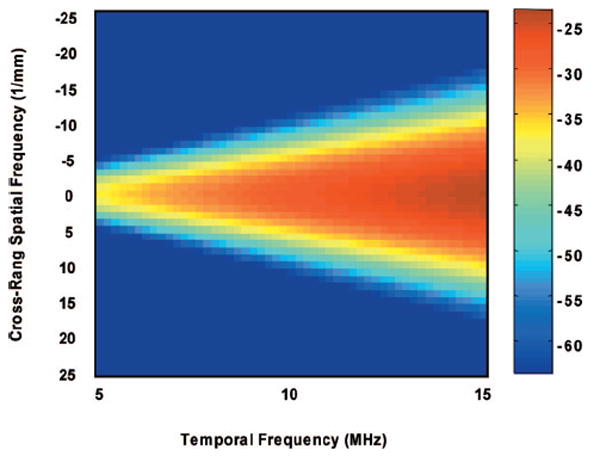
Theoretical 2-D power spectrum for isotropic scatterers with 10 μm diameter.
B. In Vitro beef muscle study
In this section, a 2-D spectrum technique is applied to analyze the nonisotropic scatterers of in vitro beef skeletal muscle fibers. Beef muscle was chosen because it consists of elongated and unbranched fiber cells that resemble cylindrical scatterers. The radius of the fiber cells is typically between 10 and 100 μm.
This experiment was carried out using a focused PVDF transducer (Panametrics, Waltham, MA) with a center frequency of approximately 40 MHz, a 6 mm aperture, and a 12 mm focal length. The 3 dB beam width is 60 μm at 40 MHz. The wavelength of ultrasound at 40 MHz frequency is 38.5 μm. This corresponds to a pulse length near 70 μm. The scan parameters are shown in Table II.
Table II.
Transducer and data acquisition parameters for the beef muscle measurements.
| Sampling rate | 500 MHz |
| Bit depth | 8 bit/sample |
| Sampling points | 2024/line |
| Scan lines | 512/scan |
| Scan line separation | 10 μm |
Figure 8(a) shows the B-mode image, which had dimensions of 3 mm along the beam propagation direction and 5 mm along the scan direction. Figure 8(b) is the photomicrograph of the beef skeletal muscle. The specimen was fixed in 10% neutral buffered formalin, dehydrated, embedded in paraffin, sectioned at 5 μm, and mounted on a glass slide for microscopic evaluation. The scale bar represents 200 μm. The micrograph demonstrated the characteristic histological features of skeletal muscles. Skeletal muscles are elongated, unbranched cylindrical cells with numerous flattened nuclei located at fairly regular intervals just beneath the sarcolemma.
Fig. 8.
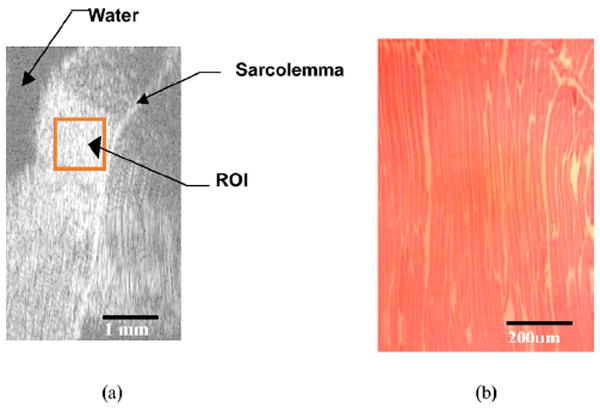
(a) B-mode image of beef muscle fibers. Image size is 3 mm along the range direction and 5 mm along the cross-range direction. The ROI is 0.75 mm (range) by 1.1 mm (cross-range). (b) Photomicrograph of beef skeletal muscle bundles.
The ROI was placed within a muscle bundle region for the 2-D analysis. The ROI segment had dimensions of 0.75 mm along the range direction (containing sample points 500 to 1000) and 1.1 mm along the scan direction (containing scan lines 110 to 22). For 2-D spectrum computation, the intervening attenuation is negligible due to the shallow depth and small size of the ROI.
Figure 9 shows the 2-D power spectra obtained for the ROI in Fig. 8(a). The largest spectral magnitudes occurred between 20 and 30 MHz. The narrow spread of the spectral power in the cross-range frequency direction is consistent with the presence of the cylindrical scatterers inside the beef muscle bundle as discussed in the theory section. For this study, only the frequency dependencies of backscatter were considered. The theoretical prediction of the absolute magnitude was not evaluated due to lack of knowledge of the beef muscle acoustic impedance. The acoustic scattering of the biological tissues is complex. The backscattered echo is a superposition of signals from many small structures within the volume of ensonified tissue. It is suggested that the muscle fibers are the main source of scattering.9,36.
Fig. 9.
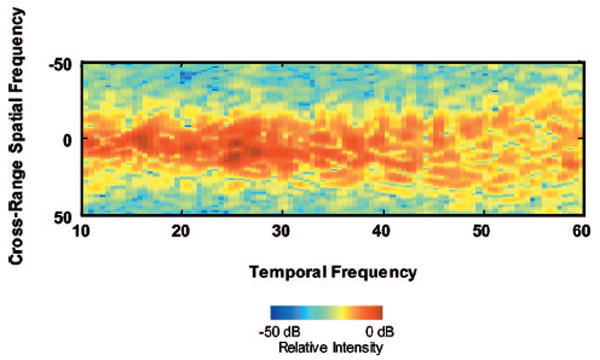
2-D power spectra of the muscle fiber.
V. DISCUSSION
We have derived a theoretical model that relates features of 2-D spectra to stochastic tissue microstructures. In addition we showed the explicit form of a calibrated 2-D spectrum with a general three-dimensional tissue acoustic impedance fluctuation model. In particular we addressed the relationship between the scattering and tissue morphology, and the issue of what features of tissue are responsible for ultrasound scattering.
Our theoretical model demonstrates how 2-D power spectra are related to the ultrasonic beam, the transducer, and the tissue physical properties. The ultrasound beam factors are the center frequency and bandwidth. The transducer factors are the diameter and focal length. The tissue physical properties are the effective size, shape, concentration, and acoustic impedance fluctuation of the tissue microstructures. These results are illustrated in the limiting cases of isotropic and quasi-cylindrical scatterers. The 2-D spectral results are also integrated over the cross-range spatial frequency to check for consistency with previously reported 1-D spectrum results.
The following general observations can be made based on our theoretical investigation, shown in Eq. (15). The concentration and acoustic impedance difference of the scatterers affect the overall spectral magnitude (expressed in dB), but not the spectral shape. The spectral power distributions along temporal frequency (f) are mostly dependent on the size of the scatterers along the range (X) direction. The spectral distributions along the cross-range spatial frequency (μ) axis are mostly determined by β, the scatterer size along the scan (Y) direction. For normal incidence, the shape of the 2-D power spectra is relatively insensitive to γ, the scatterer size along Z axis (perpendicular to the scan plane).26
In our tissue-mimicking phantom experiments, the theoretical model of the 2-D spectrum analysis has been validated with the backscattering from the sub-wavelength diameter glass beads. The high degree of symmetry of the glass beads makes it an ideal benchmarking case. The effect of the beam transfer function on the spatial frequency dependence of the 2-D spectrum is clearly seen in the experimental spectra. The phantom study also demonstrated that the 2-D spectra are sensitive to scatterers that are much smaller than the wavelength of the ultrasound beam. The in vitro beef muscle study further illustrated the utility of the 2-D spectrum analysis in characterizing biological tissue with quasi-cylindrical microstructures. The triangular spread of the 2-D spectrum is much smaller than that of isotropic scatterers. This phenomenon is entirely missing in 1-D spectrum analysis. The beef muscle study demonstrated the advantages of 2-D spectrum analysis over the 1-D method.
In this study, we employed a glass plate reflector as the calibration target to normalize the 2-D power spectra. It extracted the temporal frequency transfer function of ultrasound system. A wide range of calibration techniques have been reported for 1-D spectrum analysis. Planar surfaces such as acrylic, stainless steel, or immiscible liquid interface were used.37 A reference phantom technique was developed for the depth and frequency correction.38 Future work is needed to explore other calibration techniques that will allow compensation not only for the temporal frequency but also for the cross-range component. The cross-range calibration involves the “beam transfer function,” which is the Fourier transfer of the beam’s two-way directivity function.
Conventional ultrasound imaging provides anatomical information. UTC is intended to define quantitatively the physiological status of biological tissues. The overall hypothesis is that pathologic changes alter the physical properties in a fashion that can be indexed by 2-D spectral parameters. The 2-D theoretical model could be utilized to assess the optimal parameters to be used in this technique.
We have implemented this 2-D UTC technique in clinical applications. We have demonstrated the feasibility of employing 2-D spectrum technique to clinical rf data from human intraocular melanomas26 and prostate gland.39 Further studies are underway to evaluate the accuracy and precision of the 2-D spectral parameters in characterizing tissue microstructures.
VI. CONCLUSION
We have expanded Lizzi’s 1-D spectrum theoretical framework to a 2-D spectrum theoretical model. Two-dimensional spectra of backscatter ultrasonic signals from tissue measures lateral (cross-range) microstructure dimensions that are not directly sensed by 1-D spectra. 2-D spectra are sensitive to the structural features of biological tissues. Since these are the features that pathologists often use for disease diagnoses, 2-D spectra can potentially be a diagnostic tool. It can provide important information about the physiological condition of tissue. This is an important step forward in the noninvasive ultrasonic tissue characterization for disease diagnosis.
Acknowledgments
We wish to dedicate this paper to the memory of Dr. F. L. Lizzi who passed away in 2005. Dr. Lizzi was the thesis advisor of Tian Liu and this paper represents the result of their collaboration. We wish to thank Paul Lee for his generous help with the data acquisition and computer programming. This research was supported in part by the National Cancer Institute Grant No. CA114313.
Contributor Information
Tian Liu, Department of Radiation Oncology, Columbia University, New York, New York 10032.
Frederic L. Lizzi, Frederic L. Lizzi Center for Biomedical Engineering, Riverside Research Institute, New York, New York 10038
Jeffrey A. Ketterling, Frederic L. Lizzi Center for Biomedical Engineering, Riverside Research Institute, New York, New York 10038
Ronald H. Silverman, Department of Ophthalmology, Weill Medical College of Cornell University, New York, New York 10021 Frederic L. Lizzi Center for Biomedical Engineering, Riverside Research Institute, New York, New York 10038.
Gerald J. Kutcher, Department of Radiation Oncology, Columbia University, New York, New York 10032
References
- 1.Shung KK, Sigelmann RA, Reid JM. Scattering of ultrasound by blood. IEEE Trans Biomed Eng. 1976;23:460–467. doi: 10.1109/tbme.1976.324604. [DOI] [PubMed] [Google Scholar]
- 2.Sehgal CM, Greenleaf JF. Scattering of ultrasound by tissues. Ultrason Imaging. 1984;6:60–80. doi: 10.1177/016173468400600106. [DOI] [PubMed] [Google Scholar]
- 3.Waag RC, Dalecki D, Christopher PE. Spectral power determinations of compressibility and density variations in model media and calf liver using ultrasound. J Acoust Soc Am. 1989;85:423–431. doi: 10.1121/1.397994. [DOI] [PubMed] [Google Scholar]
- 4.Zagzebski JA, Lu Z, Yao L. Quantitative ultrasound imaging: in vivo results in normal liver. Ultrasound Imaging. 1993;15:335–351. doi: 10.1177/016173469301500405. [DOI] [PubMed] [Google Scholar]
- 5.Jack GM, Robert MG, Julio EP, Burton ES, Miller JG. Regional differences in the cyclic variation of myocardial backscatter that parallel regional differences in contractile performance. J Acoust Soc Am. 1984;76:1617–1623. doi: 10.1121/1.391608. [DOI] [PubMed] [Google Scholar]
- 6.Mottley JG, Miller JG. Anisotropy of the ultrasonic backscatter of myocardial tissue: I. Theory and measurements in vitro. J Acoust Soc Am. 1988;83:755–761. doi: 10.1121/1.396118. [DOI] [PubMed] [Google Scholar]
- 7.Mottley JG, Miller JG. Anisotropy of the ultrasonic attenuation in soft tissues: measurements in vitro. J Acoust Soc Am. 1990;88:1203–1210. doi: 10.1121/1.399751. [DOI] [PubMed] [Google Scholar]
- 8.Insana MF, Hall TJ, Fishback JL. Identifying acoustic scattering sources in normal renal parenchyma from the anisotropy in acoustic properties. Ultrasound Med Biol. 1991;17:613–626. doi: 10.1016/0301-5629(91)90032-r. [DOI] [PubMed] [Google Scholar]
- 9.Insana MF. Modeling acoustic backscatter from kidney microstructure using an anisotropic correlation function. J Acoust Soc Am. 1995;97:649–655. doi: 10.1121/1.412287. [DOI] [PubMed] [Google Scholar]
- 10.Donohue KD, Huang L, Burks T, Forsberg F, Piccoli CW. Tissue classification with generalized spectrum parameters. Ultrasound Med Biol. 2001;27:1505–1514. doi: 10.1016/s0301-5629(01)00468-9. [DOI] [PubMed] [Google Scholar]
- 11.Nassiri DK, Nicholas D, Hill CR. Attenuation of ultrasound in skeletal muscle. Ultrasonics. 1979;17:230–232. doi: 10.1016/0041-624x(79)90054-4. [DOI] [PubMed] [Google Scholar]
- 12.Mottley JG, Miller JG. Anisotropy of the ultrasonic backscatter of myocardial tissue: I. Theory and measurements in vitro. J Acoust Soc Am. 1988;83:755–761. doi: 10.1121/1.396118. [DOI] [PubMed] [Google Scholar]
- 13.Rubin JM, Carson PL, Meyer CR. Anisotropic ultrasonic backscatter from the renal cortex. Ultrasound Med Biol. 1988;14:507–511. doi: 10.1016/0301-5629(88)90112-3. [DOI] [PubMed] [Google Scholar]
- 14.Lizzi FL, Greenebaum M, Feleppa EJ, Elbaum M, Coleman DJ. Theoretical framework for spectrum analysis in ultrasonic tissue characterization. J Acoust Soc Am. 1983;73:1366–1373. doi: 10.1121/1.389241. [DOI] [PubMed] [Google Scholar]
- 15.Silverman RH, Folberg R, Boldt HC, Lloyd HO, Rondeau MJ, Mehaffey MG, Lizzi FL, Coleman DJ. Correlation of ultrasound parameter imaging with microcirculatory patterns in uveal melanomas. Ultrasound Med Biol. 1997;23:573–581. doi: 10.1016/s0301-5629(97)00037-9. [DOI] [PubMed] [Google Scholar]
- 16.Silverman RH, Folberg R, Rondeau MJ, Boldt HC, Lloyd HO, Chen X, Lizzi FL, Weingeist TA, Coleman DJ. Spectral parameter imaging for detection of prognostically significant histologic features in uveal melanoma. Ultrasound Med Biol. 2003;29:951–959. doi: 10.1016/s0301-5629(03)00907-4. [DOI] [PubMed] [Google Scholar]
- 17.Alam SK, Lizzi FL, Feleppa EJ, Liu T, Kalisz A. Ultrasonic multifeature analysis procedures for breast lesion classification. Proc SPIE. 2000;3982:196–201. [Google Scholar]
- 18.Alam SK, Lizzi FL, Feleppa EJ, Liu T, Kalisz A. Computeraided diagnosis of breast lesions using multifeature analysis procedure. Proc SPIE. 2002;4687:296–303. [Google Scholar]
- 19.Feleppa EJ, Fair WR, Liu T, Kalisz A, Balaji KC, Porter CR, Tsai H, Reuter V, Gnadt W, Miltner MJ. Three-dimensional ultrasound analyses of the prostate. Mol Urol. 2000;4:133–139. discussion 141. [PubMed] [Google Scholar]
- 20.Kimitsuki H, et al. Effect of perfusion and blood content on ultrasonic backscattering of liver tissue. Ultrasound Med Biol. 1993;19:39–43. doi: 10.1016/0301-5629(93)90016-h. [DOI] [PubMed] [Google Scholar]
- 21.King DL, Lizzi FL, Feleppa EJ, Wai PM, Yaremko MM, Rorke MC, Herbst J. Focal and diffuse liver disease studied by quantitative microstructural sonography. Radiology. 1985;155:457–462. doi: 10.1148/radiology.155.2.2984720. [DOI] [PubMed] [Google Scholar]
- 22.Lizzi FL, Deng CX, Lee P, Rosado A, Silverman RH, Coleman DJ. A comparison of ultrasonic beams for thermal treatment of ocular tumors. Eur J Ultrasound. 1999;9:71–78. doi: 10.1016/s0929-8266(99)00011-7. [DOI] [PubMed] [Google Scholar]
- 23.Noritomi T, Sigel B, Gahtan V, Swami V, Justin J, Feleppa EJ, Shirouzu K. In vivo detection of carotid plaque thrombus by ultrasonic tissue characterization. J Ultrasound Med. 1997;16:107–111. doi: 10.7863/jum.1997.16.2.107. [DOI] [PubMed] [Google Scholar]
- 24.Tateishi T, Machi J, Feleppa EJ, Oishi R, Jucha J, Yanagihara E, McCarthy LJ, Noritomi T, Shirouzu K. In vitro diagnosis of axillary lymph node metastases in breast cancer by spectrum analysis of radio frequency echo signals. Ultrasound Med Biol. 1998;24:1151–1159. doi: 10.1016/s0301-5629(98)00100-8. [DOI] [PubMed] [Google Scholar]
- 25.Liu T. Ph D thesis. Columbia University; 2002. Ultrasonic tissue characterization using 2–D spectrum analysis. [Google Scholar]
- 26.Liu T, Lizzi FL, Ketterling JA, Paul L, Kalisz A, Silverman RH, Kutcher GJ. Relationship of 2-D ultrasonic spectral parameters to the physical properties of soft tissue scatterers. Proc SPIE. 2004;5373:231–241. [Google Scholar]
- 27.Insana MF, Brown DG. In: Ultrasonic Sacttering in Biological Tissues. Shung KK, Thieme GA, editors. Academic Press; New York: 1993. [Google Scholar]
- 28.Bigelow TA, O’Brien WD., Jr A model for estimating ultrasound attenuation along the propagation path to the fetus from backscattered waveforms. J Acoust Soc Am. 2005;118:1210–1220. doi: 10.1121/1.1945564. [DOI] [PMC free article] [PubMed] [Google Scholar]
- 29.Parker KJ, Asztely MS, Lerner RM, Schenk EA, Waag RC. In-vivo measurements of ultrasound attenuation in normal or diseased liver. Ultrasound Med Biol. 1988;14:127–136. doi: 10.1016/0301-5629(88)90180-9. [DOI] [PubMed] [Google Scholar]
- 30.Lizzi FL, Ostromogilsky M, Feleppa EJ, Rorke MC, Yaremko MM. Relationship of ultrasonic spectral parameters to features of tissue microstructure. IEEE Trans Ultrason Ferroelectr Freq Control. 1987;34:319–329. doi: 10.1109/t-uffc.1987.26950. [DOI] [PubMed] [Google Scholar]
- 31.Chen JF, Zagzebski JA, Dong F, Madsen EL. Estimating the spatial autocorrelation function for ultrasound scatterers in isotropic media. Med Phys. 1998;25:648–655. doi: 10.1118/1.598247. [DOI] [PubMed] [Google Scholar]
- 32.Oelze ML, Zachary JF, O’Brien WD., Jr Characterization of tissue microstructure using ultrasonic backscatter: theory and technique for optimization using a Gaussian form factor. J Acoust Soc Am. 2002;112:1202–1211. doi: 10.1121/1.1501278. [DOI] [PubMed] [Google Scholar]
- 33.Lizzi FL, Astor M, Kalisz A, Liu T, Coleman DJ, Silverman RH, Ursea R, Rondeau MJ. Ultrasonic spectrum analysis of different scatterer morphologies; theory and very high frequency clinical results. In: Levy M, Schneider S, McAvoy BR, editors. Proc 1996 Ultrasonics Symp. IEEE; Piscataway NJ: 1997. pp. 1155–1159. [Google Scholar]
- 34.Faran JJJ. Sound scattering by solid cylinders and spheres. J Acoust Soc Am. 1951;23:405–418. [Google Scholar]
- 35.Wear KA. Measurement of dependence of backscatter coefficient from cylinders on frequency and diameter using focused transducers—with applications in trabecular bone. J Acoust Soc Am. 2004;115:66–72. doi: 10.1121/1.1631943. [DOI] [PMC free article] [PubMed] [Google Scholar]
- 36.O’Donnell M, Mimbs JW, Miller JG. The relationship between collagen and ultrasonic attenuation in myocardial tissue. J Acoust Soc Am. 1979;65:512–517. doi: 10.1121/1.382352. [DOI] [PubMed] [Google Scholar]
- 37.Hall TJ, Madsen EL, Dong F, Medina IR, Frank GR. Low-reflection-coefficient liquid interfaces for system characterization. Ultrasound Med Biol. 2001;27:1003–1010. doi: 10.1016/s0301-5629(01)00391-x. [DOI] [PubMed] [Google Scholar]
- 38.Yao LX, Zagzebski JA, Madsen EL. Backscatter coefficient measurements using a reference phantom to extract depth-dependent instrumentation factors. Ultrason Imaging. 1990;12:58–70. doi: 10.1177/016173469001200105. [DOI] [PubMed] [Google Scholar]
- 39.Liu T, Ennis RD, Schiff PB, Feleppa EJ, Lizzi FL, Kutcher GJ. Ultrasonic tissue-typing imaging for guiding dose escalation of prostate cancer radiotherapy. Int J Radiat Oncol Biol Phys. 2003;57:S336–S337. [Google Scholar]


