

Abstract
Purpose
To determine global mRNA expression levels in corneal and conjunctival epithelia and identify transcripts that exhibit preferential tissue expression.
Methods
cDNA samples derived from human conjunctival and corneal epithelia were hybridized in three independent experiments to a commercial oligonucleotide array representing more than 22,000 transcripts. The resultant signal intensities and microarray software transcript present/absent calls were used in conjunction with the local pooled error (LPE) statistical method to identify transcripts that are preferentially or exclusively expressed in one of the two tissues at significant levels (expression >1% of the β-actin level). EASE (Expression Analysis Systematic Explorer software) was used to identify biological systems comparatively overrepresented in either epithelium. Immuno-, and cytohistochemistry was performed to validate or expand on selected results of interest.
Results
The analysis identified 332 preferential and 93 exclusive significant corneal epithelial transcripts. The corresponding numbers of conjunctival epithelium transcripts were 592 and 211, respectively. The overrepresented biological processes in the cornea were related to cell adhesion and oxiredox equilibria and cytoprotection activities. In the conjunctiva, the biological processes that were most prominent were related to innate immunity and melanogenesis. Immunohistochemistry for antigen-presenting cells and melanocytes was consistent with these gene signatures. The transcript comparison identified a substantial number of genes that have either not been identified previously or are not known to be highly expressed in these two epithelia, including testican-1, ECM1, formin, CRTAC1, and NQO1 in the cornea and, in the conjunctiva, sPLA2-IIA, lipocalin 2, IGFBP3, multiple MCH class II proteins, and the Na-Pi cotransporter type IIb.
Conclusions
Comparative gene expression profiling leads to the identification of many biological processes and previously unknown genes that are potentially active in the function of corneal and conjunctival epithelia.
During the past decade, high throughput, high-density DNA microarrays have emerged as an efficient, powerful tool for providing useful information in the analysis of the global gene expression patterns in various tissues or biological systems.1–3 At the ocular surface, such studies have been performed in the corneal epithelium in the context of disease (e.g., diabetes) or growth conditions.4,5 The corneal (Co) and conjunctival (Cnj) epithelia are the main cellular components of the ocular surface.
These two distinct lineages derive from a small cohort of head ectodermal cells that become PAX6 positive at a relatively early developmental stage, before optical vesicle formation and organogenesis.6–8 Both ocular surface epithelia are stratified and nonkeratinizing and display a wet phenotype that comprises multiple secretory and absorptive features related to the phenotypes of simple epithelia. They functionally combine to establish the protective and light refractory properties of the ocular surface. Unlike the keratinizing epidermis, these epithelia constitutively express PAX-6 throughout life. Given the common developmental origin and a degree of structural similarity between corneal and conjunctival epithelia, it appears logical that identification of genes that are uniquely or preferentially expressed in either of these two lineages will provide clues to the mechanisms that specifically underlie each phenotype and distinguish one from the other.
Accordingly, in this study, we used a large oligonucleotide array system, representing more than half of the known human genes, to compare the molecular signatures of these two tissues. Approximately one half of the genes represented in the array are expressed in either the corneal or conjunctival systems. Ninety percent of the transcripts present in one of the systems are also present in the other at a comparable level of expression. The remaining 10% represent genes that are present in only one of the tissues or are expressed at substantially higher levels in one epithelium over the other.
Materials and Methods
Tissue Procurement and Processing
Whole human conjunctivae and human corneas were obtained from the National Disease Research Interchange (NDRI, Philadelphia, PA) and processed between 48 and 72 hours of death. No donor details apart from age, sex, and cause of death were released. The criteria for tissue acceptance and inclusion were donor ages between 25 and 65 years (irrespective of sex) and overt physical integrity of the epithelium over the central cornea, as revealed by trypan blue stain. Conjunctivae and whole corneas that excluded an outer strip of limbus (to ensure that the sample contains no cells derived from the adjacent conjunctiva) were quartered and incubated overnight at 4°C in conical tubes containing 5 mL of 0.5% Dispase dissolved in 1:1 Dulbecco’s modified minimal essential medium-Ham F-12 mix with slow (~20 cycles/min) end-to-end rocking. This treatment results in the spontaneous separation of intact epithelial sheets from the underlying stroma. The use of human tissue in the study was in accordance with the provisions of the Declaration of Helsinki and was sanctioned by the local Institutional Review Board.
RNA Preparation and Analysis
Epithelial sheets were manually transferred from the Dispase solution directly into lysis buffer, and total RNA was isolated (RNeasy Minikit; Qiagen Inc., Valencia, CA) and was further purified (RNeasy spin columns; Qiagen). The quantity and purity of each RNA sample was determined from the 260- and 280-nm absorbance, and its integrity was determined (2100 BioAnalyzer; Agilent Technologies Inc., Palo Alto, CA). Pooled RNA from two different corneal or conjunctival specimens (each one pair) was used for each replicate experiment. For both cornea and conjunctival tissues, there were one female and five male donors. This distribution merely resulted from the availability of donor tissue, as apportioned by the NDRI.
The pooled RNA was converted into cDNA with reverse transcriptase (SuperScript Choice; Invitrogen-Gibco, Bethesda, MD) and a modified oligodT primer (Affymetrix, Santa Clara, CA). The purified cDNA was subjected to in vitro transcription to generate biotin-labeled cRNA (ENZO BioArray HighYield Kit; Affymetrix).
Microarray Hybridization and Data Processing
Appropriately fragmented biotin-labeled cRNA was hybridized to an oligonucleotide microarray (HG-U133A GeneChips; Affymetrix), according to the manufacture’s protocol. Three separate experiments, each including one conjunctival and one corneal cRNA pool were performed. The HG-U133A array contains ~16, 000 unique GenBank accession numbers arranged in 22,283 probe sets (http://www.ncbi.nlm.nih.gov/Genbank; provided in the public domain by the National Center for Biotechnology Information, Bethesda, MD). Hybridized microarrays were stained with a streptavidin-phycoerythrin reagent, and fluorescence images were captured with a laser scanner (G2500A; Agilent).
Expression data were extracted from the fluorescence images (Microarray Analysis Suite, ver. 5.0 [MAS 5.0]; Affymetrix) to determine (1) the likelihood that the signal test result is significantly greater than the background signal, to determine whether the target transcript is present (P) or absent (A); and (2) a normalized signal intensity (SI) for each transcript. The data discussed in this publication have been deposited in the National Center for Biotechnology Information (NCBI) Gene Expression Omnibus (GEO, http://www.ncbi.nlm.nih.gov/geo/ provided in the public domain by the NCBI, Bethesda, MD) and are accessible through GEO Series accession number GSE5543. Annotation data were obtained from the Affymetrix Web site and by manual retrieval of selected transcripts from GenBank. Signal intensity values for all six individual data sets were subjected to unsupervised hierarchical clustering tests (conditional tree analysis) to assess the extent of global similarities and differences among the conjunctival and corneal replicates (GeneSpring; Silicon Genetics, Redwood City, CA).
To identify differentially expressed transcripts, the MAS 5.0-generated signal intensity triplicate data, without regard to present or absent status, was subjected to the local pooled error (LPE) statistical test, implemented in the R statistical programming language.9 Transcripts included within the 1% false discovery rate level of the LPE test were considered to have a significantly different expression level between the two tissues. The MAS 5.0 signal intensity and P or A calls for all these transcripts were then transferred into a spreadsheet program (Excel; Microsoft, Redmond, WA) for further analysis. A transcript was considered present when it received a P call in at least two of the replicates and significant (S) when the mean SI for all three replicates exceeded 1% of the mean SI for the three β-actin transcripts represented in the microarray. The results were used to build conjunctival PS transcript (CnjPS) and corneal PS transcript (CoPS) spreadsheets. The CnjPS was then used to generate CnjPS/CoA, a transcript list containing all conjunctival PS transcripts that were completely absent from the cornea (designated A call in all three experiments) and CnjPS>1.5×CoP, a transcript list comprising all conjunctival PS transcripts not included in CnjPS/CoA for which the mean SI is at least 1.5 times as large as the respective corneal value. In an analogous manner, CoPS was used to build cornea-exclusive (CoPS/CnjA) and cornea-preferred (CoPS>1.5×CnjP) transcript lists. In the subsequent text, we alternatively refer to the sequences included in these lists as conjunctiva (or cornea-)-exclusive and conjunctiva (or cornea-)-preferred transcripts, respectively.
Analysis of Differential Gene Expression
Differentially expressed conjunctival and corneal transcripts were imported into the Expression Analysis Systematic Explorer software (EASE10; http://david.niaid.nih.gov/david/ease/htm/ provided in the public domain by the National Institute of Allergy and Infectious Diseases [NIAID]), to examine functional gene clusters of the differentially expressed genes and/or to identify biological and molecular processes that are overrepresented in both tissues. EASE analysis with Bonferroni multiplicity correction probes each gene list against the corresponding population lists, and an EASE score is calculated for the likelihood of overrepresentation in the Gene Ontology Consortium annotation categories (GO biological process, GO cell component and GO molecular function; for sources of annotation, statistical methods, and EASE documentation, see the NIAID Web site).
Real-Time RT-PCR
Independent validation of relative expression levels by real-time PCR was performed with primer sets for all the connexin genes represented in the microarray. The RNA was obtained from epithelia mechanically scrapped from the corneal surface rather than from the Dispase release epithelial sheets and was treated with DNAase I (Qiagen) before its release from the purification columns (RNeasy Minikit; Qiagen), to eliminate possible contaminating genomic DNA, and was transcribed into cDNA (Omniscript reverse transcriptase; Qiagen). PCR reactions were performed with a SYBR green nucleic acid staining kit (Quantitect; Qiagen) in 384-well plates in a sequence-detection system (Prism 7900HT; Applied Biosystems [ABI], Foster City CA). For each primer pair, we used nine wells; three contained test cDNA, three contained a control sample in which the reverse transcriptase was omitted from the transcription reaction, and three contained human genomic DNA (Biochain, Hayward, CA). Products were analyzed by agarose (4%) gel chromatography. Relative amounts of the target genes in the corneal and conjunctival epithelia were then determined from the cycle thresholds according to the delta of delta Ct method using the average of the triplicate results. The following primer sets (forward/reverse) were used: Cx31, ccaacgtctgctacgacaactact/cacaggcctccgtgcttcttctt; Cx31.1, cccgacaccatgtgaagaaaa/tctcttgcctgcccctacct; Cx32, ggccgctccaatccac-ctt/gcggcgcagtatgtctttcag; Cx36, tcaaggaggtggaatgttatgtgt/tggcaggtcct-tgttacgaatct; Cx37, gagcactgatgggcacctatg/gctcgctggcacacaaaca; Cx40, gcctcccaacaaaacacagacaa/cataacgaacctggatgaaacctt; Cx43, cttttgatttc-cccgatgataacc/ggtgcactttctacagcaccttttt; Cx50, gaacccgaggtgggagagaa/ggcagcccttgctttgaca; Cx59, ttggggaaaatacaagttgaagaag/ataatcaggggca-gaagggagtc.
Cytohistochemistry
Freshly frozen human conjunctival (comprising predominantly of palpebral/forniceal conjunctival regions) and corneal cryosections (6–8 μm thick) were prepared for immunocytochemistry as previously described.11–15 After fixation with ice-cold methanol at −20°C for 10 minutes, the tissue sections were incubated for 2 hours (RT) with monoclonal mouse antibodies against the following antigens: human secretory PLA2 type II (sPLA2-IIA; 1:100 dilution; Upstate Biotechnology, Lake Placid, NY), tyrosine-related protein-1 (TYRP-1; clone Ta99; 1:200 dilution; GeneTex, Inc., San Antonio, TX), and HLA class II (DP, DQ, DR; 1:200; Serotec, Raleigh, NC). Bound antibodies were stained by a 1-hour incubation with 1:500 diluted Alexa Fluor 488–conjugated goat anti-mouse IgG (Invitrogen-Molecular Probes Inc., Eugene, OR). The slides were rinsed three times with phosphate-buffered saline (PBS) and covered with antifade medium (Vectashield; Vector Laboratories, Burlingame, CA). Fluorescence was visualized on a fluorescence microscope (Axiophot2; Carl Zeiss Meditec, Inc., Thornwood, NY).
To identify melanocytes, we subjected the paraffin-embedded sections to Fontana-Masson silver stain (American Master Tech Sci., Lodi, CA). Briefly, the sections were incubated for 45 minutes at 60°C in ammoniacal silver solution, for 2 minutes in 5% sodium thiosulfate and for 5 minutes in nuclear fast red stain. To examine dihydronicotinamide adenine dinucleotide phosphate (NADPH) reductase activity,16 –17 cryosections were incubated for 2 to 4 hours at 37°C in 0.1 M phosphate buffer (pH 7.4) containing 2.5 mM NADPH (Sigma-Aldrich, St. Louis, MO), 0.4 mM nitroblue tetrazolium (Sigma-Aldrich), and 10% dimethylsulfoxide. For control sections, NADPH was omitted from the incubation solution. The sections were rinsed in PBS, mounted in antifade medium (Vectashield; Vector Laboratories), and examined by light microscopy.
Results
RNA Quality
All RNA samples showed 260/280 nm absorption ratios in excess of 2.0. The RNA yields per single cornea and conjunctiva were approximately 6 and 20 μg, respectively. Based on cell counts independently obtained by trypsinization of epithelial sheets, these yields correspond to 4 to 6 pg RNA/cell, the typical RNA content of epithelial cells. Profiles (determined by Biochip; Agilent) were very similar in both tissues (Fig. 1). These profiles displayed a flat baseline, no significant tailing of the ribosomal RNA bands, and S18/S23 ratios of 1.5 to 1.8. RNA samples prepared from tissue that was released by scraping, instead of overnight Dispase incubation, showed poorer profiles (not shown), probably because of the presence of apoptotic or preapoptotic exfoliating surface cells, which are washed away during the Dispase incubation.
Figure 1.

Biochip profiles (Agilent, Palo Alto, CA) of total RNA isolated from Dispase-released corneal and conjunctival epithelia.
Microarray Analysis
Several empiric tests were used to evaluate the soundness of the raw data extracted (MAS 5.0; Affymetrix). The number of transcripts recognized by the software program as present in all three independent experiments was 9237 and 8905 for the conjunctiva and corneal epithelia, respectively. In addition, 1727 and 1633 further transcripts were identified in two of the experiments. Together, these transcripts account for approximately 50% (Cnj) and 48% (Co) of the total represented in the microarray. The number of P calls in each experiment and the median and average SIs (Table 1) or the distribution of twice present (PP) transcripts within the three experiments suggest no significant tissue bias in either of the replicates (not shown).
Table 1.
Number of P Calls and Median and Mean SIs and Distribution of Present (P), Marginal, (M) and Absent (A) Calls in Each of the Three Experiments
| Tissue | Experiment |
Mean | SD | |||
|---|---|---|---|---|---|---|
| 1 | 2 | 3 | ||||
| P calls (n) | Conjunctiva | 11,593 | 10,377 | 10,901 | 10,957 | 610 |
| Cornea | 10,125 | 11,101 | 10,687 | 10637 | 490 | |
| SI Median/Mean | Conjunctiva | 57.1/234 | 61.0/238 | 53.6/244 | 57.2/239 | 3.7/5 |
| Cornea | 57.7/242 | 56.7/226 | 53.4/244 | 55.9/238 | 2.2/10 | |
The microarray (HG-U133A; Affymetrix) contains three distinct probes for β-actin representing distinct sections of the gene. The similarity in average SIs for the spots representing the sequence segment closer to the polyA tail (bp 1201–1738) and the segment close to the starting codon (bp 50 –584), demonstrates that there was outstanding preservation of message length in the course of RNA isolation and generation of cRNA probes in experiments 1 and 2. There was some degradation, albeit of a similar degree in both tissues, in experiment 3 (Table 2). Because the probes for essentially all the transcripts in the Affymetrix microarray have been intentionally developed from the 3′ of the sequence, this degree of degradation is likely to have a minimal effect on our results. Similar results were obtained for the three GAPDH sequences present in the array (not shown). In addition, the similarity in the average SIs for conjunctival and corneal epithelia for this control gene indicates well-normalized SIs across the three experiments. Finally, conditional tree analyses of the whole transcript set or of the subsets of transcripts preferentially expressed in the Cnj and Co epithelia (Fig. 2) appropriately clustered the three conjunctival and corneal samples into two separate groups.
Table 2.
SIs for the Three β-Actin Sequence Zones Represented in the HG U133A Microarray in the Two Epithelia in the Three Experiments
| β-Actin Sequence* (bp Segment) | Conjunctival Epithelium |
Corneal Epithelium |
||||||
|---|---|---|---|---|---|---|---|---|
| Exp. 1 | Exp. 2 | Exp. 3 | Mean | Exp. 1 | Exp. 2 | Exp. 3 | Mean | |
| 50–584 (5′ end) | 4911 | 3998 | 1422 | 3444 | 3420 | 4992 | 1300 | 3237 |
| 645–1173 (center) | 5699 | 5218 | 3656 | 4858 | 4569 | 7009 | 3302 | 4960 |
| 1201–1738 (3′ end) | 5014 | 5037 | 5145 | 5066 | 4331 | 4434 | 4476 | 4414 |
| Ratio 3′/5′ | 1.02 | 1.26 | 3.62 | 1.47 | 1.27 | 0.89 | 3.44 | 1.36 |
| Averages ± SD | 5208 | 4751 | 3408 | 4456 936 |
4107 | 5478 | 3026 | 4204 1229 |
GenBank Accession X00351.1.
Figure 2.

Heat map for unsupervised hierarchical sample clustering of corneal and conjunctival transcripts with significant expression. Whole transcript sets for three conjunctival (Cnj1-3) and three corneal (Co1-3) samples were clustered by the unsupervised hierarchical sample method (Pearson correlation similarity measurement) to generate a sample tree (vertical lines). Note that the process has correctly clustered the two cell types. The 1228 statistically different transcripts (803 for the Cnj and 425 for the Co samples) are shown as individual horizontal color-coded lines within this sample tree, where color represents relative expression level in a base 10 logarithmic scale. The color code is shown in the right side bar.
Identification of Differentially Expressed Genes
The differential analysis described in the Methods section resulted in the identification of a large number of genes that were uniquely or preferentially expressed in both epithelia. Since genes expressed at very low levels may not yield measurable levels of actual protein, we decided to limit the analysis to transcripts with expression higher than 1% of the highly expressed β-actin gene. The methodology outlined in the Methods section led to the establishment of conjunctiva- and cornea-exclusive gene lists containing 93 and 339 transcripts, respectively, as well as 211 and 589 transcripts in the respective preferred gene lists. Genes included in the exclusive transcript sets were categorized according to relative SIs. For the preferred lists, to take into account both the level of expression and expression ratios as factors that would affect the phenotypic distinction between both tissues, we chose to use the product of the SI by the SI ratio (SI×R) as an index of significance.
The 25 genes with the highest SIs and SI×Rs, along with gene annotations are displayed in Tables 3 and 4, respectively. Note, that for many genes, the microarray chip (HG-U133A; Affymetrix) included two and even three transcript representations. In those instances in which a gene was represented in the array by more than one transcript set, only the transcript with the highest SI is displayed in Tables 3 and 4 (tissue ratios for these lower-SI transcripts were highly similar to those for the transcripts included in the tables). The top components of these lists include genes with high expression levels that have already been demonstrated, genes that are novel in these tissues, and genes of yet to be identified function. The full lists of the four exclusively or differentially expressed transcript sets have been included in the Appendix, online at http://www.iovs.org/cgi/content/full/48/5/2050/DC1. Updated functional GO annotations for each gene can be found at http://www.affymetrix.com/analysis/index.affx.
Table 3.
Transcripts Exhibiting the Highest Expression in the Co- and Cnj-Exclusive Sets
|
A. CoPS/CnjA Set | ||||
|---|---|---|---|---|
| Affymetrix | GB Accession | SI | Gene | Symbol |
| 202363_at | AF231124.1 | 1,136.5 | Testican1/sparc/osteonectin | SPOCK1 |
| 209365_s_at | U65932.1 | 1,106.9 | Extracellular matrix protein 1 | ECM1 |
| 218980_at | NM_025135.1 | 884.2 | Formin homology 2, dcm 3 | FHOD3 |
| 208789_at | BC004295.1 | 780.6 | Polymerase 1 and transcript release factor | PTRF |
| 201481_s_at | NM_002862.1 | 544.2 | Phosphorylase, glycogen; brain | PYGB |
| 213236_at | AK025495.1 | 528.3 | Sam and sh3, dmc 1 | SASH1 |
| 201108_s_at | BF055462 | 468.6 | Thrombospondin 1 | THBS1 |
| 201465_s_at | BC002646.1 | 417.3 | v-Jun avian sarcoma virus 17 oncogene homolog | JUN |
| 206423_at | NM_021146.1 | 414.8 | Angiopoietin-like 7 | ANGPTL7 |
| 205397_x_at | U76622.1 | 410.4 | Smad, mothers against dpp, h 3 | SMAD3 |
| 207114_at | NM_025261.1 | 383.4 | Lymphocyte antigen 6 complex, locus g6c | LY6G6C |
| 220291_at | NM_017711.1 | 379.8 | Glycerophosphodiester phosphodiesterase, dmc 2 | GDPD2 |
| 206207_at | NM_001828.3 | 341.7 | Charot-leyden crystal protein | CLC |
| 214961_at | A1818409 | 311.8 | KIAA0774 | KIAA0774 |
| 209469_at | BF939489 | 292.7 | Glycoprotein, m 6a | GPM6A |
| 203980_at | NM_001442.1 | 286.5 | Adipocyte fatty acid binding protein 4 | FABP4 |
| 213652_at | AU152579 | 286.1 | Proprotein convertase subtilisin/kexin, t 5 | PCSK5 |
| 216080_s_at | AC004770 | 276.3 | Fatty acid desaturase 3 | FADS3 |
| 221291_at | NM_025217.1 | 265.1 | U116-binding protein 2 | ULBP2 |
| 214680_at | BF674712 | 264.0 | Neurotrophic tyrosine kinase, receptor, t 2 | NTRK2 |
| 216603_at | AL365343.2 | 262.8 | Carrier family 7/cationic aa transporter, m 8 | SLC7A8 |
| 204726_at | NM_001257.1 | 258.1 | Cadherin 13, h-cadherin (heart) | CDH13 |
| 206706_at | NM_002527.2 | 241.3 | Neurotrophin 3 | NTF3 |
| 211891_s_at | AB042199.1 | 233.1 | Rho guanine nucleotide exchange factor (gef) 4 | ARHGEF4 |
| 202729_s_at | NM_000627.1 | 230.6 | Latent tgf beta binding protein 1 | LTBP1 |
|
B. CnjPS/CoA Set | ||||
| Affymetrix | GB Accession | SI | Gene | Symbol |
| 203649_s_at | NM_000300.1 | 6,529.8 | Phospholipase A2, group IIA (platelets, synovial) | PLA2G2A |
| 221872_at | A1669229 | 4,089.4 | Retinoic acid receptor responder (tazarotene induced) 1 | RARRES1 |
| 213611_at | BF726531 | 2,280.4 | Aquaporin 5 | AQP5 |
| 205009_at | NM_003225.1 | 1,892.4 | Trefoil factor 1 (estrogen-inducible sequence) | TFF1 |
| 204846_at | NM_000096.1 | 1,724.8 | Ceruloplasmin (ferroxidase) | CP |
| 218990_s_at | NM_005416.1 | 1,298.0 | Small proline-rich protein 3 | SPRR3 |
| 204213_at | NM_002644.1 | 1,044.4 | Polymeric immunoglobulin receptor | PIGR |
| 214063_s_at | AI073407 | 838.5 | Transferrin | TF |
| 209278_s_at | L27624.1 | 715.9 | Tissue factor pathway inhibitor 2 | TFP12 |
| 212671_s_at | BG397856 | 683.4 | Major histocompatibility complex, class II, DQ alpha 1* | HLA-DQA1 |
| 205044_at | NM_014211.1 | 679.5 | Gamma-aminobutyric acid (GABA) A receptor, p1 | GABRP |
| 205338_s_at | NM_001922.2 | 658.9 | Dopachrome tautomerase (tyrp 2)† | DCT |
| 217059_at | L13283.1 | 638.4 | Mucin 7, secreted | MUC7 |
| 210096_at | J02871.1 | 634.0 | Cytochrome P450, family 4, subfamily B, polypeptide 1 | CYP4B1 |
| 204623_at | NM_003226.1 | 608.7 | Trefoil factor 3 (intestinal) | TFF3 |
| 219630_at | NM_005764.1 | 571.2 | PDZK1 interacting protein 1 | PDZK1IP1 |
| 214566_at | NM_012390.1 | 532.8 | Submaxillary gland androgen regulated protein 3 h A | SMR3A |
| 203523_at | NM_002339.1 | 516.6 | Lymphocyte-specific protein 1, isoform 1* | LSP1 |
| 211656_x_at | M32577.1 | 453.7 | Major histocompatibility complex, class II, DQ beta 1* | HLA-DQB1 |
| 209498_at | X16354.1 | 449.7 | Carcinoembryonic antigen-related cell adhesion, m 1 | CEACAM1 |
| 206509_at | NM_002652.1 | 428.5 | Prolactin-induced protein | PIP |
| 209488_s_at | D84109.1 | 428.2 | RNA binding protein with multiple splicing | RBPMS |
| 215388_s_at | X56210.1 | 412.5 | Complement factor H -related protein 1 | CFH |
| 204897_at | AA89756 | 407.3 | Prostaglandin E receptor 4 (subtype EP4) | PTGER4 |
| 221667_s_at | AF133207.1 | 397.1 | Heat shock 22kDa protein 8 | HSPB8 |
Affymetrix, Santa Clara, CA. GB, GenBank; dmc, domain containing; m, member; h, homologue; t, type.
Leucocyte-associated gene.
Melanocyte-associated gene.
Table 4.
Transcripts Displaying the Highest SI×R Times SI in the Co- and Cnj-Preferred Sets
|
A. CojPS > 1.5 CoCNJ Transcripts Displaying the Highest CoPS/Cnj SI Ratio Times Co SIs | ||||||
|---|---|---|---|---|---|---|
| Affymetrix | Accession | SI | Ratio | SI × R × 10−3 | Gene | Symbol |
| 221204_s_at | NM_018058.1 | 5,275.2 | 35.5 | 187 | Cartilage acidic protein 1 | CRTAC1 |
| 210074_at | AF070448.1 | 6,529.5 | 24.9 | 163 | Cathepsin L2/V | CTSL2 |
| 201467_s_at | AI039874 | 4,366.9 | 26.5 | 116 | NAD(P)H dehydrogenase, quinone 1 | NQO1 |
| 207811_at | NM_000223.1 | 10,029.9 | 9.8 | 98 | Keratin 12 (Meesmann corneal dystrophy) | KRT12 |
| 214247_s_at | AU148057 | 2,311.4 | 36.2 | 84 | Dickkopf homolog 3 | DKK3 |
| 208699_x_at | BF696840 | 6,952.8 | 10.7 | 74 | Transketolase (Wernicke-Korsakoff synd.) | TKT |
| 201667_at | NM_000165.2 | 4,573.3 | 15.5 | 71 | Connexin 43 | GJAI |
| 220267_at | NM_019016.1 | 3,349.7 | 18.7 | 63 | Keratin 24 | KRT24 |
| 203571_s_at | NM_006829.1 | 9,858.8 | 4.6 | 46 | Adiponectin/adipose specific collagen-like | APM1 |
| 218002_s_at | NM_004887.1 | 5,828.2 | 7.8 | 46 | Chemokine (C-X-C motif) ligand 14 | CXCL14 |
| 204777_s_at | NM_002371.2 | 3,985.3 | 9.3 | 37 | Mal, T-cell differentiation protein | MAL |
| 205623_at | NM_000691.1 | 11,199.8 | 3.3 | 35 | Aldehyde dehydrogenase 3 family, m A1 | ALDH3A1 |
| 219736_at | NM_018700.1 | 782.0 | 38.8 | 30 | Tripartite motif-containing 36 | TRIM36 |
| 206642_at | NM_001942.1 | 2,237.5 | 11.1 | 25 | Desmoglein 1 | DSG1 |
| 217294_s_at | U88968.1 | 8,135.6 | 3.0 | 24 | Enolase 1, (alpha) | ENO1 |
| 200748_s_at | NM_002032.1 | 10,141.7 | 2.4 | 24 | Ferritin, heavy polypeptide 1 | FTH1 |
| 203851_at | NM_002178.1 | 4,844.0 | 4.7 | 23 | Insulin-like growth factor binding protein 6 | IGFBP6 |
| 221795_at | AI346341 | 986.4 | 22.6 | 22 | Neurotrophic tyrosine kinase, receptor, type 2 | NTRK2 |
| 211628_x_at | J04755.1 | 10,458.9 | 2.1 | 22 | Ferritin, heavy polypeptide pseudogene 1 | FTHP1 |
| 204753_s_at | A1810712 | 1,281.2 | 17.1 | 22 | Hepatic leukemia factor | HLF |
| 204326_x_at | NM_002450.1 | 6,870.3 | 3.2 | 22 | Metallothionein IX | MT1X |
| 212543_at | U83115.1 | 3,913.5 | 4.7 | 18 | Absent in melanoma 1 | AIM1 |
| 201162_at | NM_001553.1 | 2,596.0 | 6.6 | 17 | Insulin-like growth factor binding protein 7 | IGFBP7 |
| 212224_at | NM_000689.1 | 5,397.7 | 3.0 | 16 | Aldehyde dehydrogenase 1 family, m A1 | ALDHIA1 |
| 218309_at | NM_018584.1 | 2,598.2 | 5.8 | 15 | Calcium/calmodulin PK II inhibitor 1 | CAMK2N1 |
| 203781_at | NM_004891.1 | 14,039 | 3.38 | 14 | Mitochondrial ribosomal protein L33 | MRPL33 |
| 203074_at | NM_001630.1 | 13,457 | 2.46 | 13 | Annexin 8 | ANXA8 |
| 212185_x_at | NM_005953.1 | 13,433 | 2.42 | 13 | Metallothionein 2A | MT2A |
| 200872_at | NM_002966.1 | 12,788 | 2.68 | 13 | S100 calcium-bind protein A10 | S100A10 |
| 219093_at | NM_017933.1 | 12,397 | 20.63 | 12 | Hypothetical protein FLJ20701 | FLJ20701 |
| 211538_s_at | U56725.1 | 12,193 | 13.85 | 12 | Heat shock protein 70 | HSPA2 |
|
B. The CnjPS > 1.5 CoP Transcripts Displaying the Highest Cnj/Co SI Ratio Times Cnj SIs | ||||||
| Affymetrix | GB Accession | SI | Ratio | SI × R × 10−3 | Gene | Symbol |
| 212531_at | NM_005564.1 | 7,589.4 | 134.7 | 1022 | Lipocalin 2 (oncogene 24p3) | LCN2 |
| 210095_s_at | M31159.1 | 5,671.6 | 103.9 | 589 | Insulin-like growth factor binding protein 3 | IGFBP3 |
| 207935_s_at | NM_002274.1 | 8,808.5 | 62.5 | 551 | Keratin 13 | KRT13 |
| 203021_at | NM_003064.1 | 7,415.1 | 53.0 | 393 | Secretory leukocyte protease inhibitor | SLP1 |
| 201650_at | NM_002276.1 | 5,965.1 | 43.4 | 259 | Keratin 19 | KRT19 |
| 203535_at | NM_002965.2 | 7,321.1 | 35.2 | 258 | S100 calcium-binding protein A9 | S100A9 |
| 201884_at | NM_004363.1 | 2,535.4 | 69.4 | 176 | Carcinoembryonic antigen-related cell adhesion, m 5 | CEACAM5 |
| 211657_at | M18728.1 | 3,308.9 | 52.3 | 173 | Carcinoembryonic antigen-related cell adhesion, m 6 | CEACAM6 |
| 209619_at | K01144.1 | 4,577.2 | 35.5 | 163 | CD74, binds MHC class II protein invariant chain* | CD74 |
| 210982_s_at | M60333.1 | 2,738.9 | 59.2 | 162 | MHC class II HLA-DRA* | HLA-DRA |
| 206199_at | NM_006890.1 | 2,554.3 | 59.1 | 151 | Carcinoembryonic antigen-related cell adhesion m 7 | CEACAM7 |
| 204351_at | NM_005980.1 | 2,607.1 | 55.2 | 144 | S100 calcium-binding protein P | S100P |
| 202917_s_at | NM_002964.2 | 9,208.7 | 14.0 | 129 | S100 calcium-binding protein A8 (calgranulin A) | S100A8 |
| 209312_x_at | U65585.1 | 4,072.5 | 30.2 | 123 | MHC class II, DR beta 4* | HLA-DRB4 |
| 213240_s_at | X07695.1 | 7,173.0 | 10 | 71 | Keratin 4 | KTR4 |
| 203963_at | NM_001218.2 | 1,394.0 | 43.1 | 60 | Carbonic anhydrase XII | CA12 |
| 205694_at | NM_000550.1 | 1,581.9 | 35.7 | 56 | Tyrosinase-related protein 1† | TYRP1 |
| 209140_x_at | L42024.1 | 8,632.4 | 6.2 | 53 | MHC HLA-B39* | HLA-B39 |
| 204124_at | AF146796.1 | 1,370.3 | 37.7 | 52 | Sodium dependent phosphate transporter isoform IIb | NaPi-IIb |
| 203892_at | NM_006103.1 | 2,186.1 | 23.4 | 51 | WAP four-disulfide core domain 2 | WFDC2 |
| 213568_at | A1811298 | 1,112.7 | 40.0 | 44 | Odd-skipped related 2 (Drosophila) | OSR2 |
| 211990_at | M27487.1 | 2,043.1 | 21.2 | 43 | MHC class II DPw3-alpha-1 chain* | HLA-DPA1 |
| 211911_x_at | L07950.1 | 6,604.4 | 6.4 | 43 | MHC class I, B | HLA-B |
| 214459_x_at | M12679.1 | 7,628.3 | 5.4 | 41 | MHC class I, C | HLA-C |
| 211429_s_at | AF119873.1 | 1,287.3 | 31 | 40 | Serpin peptidase inhibitor (alpha-1 antiproteinase) m1 | SERPINA1 |
| 214022_s_at | AA749101 | 1,892.7 | 20.7 | 38 | Interferon induced transmembrane protein 1 (9–27) | IFITM1 |
| 213693_s_at | A1610869 | 1,091.7 | 35.1 | 38 | Mucin I, transmembrane | MUC1 |
| 204363_at | NM_001993.2 | 2,332.7 | 15.5 | 36 | Thromboplastin coagulation factor III | F3 |
| 204734_at | NM_002275.1 | 3,422.0 | 10.0 | 34 | Keratin 15 | KTR15 |
| 202357_s_at | gb:NM_001710.1 | 1,455.8 | 23.1 | 34 | Complement factor B | CFB |
Affymetrix, Santa Clara, CA. GB, GenBank.
Leucocyte associated gene.
Melanocyte associated gene.
Pathway Identification by EASE/Gene Ontology Analyses
Exclusive and preferentially expressed conjunctival and corneal transcripts were amalgamated into conjunctival and corneal selective transcript lists containing 803 and 432 transcripts, respectively.
Affymetrix gene identifiers for both sets were imported into EASE software, to identify gene ontologies that are overexpressed in either tissue. This comparative analysis yielded several biological processes that were overrepresented in the corneal epithelium, albeit with only moderate to low significance scores (Table 5). The only noticeable group included activities related to cellular handling of heavy metals. In contrast, EASE analysis of selective conjunctival genes led to the identification of a large number of processes associated with very high levels of significance (EASE scores up to 10−28 and 10−24, when subjected to Bonferroni adjustment). When the conjunctival statistically significant biological processes were organized into a GO ontology classification tree (http://www.geneontology.org), nearly all of the significantly overrepresented categories in the conjunctival epithelium coalesced within a narrow set of the physiological processes (Fig. 3) that includes two subcategories: genes related to responses to stimulus (stress, biotic, and external stimulus) and organismal physiological processes associated with immune mechanisms (humoral immune responses, including complement activation, antigen presentation, and processing). This level of statistical significance is probably attributable to the presence of a large number of HLA class II antigen mRNA within the conjunctival epithelium (Table 6; when more than one transcript is represented, only the highest SI representation has been included for each gene). Within the conjunctival epithelial layer, another category showing statistically significant overexpression related to melanin biosynthesis (Table 5).
Table 5.
Biological Processes Overrepresented within the Differentially Expressed Transcripts in the Conjunctival and Corneal Epithelium
| Corneal Epithelium 10−3 – 5 × 10⁻²* | Conjunctival Epithelium |
|
|---|---|---|
| 10−28 – 10−5* | 10−5 – 10−2* | |
| Cell adhesion | Response to biotic stimulus | Response to wounding |
| Transition metal ion homeostasis | Immune response | Inflammatory response |
| Copper ion homeostasis | Defense response | Innate immune response |
| Epidermal differentiation | Response to external stimulus | Complement activation, classic pathway |
| Heavy metal sensitivity/resistance | Antigen processing | |
| Posttranslational membrane targeting | Antigen presentation | Nucleosome assembly |
| Blood coagulation | Response to pest/pathogen/parasite | Regulation of catabolism |
| Hemostasis | Antigen processing, exogenous antigen via MHC-II | Regulation of proteolysis and peptidolysis |
| Ectoderm development | ||
| Histogenesis | Antigen presentation, exogenous antigen | Monocarboxylic acid transport |
| Alcohol metabolism | Antigen processing, endogenous antigen via MHC-I | Melanin biosynthesis |
| Fatty acid metabolism | Melanin biosynthesis from tyrosine | |
| Proteoglycan metabolism | Response to stress | |
| Di-, tri-valent inorganic cation | Humoral immune response | Blood coagulation |
| Homeostasis | Humoral defense mechanism (sensu vertebrata) | Melanin metabolism |
| Carbohydrate biosynthesis | mRNA cleavage | |
| Secretory pathway | Antigen presentation/endogenous antigen | Antimicrobial humoral response |
| Aldehyde metabolism | Complement activation | Hemostasis |
EASE score range.
Figure 3.
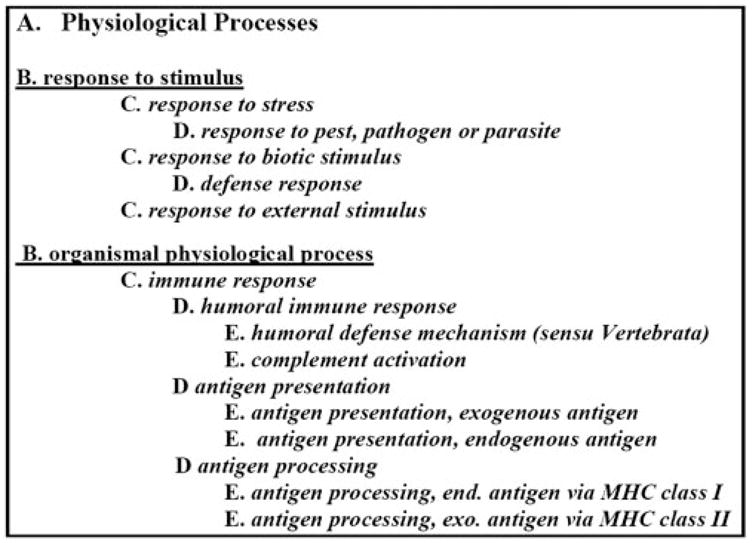
Hierarchical tree of GO ontology processes significantly overrepresented in the Cnj epithelium.
Table 6.
HLA Class II Antigen Expression
| Gene | Cnj SI | Co SI |
|---|---|---|
| MHC Class II | ||
| DRB1 | 4073 | 135 |
| DRB4 | 3984 | 137 |
| DRB1-0402 allele | 3324 | 85 |
| DRA | 3117 | 69 |
| DRB5 | 2793 | 118 |
| DPw3-alpha-1 chain | 2043 | 96 |
| DPB1 | 1300 | 67 |
| DQB/DRw6 | 1168 | 93 |
| DMA | 705 | 46 |
| DQ alpha 1 | 683 | 29 |
| DMB | 462 | 85 |
| DRB3 | 260 | 33 |
| Reference | ||
| GAPDH | 5487 | 8365 |
| β-Actin | 4456 | 4204 |
Validation of Microarray Expression Levels
To validate the intensities obtained by the microarray study by real-time PCR, we chose a set of connexin transcripts represented in the microarray. The results for genomic DNA confirmed the similar effectiveness of all these primers against their respective targets (Table 7). Gel chromatography confirmed that, in each case, the SYBR green signal represented the generation of a single amplicon with the correct molecular size (not shown). The comparison of the results from the Δ-Δ Ct and SI calculations demonstrate that the relative levels of expression and P/A status provided by the microarray accurately indicate the relative levels of expression reported by real-time PCR.
Table 7.
Relative Levels of Message for Connexin in the Corneal Epithelium as Calculated from Ct Values Obtained by Real-Time PCR or from the Microarray SIs
| Target | Human Genome Ct | Real-Time PCR |
Microarray |
||||
|---|---|---|---|---|---|---|---|
| Ct | ΔC | 2−ΔCt | SI/SIC×43 | SI | P Status | ||
| Connexin 43 | 25.36 | 26.14 | 0.00 | 1.00 | 1.00 | 4,573.27 | PPP |
| Connexin 31.1 | 25.99 | 28.67 | 2.53 | 0.17 | 0.12 | 534.53 | PPP |
| Connexin 31 | 25.07 | 29.08 | 2.94 | 0.13 | 0.09 | 413.07 | PPP |
| Connexin 36 | 26.56 | >40.00 | >15.86 | 0.00 | * | 83.57 | AAA |
| Connexin 59 | 24.67 | 38.96 | 12.82 | 0.00 | * | 55.50 | AAA |
| Connexin 37 | 25.28 | 37.26 | 11.12 | 0.00 | * | 34.10 | APA |
| Connexin 50 | 23.99 | >40.00 | >15.86 | 0.00 | * | 28.77 | AAA |
| Connexin 32 | 26.52 | 39.05 | 12.91 | 0.00 | * | 28.00 | AAA |
| Connexin 40 | 25.17 | 38.78 | 12.64 | 0.00 | * | 13.87 | AAA |
P Status: present or absent in experiments 1, 2, and 3 respectively.
Not relevant (transcript is absent).
Histochemistry
The presence and localization of some of the most prominent conjunctiva-specific genes identified by the corneal– conjunctival comparison were examined by indirect immunofluorescence. Secretory PLA2-IIA, the top gene in the Cnj epithelia-exclusive set was detectable at the protein level in conjunctival goblet cells and other superficial epithelial cells (Figs. 4A, 4B). Labeling occurred principally in granules accumulated in proximity to the plasma membrane that seem to be mobilized and excreted in Goblet cells undergoing active degranulation.
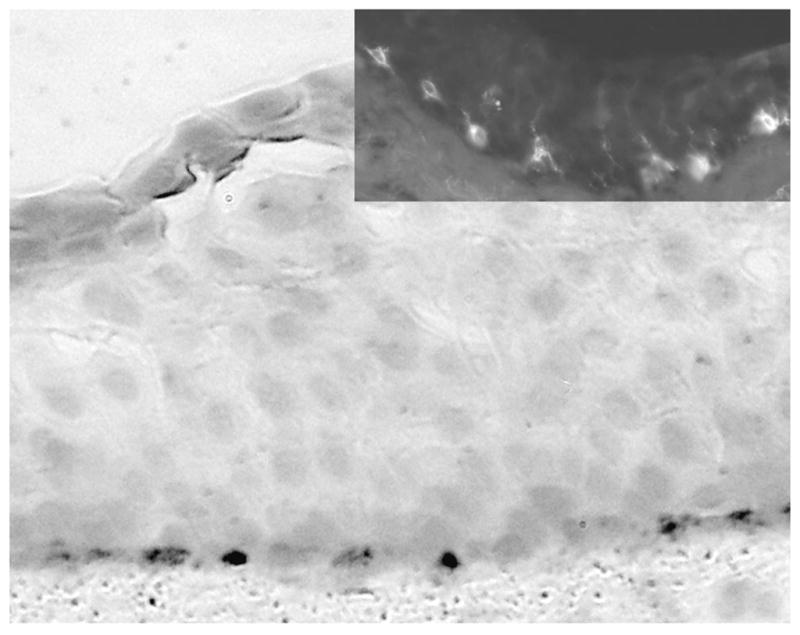
Figure 4.

Immunolocalization of sPLA2-IIA and HLA-II antigen presenting cells in freshly isolated human conjunctival epithelium. Cryosections (5–8 mm thick) fixed in ice-cold methanol were probed with anti-human sPLA2-IIA and HLA-II antibodies. (A) Low magnification demonstrates that the sPLA2-IIA protein predominantly labeled to immature and mature Goblet cells. (B) Higher magnification of the asterisk-marked area reveals that the sPLA2-IIA protein was distributed in both Goblet and non-Goblet cells in vesicular granules structures within or in proximity to the plasma membrane. In surface goblet cells undergoing degranulation, numerous vesicle profiles were observed migrating toward the cell secretory pit, whereas vesicular density at the membrane wall appeared markedly reduced. Cells containing very high levels of HLA-II antigen distributed between the Cnj epithelial stratum (C). (A, C, insets) Results for the cornea.
Cells expressing overly intense stain for HLA-class II antigen-presenting proteins (DR, DP, DQ) were intercalated throughout the suprabasal conjunctival epithelial cells (Fig. 4C). Neither of these proteins was expressed in the corneal epithelium (Figs. 4A, 4C, insets). Immunostaining for TYRP1 and the Fontana-Masson silver stain (Fig. 5) showed the abundant presence of melanocytes in the basal cell layer of the conjunctival epithelium. No staining was noted in the cornea (not shown).
Figure 5.
Fontana-Mason stain of the mucocutaneous zone of human conjunctiva and immunostain for TYRP1 in the palpebral conjunctiva (inset). Note the high frequency of stained cells in the basal layer in both cases.
Conversely, consistent with the existence of a highly expressed dehydrogenase reductase within the corneal preferred cohort (Table 4A), an enzymatic assay for NADH/NADPH reductase (diaphorase) activity revealed high reductase activity in the basal cells of the corneal epithelium (Fig. 6A), whereas activity throughout the conjunctival epithelium was minimal to nil (Fig. 6B).
Figure 6.
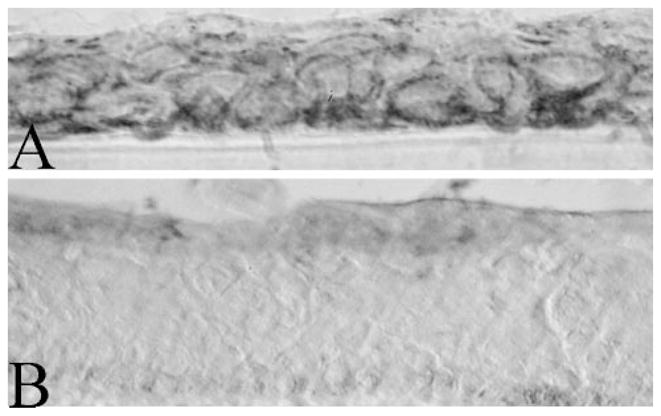
Distribution of NADPH reductase activity in the conjunctival and corneal epithelium. Activity was found in the basal stratum of the corneal epithelium (A) but not in the conjunctival epithelium (B).
Discussion
We have performed a microarray-based comparative global gene expression profiling (Affymetrix) of the two linings covering the ocular surface, the corneal and conjunctival epithelia. Given the embryologic and functionally related nature of these epithelial linings, the identification of genes and biological pathways that are specifically or preferentially expressed in either of these two tissues could selectively contribute to tissue phenotype and/or function. The use of SIs and PS/A calls (definitions for present and absent transcripts described in the Methods section), the LPE statistical approach, and a limitation of the analysis to substantially expressed transcripts led to the identification of 425 and 803 transcripts that were significantly overexpressed in the cornea and conjunctiva, respectively.
The most prominent global feature of the microarray data is the large excess of differentially expressed transcripts in the conjunctival set versus its corneal counterpart, and the high significance of EASE scores for multiple subcategories within the response to stimulus and organismal physiological processes (Fig. 3). This result probably reflects the multiphenotypic nature of the conjunctival epithelium.
Blood-derived intraepithelial antigen-presenting cells are numerous in this tissue (Fig. 4) and lymphocytes account for between 1% and 3% of the epithelial mass.18,19 Consistent with this preponderance of intraepithelial leukocytes, the differential analysis identified multiple blood cell– exclusive cell markers (Tables 3B, 4B). Of the 29 MHC class II transcripts represented in the HG-U133A microarray, 20 were present in the differential conjunctival sets. Table 6 displays the genes represented by these transcripts. Notably, the expression levels for some of the MHC transcripts match the expression levels of housekeeping genes such as β-actin and GAPDH. MHC class II genes are expressed only in cells from the hematopoietic lineage. Thus, the results imply that the intraepithelial cells in conjunctiva express class II genes at extraordinary levels. The very intense level of the immunostaining for HLA class II for DP, DQ, and/or DR subtypes (Fig. 4) is fully consistent with this conclusion. The presence of lymphocytes is reflected by the prominent location of the lymphocyte-specific protein 1 (LSP1) within the exclusive Cnj gene list (Table 3A). Likewise, the high concentration of melanocytes within the Cnj epithelial basal layer (Fig. 5) is reflected in the substantial representation of TYRP-1 and -2 (Tables 3, 4).
In contrast to conjunctival gene expression, the homogeneous cellular nature of the corneal epithelium generated minimal uncertainty as to the epithelial cell origin of transcripts that showed preferential expression in this tissue. EASE analysis indicated that the preferential expression of transcripts related to genes involved in the control of oxidative damage and heavy metal detoxification were the only biological processes that are more prominent in the corneal than in the conjunctival epithelia at a statistically significant level. The high levels of cornea-preferred genes of two well-known corneal proteins, aldolase dehydrogenase type 3AI and transketolase,20,21 and of an NADH/NADPH reductase (diaphorase), known under the aliases of NQO1,22 diaphorase 4, cytochrome b5 reductase, and dioxin-inducible menadione oxidoreductase, are likely to be the main contributors to the statistical significance of this EASE score (Tables 4A, 8). NQO1 has not been shown to be prominent in the cornea. Its function is to catalyze the two-electron reduction of quinones to hydroquinones, thereby preempting one-electron reduction of quinones by other reductases. The latter leads to the formation of detrimental reactive oxygen species. Overall, NQO1 could protect the cornea by directly scavenging free radicals or by allowing the rapid recovery of highly efficient free radical scavengers, such as ascorbate, to their active state.23,24 The biological significance of NQO1 is also indicated by the fact that its absence leads to severe neurologic disability due to deficiencies in lipid and steroid metabolism that cause toxic accumulations in microsomal compartments.25 Consistent with the NQO1 expression differences, our histochemical study of NADPH reductase indicates large differences in total oxiredox activity between corneal and conjunctival epithelia. Aldehyde dehydrogenase type 3A1 has recently been shown to be critical for corneal oxidative protection.26 Considering that the gene expression level for diaphorase/NQO1 is similar to, and the Co/CNJ ratio is larger than, those for ALDH3A1, a detailed study of the role(s) played by this diaphorase in corneal biology appears to be highly warranted.
Table 8.
SIs and Co/Cnj Ratios for Corneal Reductases and Dehydrogenases
| Gene | GB Accession | Co | Cnj | Co/Cnj |
|---|---|---|---|---|
| Reductases | ||||
| NQO1/cytochrome b5 red./NAD(P)H menadione reductase 1 | NM_000903 | 8053 | 734 | 11.0 |
| Ubiquinol-cytochrome c reductase complex | NM_013387 | 2446 | 1952 | 1.3 |
| NADH-coenzyme Q reductase | NM_004552 | 1501 | 1605 | 0.9 |
| Ubiquinol-cytochrome c reductase binding protein | NM_006294 | 1413 | 1542 | 0.9 |
| Ubiquinol-cytochrome c reductase, Rieske polypeptide 1 | BC000649 | 1411 | 1508 | 0.9 |
| Ubiquinol-cytochrome c reductase core protein I | NM_003365 | 1296 | 977 | 1.3 |
| Ubiquinol-cytochrome c reductase hinge protein (UQCRH) | NM_006004 | 1263 | 1135 | 1.1 |
| Dehydrogenases | ||||
| Aldehyde dehydrogenase 3A1 | NM_000691 | 11200 | 3535 | 3.2 |
| Glyceraldehyde-3-phosphate dehydrogenase | BE561479 | 10874 | 7559 | 1.4 |
| Lactate dehydrogenase A (LDHA) | NM_005566 | 7174 | 4339 | 1.7 |
| NADH dehydrogenase (Ubiquinone) 1, subcomplex unknown | NM_002494 | 2188 | 1452 | 1.5 |
| Lactate dehydrogenase B | BE042354 | 2164 | 1346 | 1.6 |
| NADH dehydrogenase (Ubiquinone) 1 beta subcomplex, 4 | NM_004547 | 2042 | 1687 | 1.2 |
| Malate dehydrogenase 1, NAD (soluble) (MDH1) | NM_005917 | 1408 | 1479 | 1.0 |
GB, GenBank.
In addition to global gene expression analyses, it is also valuable to focus on the significance of individual transcripts (Table 8). The highest-expressing cornea-exclusive gene is testican 1. This large secreted multidomain proteoglycan has been shown to have strong inhibitory activity against cathepsin and activation of matrix metalloproteinases (MMPs).27,28 The corneal epithelium expresses multiple MMPs and cathepsins, in particular, cathepsin L/V2,29 which in itself shows a high corneal preference (Table 4A). Thus, it is intriguing to consider the possibility of a role for testican-1 in locally protecting the corneal epithelial cell surface membrane against the activity of its own proteolytic agents. The third gene in the cornea-exclusive list is a formin isoform. Formins are a conserved family of actin nucleators responsible for the assembly of diverse actin structures such as cytokinetic rings and filopodia. Formin binding to the barbed end of actin filaments increases filament flexibility and has been documented to cause critical modulation of cell adhesion and cell motility. The exclusive presence of a certain formin isoform in the corneal epithelium is likely to play a weighty role in the phenotypic difference of this tissue with that of its ocular surface counterpart. It will be interesting to assess formin’s contribution to the rapid migration in corneal wound healing and response to physical pressure.30 Another intriguing and unexpected corneal gene is cartilage acidic protein 1 (CRTAC1; Table 4A), a matrix component with high affinity for integrins. It is profusely expressed in cartilage, a mostly avascular tissue, but it is absent in most other organs and tissues examined, including brain, liver, and muscle.31 Its corneal expression may indicate that its function is somehow related to the avascular environs. Adiponectin, is another cornea-preferred, highly expressed gene. In a fashion similar to CRTAC1, it codes for a protein that until now has been believed to be specific for one cell type, the adipocyte.32 Adiponectin is a secreted protein with multiple systemic functions including growth-promoting activity in epithelial cells.33,34 If indeed, adiponectin is secreted by the corneal epithelium, it may function as part of the proliferation promoter autocrine loop. Other valuable corneal preferred genes to be considered for future investigations are chemokine CXCL14 (BRAK) and Dickkoft 3 (DKK3). CXCL14 plays a central role in monocyte attraction and their in situ conversion to Langerhans cells.35 Thus, it could be important for the ontogeny of these immunosurveillance cells in the limbus. DKK proteins are involved in the regulation of the WNT-β-catenin cascade, which, in turn may control developmental cell fate36 and the expression of connexin43, another highly expressed corneal preferred transcript (Table 4A). DKK2, which is not expressed in the mature human cornea (Table 9), has recently been found to be a critical component of corneal epithelial development in mouse.37 Thus, it is possible that in humans, this role is performed by DKK3.
Table 9.
Expression of DKK Isoforms
| Gene | GB Accession | Co | Cnj | Co/Cnj |
|---|---|---|---|---|
| DKK1 | NM_012242.1 | 17.4 | 18.6 | 0.9 |
| DKK2 | NM_014421.1 | 11.5 | 4.5 | 2.6 |
| DKK3 | NM_013253.1 | 2311.3 | 64.1 | 36.0 |
| DKK4 | NM_014420.1 | 71.6 | 100.3 | 0.7 |
Bold, significant expression. GB, GenBank.
In the case of the conjunctival epithelium, the presence of substantial levels of infiltrated leukocytes and resident melanocytes implies that for most transcripts, confirmation of a bona fide epithelial origin will require specific spatial techniques such as in situ hybridization and/or immunohistochemistry. In the present study, we performed such a test for sPLA2-IIA, a natural antimicrobial protein in tears38,39 and a systemic proinflammatory mediator40 that occupies the top position in the list of conjunctiva-expressed transcripts not expressed in the cornea (Table 3B). Immunohistology showed that the protein is abundantly expressed in the conjunctival Goblet cells. The stain displays spatial patterns and features suggestive of a secretory process (Fig. 4). To our knowledge, this is the first report of a nonmucinous secretion by mucin-rich cells anywhere in the body. Thus, the potential role(s) of this sPLA2n in Goblet cell biology and secretory activity warrant further study. The more tenuous expression in other differentiated cells is consistent with the identification of high levels of gene and polypeptide expression of sPLA2 class II, in a human conjunctival epithelial cell line that does not form mature Goblet cells.41 Other very prominent conjunctival novel genes within the conjunctival lists that deserve future attention include lipocalin 2, an iron sequester protein that is part of tissue innate immunity42; insulin-like growth factor binding protein-3 (IGFBP3), a multifunctional soluble protein that regulates the potent mitogenic and antiapoptotic effects of IGF-I and -II and has been recently shown to have decreased expression in pterygium43; RARRES1, a retinoid receptor; trefoil factor 1, an estrogen-inducible protein; ceruloplasmin (Table 3B), and the Na-dependent phosphate transporter isoform NaPi-IIb (Table 4B). In the kidney proximal tubule and intestine, this transporter is localized at apical membranes, where it determines reabsorption or uptake of phosphate toward the circulation.44,45 A similar role in the conjunctiva implies vigorous phosphate removal from the tears, which may be important in corneal protection; recent studies have shown that phosphate catalyzes corneal calcification.46,47
For some proteins (e.g., IGFBPs48) the two tissues displayed isoform expression differences. These secreted, high-affinity, IGF-binding proteins act as modulators of IGF bioavailability. Differential patterns of spatial and temporal expression in dynamic processes such a development and cellular transformation, indicate subtle differences in function. The corneal epithelium expresses high levels of the isoforms 6 and 7 (Table 4A). These isoforms are poorly expressed in the conjunctival epithelium which, conversely, shows a selectivity for isoform 3 (Table 4B).
Finally, in relation to keratins, the fundamental markers of epithelial phenotype, the microarray measurements yielded, as expected, high expression levels of the two cornea-specific keratins K3 and K1249 (Table 10). In addition, consistent with its cornea-specific classification, K3 was absent from the conjunctiva. K12, however, was expressed in this tissue at substantial levels. This result reflects the fact that patches of K12-expressing cells are intercalated within the conjunctival epithelium. As proposed by Kawasaki et al.,50 the simplest interpretation of the patch pattern is the existence of a misdirected cell migration of corneal epithelial precursors from the limbus toward the conjunctiva. However, examination of other genes highly expressed in the cornea does not fit such a model. For instance, K3, testican-1, and ECM-1 transcripts well expressed in the cornea, are not found at all within the conjunctival set (Table 3A). In addition, the conjunctiva/cornea SI ratios for certain transcripts showing abundant corneal expression (e.g., cathepsin L2/V and NQO1 in Table 4A) are much lower than those for K12. Thus, none of those genes are substantially expressed within the K12-positive cells in the conjunctival cells. Therefore, the possibility that the cells in the K12-positive patches are not corneal cells but rather K12-expressing conjunctival cells requires attention. Other keratins also provide interesting distribution patterns. The simple epithelial keratin type 18 was moderately expressed by both tissues whereas K4, K13, K15, and K19 expression occurred at very high levels in the conjunctival domain only. These gene expression patterns in humans are generally coincident with reports of keratin protein expression in the ocular surface of rodents.51 Finally, K19 has been mentioned occasionally as a potential limbal stem cell marker.52 Given the conjunctival levels observed (Table 4B), it is unlikely that it plays such a function in the conjunctiva.
Table 10.
Keratin Gene Expression Levels in Human Cornea and Conjunctiva
| K2a | K3 | K4 | K5 | K6 | K6b | K6f | K8 | K10 | K12 | K13 | K14 | K15 | K17 | K18 | K19 | |
|---|---|---|---|---|---|---|---|---|---|---|---|---|---|---|---|---|
| Co | 95 | 1,191 | 708 | 13,752 | 511 | 176 | 694 | 220 | 1,121 | 10,030 | 141 | 5,804 | 341 | 242 | 1,679 | 137 |
| Cnj | 174 | 21 | 7,173 | 8,909 | 775 | 425 | 976 | 757 | 1,643 | 1,029 | 8,809 | 4,338 | 3,422 | 1,358 | 1,441 | 5,965 |
| R | 1.83 | 0.02 | 10.1 | 0.65 | 1.5 | 2.41 | 1.41 | 3.44 | 1.47 | 0.10 | 62.4 | 0.75 | 10.0 | 5.61 | 0.86 | 43.5 |
Corneal keratins (Co/Cnj > 5) and Cnj keratins (Co/Cnj < 0.2) are shown in bold and bold italic, respectively. K1, K7, and K16 (SIs <100) are not shown.
In summary, our microarray analysis of the embryologically related, yet phenotypically disparate corneal and conjunctival epithelia, allowed the identification of a large number of novel conjunctiva- and cornea-preferred transcripts for proteins that can have important roles in the ocular epithelial physiology of each of these tissues.
Acknowledgments
Supported by National Eye Institute Grants R01EY014878 and R03EY015132 (JMW).
The authors thank Tearina Chu, Director, Mount Sinai Microarray Facility, for helpful assistance.
Footnotes
Disclosure: H.C. Turner, None; M.T. Budak, None; M.A. Murat Akinci, None; J.M. Wolosin, None
References
- 1.Arcellana-Panlilio M, Robbins SM. Cutting-edge technology. I. Global gene expression profiling using DNA microarrays. Am J Physiol. 2002;282:G397–G402. doi: 10.1152/ajpgi.00519.2001. [DOI] [PubMed] [Google Scholar]
- 2.Verducci JS, Melfi VF, Lin S, Wang Z, Roy S, Sen CK. Microarray analysis of gene expression: considerations in data mining and statistical treatment. Physiol Genomics. 2006;25:355–363. doi: 10.1152/physiolgenomics.00314.2004. [DOI] [PubMed] [Google Scholar]
- 3.Schena M, Shalon D, Davis RW, Brown PO. Quantitative monitoring of gene expression patterns with a complementary DNA microarray. Science. 1995;270:467–470. doi: 10.1126/science.270.5235.467. [DOI] [PubMed] [Google Scholar]
- 4.Saghizadeh M, Kramerov AA, et al. Proteinase and growth factor alterations revealed by gene microarray analysis of human diabetic corneas. Invest Ophthalmol Vis Sci. 2005;46:3604–3615. doi: 10.1167/iovs.04-1507. [DOI] [PMC free article] [PubMed] [Google Scholar]
- 5.Sun CC, Su Pang JH, Cheng CY, et al. Interleukin-1 receptor antagonist (IL-1RA) prevents apoptosis in ex vivo expansion of human limbal epithelial cells cultivated on human amniotic membrane. Stem Cells. 2006;24:2130–2139. doi: 10.1634/stemcells.2005-0590. [DOI] [PubMed] [Google Scholar]
- 6.Davis JA, Reed RR. Role of Olf-1 and Pax-6 transcription factors in neurodevelopment. J Neurosci. 1996;16:5082–5094. doi: 10.1523/JNEUROSCI.16-16-05082.1996. [DOI] [PMC free article] [PubMed] [Google Scholar]
- 7.Koroma BM, Yang JM, Sundin OH. The Pax-6 homeobox gene is expressed throughout the corneal and conjunctival epithelia. Invest Ophthalmol Vis Sci. 1997;38:108–120. [PubMed] [Google Scholar]
- 8.Nishina S, Kohsaka S, Yamaguchi Y, et al. PAX6 expression in the developing human eye. Br J Ophthalmol. 1999;83:723–727. doi: 10.1136/bjo.83.6.723. [DOI] [PMC free article] [PubMed] [Google Scholar]
- 9.Jain N, Thatte J, Braciale T, Ley K, O’Connell M, Lee JK. Local-pooled-error test for identifying differentially expressed genes with a small number of replicated microarrays. Bioinformatics. 2003;19:1945–1951. doi: 10.1093/bioinformatics/btg264. [DOI] [PubMed] [Google Scholar]
- 10.Hosack DA, Dennis G, Jr, Sherman BT, Lane HC, Lempicki RA. Identifying biological themes within lists of genes with EASE. Genome Biol. 2003;4:R70. doi: 10.1186/gb-2003-4-10-r70. [DOI] [PMC free article] [PubMed] [Google Scholar]
- 11.Turner HC, Alvarez LJ, Candia OA, Bernstein AM. Characterization of serotonergic receptors in rabbit, porcine and human conjunctivae. Curr Eye Res. 2003;27:205–215. doi: 10.1076/ceyr.27.4.205.16600. [DOI] [PubMed] [Google Scholar]
- 12.Oen H, Cheng P, Turner HC, Alvarez LJ, Candia OA. Identification and localization of aquaporin 5 in the mammalian conjunctival epithelium. Exp Eye Res. 2006;83:995–998. doi: 10.1016/j.exer.2006.04.006. [DOI] [PubMed] [Google Scholar]
- 13.Turner HC, Bernstein A, Candia OA. Presence of CFTR in the conjunctival epithelium. Curr Eye Res. 2002;24:182–187. doi: 10.1076/ceyr.24.3.182.8297. [DOI] [PubMed] [Google Scholar]
- 14.Wolosin JM, Budak MT, Akinci MA. Ocular surface epithelial and stem cell development. Int J Dev Biol. 2004;48:981–991. doi: 10.1387/ijdb.041876jw. [DOI] [PubMed] [Google Scholar]
- 15.Budak MT, Alpdogan OS, Zhou M, Lavker RM, Akinci MA, Wolosin JM. Ocular surface epithelia contain ABCG2-dependent side population cells exhibiting features associated with stem cells. J Cell Sci. 2005;118:1715–1724. doi: 10.1242/jcs.02279. [DOI] [PMC free article] [PubMed] [Google Scholar]
- 16.Sandell JH. NADPH diaphorase cells in the mammalian inner retina. J Comp Neurol. 1985;238:466–472. doi: 10.1002/cne.902380410. [DOI] [PubMed] [Google Scholar]
- 17.Sandell JH. NADPH diaphorase histochemistry in the macaque striate cortex. J Comp Neurol. 1986;251:388–397. doi: 10.1002/cne.902510309. [DOI] [PubMed] [Google Scholar]
- 18.Gomes JA, Dua HS, Rizzo LV, Nishi M, Joseph A, Donoso LA. Ocular surface epithelium induces expression of human mucosal lymphocyte antigen (HML-1) on peripheral blood lymphocytes. Br J Ophthalmol. 2004;88:280–285. doi: 10.1136/bjo.2003.017731. [DOI] [PMC free article] [PubMed] [Google Scholar]
- 19.Gomes JA, Jindal VK, Gormley PD, Dua HS. Phenotypic analysis of resident lymphoid cells in the conjunctiva and adnexal tissues of rat. Exp Eye Res. 1997;64:991–997. doi: 10.1006/exer.1997.0297. [DOI] [PubMed] [Google Scholar]
- 20.Pappa A, Estey T, Manzer R, Brown D, Vasiliou V. Human aldehyde dehydrogenase 3A1 (ALDH3A1): biochemical characterization and immunohistochemical localization in the cornea. Biochem J. 2003;376:615–623. doi: 10.1042/BJ20030810. [DOI] [PMC free article] [PubMed] [Google Scholar]
- 21.Sax CM, Salamon C, Kays WT, et al. Transketolase is a major protein in the mouse cornea. J Biol Chem. 1996;271:33568–33574. doi: 10.1074/jbc.271.52.33568. [DOI] [PubMed] [Google Scholar]
- 22.Vasiliou V, Ross D, Nebert DW. Update of the NAD(P)H:quinone oxidoreductase (NQO) gene family. Hum Genomics. 2006;2:329–335. doi: 10.1186/1479-7364-2-5-329. [DOI] [PMC free article] [PubMed] [Google Scholar]
- 23.Gomez-Diaz C, Rodriguez-Aguilera JC, Barroso MP, et al. Antioxidant ascorbate is stabilized by NADH-coenzyme Q10 reductase in the plasma membrane. J Bioenerg Biomembr. 1997;29:251–257. doi: 10.1023/a:1022410127104. [DOI] [PubMed] [Google Scholar]
- 24.Kurian JR, Bajad SU, Miller JL, Chin NA, Trepanier LA. NADH cytochrome b5 reductase and cytochrome b5 catalyze the microsomal reduction of xenobiotic hydroxylamines and amidoximes in humans. J Pharmacol Exp Ther. 2004;311:1171–1178. doi: 10.1124/jpet.104.072389. [DOI] [PubMed] [Google Scholar]
- 25.Jaffe ER. Enzymopenic hereditary methemoglobinemia: a clinical/biochemical classification. Blood Cells. 1986;12:81–90. [PubMed] [Google Scholar]
- 26.Estey T, Piatigorsky J, Lassen N, Vasiliou V. ALDH3A1: a corneal crystallin with diverse functions. Exp Eye Res. 2007;84:3–12. doi: 10.1016/j.exer.2006.04.010. [DOI] [PubMed] [Google Scholar]
- 27.Edgell CJ, BaSalamah MA, Marr HS. Testican-1: a differentially expressed proteoglycan with protease inhibiting activities. Int Rev Cytol. 2004;236:101–122. doi: 10.1016/S0074-7696(04)36003-1. [DOI] [PubMed] [Google Scholar]
- 28.Hausser HJ, Decking R, Brenner RE. Testican-1, an inhibitor of pro-MMP-2 activation, is expressed in cartilage. Osteoarthritis Cartilage. 2004;12:870–877. doi: 10.1016/j.joca.2004.07.008. [DOI] [PubMed] [Google Scholar]
- 29.Kenney MC, Chwa M, Atilano SR, et al. Increased levels of catalase and cathepsin V/L2 but decreased TIMP-1 in keratoconus corneas: evidence that oxidative stress plays a role in this disorder. Invest Ophthalmol Vis Sci. 2005;46:823–832. doi: 10.1167/iovs.04-0549. [DOI] [PubMed] [Google Scholar]
- 30.Faix J, Grosse R. Staying in shape with formins. Dev Cell. 2006;10:693–706. doi: 10.1016/j.devcel.2006.05.001. [DOI] [PubMed] [Google Scholar]
- 31.Zhao GQ, Zhou X, Eberspaecher H, Solursh M, de Crombrugghe B. Cartilage homeoprotein 1, a homeoprotein selectively expressed in chondrocytes. Proc Natl Acad Sci USA. 1993;90:8633–8637. doi: 10.1073/pnas.90.18.8633. [DOI] [PMC free article] [PubMed] [Google Scholar]
- 32.Scherer PE, Williams S, Fogliano M, Baldini G, Lodish HF. A novel serum protein similar to C1q, produced exclusively in adipocytes. J Biol Chem. 1995;270:26746–26749. doi: 10.1074/jbc.270.45.26746. [DOI] [PubMed] [Google Scholar]
- 33.Mendez-Sanchez N, Chavez-Tapia NC, Zamora-Valdes D, Uribe M. Adiponectin, structure, function and pathophysiological implications in non-alcoholic fatty liver disease. Mini Rev Med Chem. 2006;6:651–656. doi: 10.2174/138955706777435689. [DOI] [PubMed] [Google Scholar]
- 34.Ogunwobi OO, Beales IL. Adiponectin stimulates proliferation and cytokine secretion in colonic epithelial cells. Regul Pept. 2006;134:105–113. doi: 10.1016/j.regpep.2006.02.001. [DOI] [PubMed] [Google Scholar]
- 35.Schaerli P, Willimann K, Ebert LM, Walz A, Moser B. Cutaneous CXCL14 targets blood precursors to epidermal niches for Langerhans cell differentiation. Immunity. 2005;23:331–342. doi: 10.1016/j.immuni.2005.08.012. [DOI] [PubMed] [Google Scholar]
- 36.van der Horst G, van der Werf SM, Farih-Sips H, van Bezooijen RL, Lowik CW, Karperien M. Downregulation of Wnt signaling by increased expression of Dickkopf-1 and -2 is a prerequisite for late-stage osteoblast differentiation of KS483 cells. J Bone Miner Res. 2005;20:1867–1877. doi: 10.1359/JBMR.050614. [DOI] [PubMed] [Google Scholar]
- 37.Mukhopadhyay M, Gorivodsky M, Shtrom S, et al. Dkk2 plays an essential role in the corneal fate of the ocular surface epithelium. Development. 2006;133:2149–2154. doi: 10.1242/dev.02381. [DOI] [PubMed] [Google Scholar]
- 38.Buckland AG, Wilton DC. The antibacterial properties of secreted phospholipases A(2) Biochim Biophys Acta. 2000;1488:71–82. doi: 10.1016/s1388-1981(00)00111-6. [DOI] [PubMed] [Google Scholar]
- 39.Moreau JM, Girgis DO, Hume EB, Dajcs JJ, Austin MS, O’Callaghan RJ. Phospholipase A(2) in rabbit tears: a host defense against Staphylococcus aureus. Invest Ophthalmol Vis Sci. 2001;42:2347–2354. [PubMed] [Google Scholar]
- 40.Touqui L, Wu YZ. Interaction of secreted phospholipase A2 and pulmonary surfactant and its pathophysiological relevance in acute respiratory distress syndrome. Acta Pharmacol Sin. 2003;24:1292–1296. [PubMed] [Google Scholar]
- 41.Hori Y, Spurr-Michaud SJ, Russo CL, Argueso P, Gipson IK. Effect of retinoic acid on gene expression in human conjunctival epithelium: secretory phospholipase A2 mediates retinoic acid induction of MUC16. Invest Ophthalmol Vis Sci. 2005;46:4050–4061. doi: 10.1167/iovs.05-0627. [DOI] [PMC free article] [PubMed] [Google Scholar]
- 42.Berger T, Togawa A, Duncan GS, et al. Lipocalin 2-deficient mice exhibit increased sensitivity to Escherichia coli infection but not to ischemia-reperfusion injury. Proc Natl Acad Sci USA. 2006;103:1834–1839. doi: 10.1073/pnas.0510847103. [DOI] [PMC free article] [PubMed] [Google Scholar]
- 43.Wong YW, Chew J, Yang H, Tan DT, Beuerman R. Expression of insulin-like growth factor binding protein-3 in pterygium tissue. Br J Ophthalmol. 2006;90:769–772. doi: 10.1136/bjo.2005.087486. [DOI] [PMC free article] [PubMed] [Google Scholar]
- 44.Xu L, Dixit MP, Chen R, et al. Effects of angiotensin II on NaPi-IIa co-transporter expression and activity in rat renal cortex. Biochim Biophys Acta. 2004;15(1667):114–121. doi: 10.1016/j.bbamem.2004.09.005. [DOI] [PubMed] [Google Scholar]
- 45.Radanovic T, Wagner CA, Murer H, Biber J. Regulation of intestinal phosphate transport. I. Segmental expression and adaptation to low-P(i) diet of the type IIb Na(+)-P(i) cotransporter in mouse small intestine. Am J Physiol. 2005;288:G496–G500. doi: 10.1152/ajpgi.00167.2004. [DOI] [PubMed] [Google Scholar]
- 46.Schrage NF, Schlossmacher B, Aschenberner W, et al. Phosphate buffer in alkali eye burns as an inducer of experimental corneal calcification. Burns. 2001;27:459–464. doi: 10.1016/s0305-4179(00)00148-0. [DOI] [PubMed] [Google Scholar]
- 47.Bernauer W, Thiel MA, Langenauer UM, Rentsch KM. Phosphate concentration in artificial tears. Graefes Arch Clin Exp Ophthalmol. 2006;244:1010–1014. doi: 10.1007/s00417-005-0219-9. [DOI] [PubMed] [Google Scholar]
- 48.Hwa V, Oh Y, Rosenfeld RG. The insulin-like growth factor-binding protein (IGFBP) superfamily. Endocr Rev. 1999;20:761–787. doi: 10.1210/edrv.20.6.0382. [DOI] [PubMed] [Google Scholar]
- 49.Kinoshita S, Adachi W, Sotozono C, et al. Characteristics of the human ocular surface epithelium. Prog Retin Eye Res. 2001;20:639–673. doi: 10.1016/s1350-9462(01)00007-6. [DOI] [PubMed] [Google Scholar]
- 50.Kawasaki S, Tanioka H, Yamasaki K, Yokoi N, Komuro A, Kinoshita S. Clusters of corneal epithelial cells reside ectopically in human conjunctival epithelium. Invest Ophthalmol Vis Sci. 2006;47:1359–1367. doi: 10.1167/iovs.05-1084. [DOI] [PubMed] [Google Scholar]
- 51.Kasper M. Patterns of cytokeratins and vimentin in guinea pig and mouse eye tissue: evidence for regional variations in intermediate filament expression in limbal epithelium. Acta Histochem. 1992;93:319–332. doi: 10.1016/s0065-1281(11)80231-x. [DOI] [PubMed] [Google Scholar]
- 52.Schlotzer-Schrehardt U, Kruse FE. Identification and characterization of limbal stem cells. Exp Eye Res. 2005;81:247–264. doi: 10.1016/j.exer.2005.02.016. [DOI] [PubMed] [Google Scholar]