


Abstract
The human APOBEC3 proteins are DNA cytidine deaminases that impede the replication of many different transposons and viruses. The genes that encode APOBEC3A, APOBEC3B, APOBEC3C, APOBEC3D, APOBEC3F, APOBEC3G and APOBEC3H were generated through relatively recent recombination events. The resulting high degree of inter-relatedness has complicated the development of specific quantitative PCR assays for these genes despite considerable interest in understanding their expression profiles. Here, we describe a set of quantitative PCR assays that specifically measures the mRNA levels of each APOBEC3 gene. The specificity and sensitivity of each assay was validated using a full matrix of APOBEC3 cDNA templates. The assays were used to quantify the APOBEC3 repertoire in multiple human T-cell lines, bulk leukocytes and leukocyte subsets, and 20 different human tissues. The data demonstrate that multiple APOBEC3 genes are expressed constitutively in most types of cells and tissues, and that distinct APOBEC3 genes are induced upon T-cell activation and interferon treatment. These data help define the APOBEC3 repertoire relevant to HIV-1 restriction in T cells, and they suggest a general model in which multiple APOBEC3 proteins function together to provide a constitutive barrier to foreign genetic elements, which can be fortified by transcriptional induction.
INTRODUCTION
The APOBEC3 (A3; apolipoprotein B mRNA-editing enzyme, catalytic polypeptide-like 3) proteins are Zn2+-dependent DNA cytidine deaminases, which are capable of inhibiting the replication of an incredible range of mobile genetic elements (1–4). In humans, representative A3 substrates include exogenous retroviruses such as HIV-1 and HTLV, endogenous retroviruses such as HERV, endogenous retrotransposons such as L1 and Alu, and DNA viruses such as HBV and HPV (5–15). Despite the relevance of many of these parasitic elements to human health, the A3 proteins that function in vivo against each particular element have yet to be defined. For instance, A3F and A3G have been shown to strongly restrict HIV-1 in vitro and very likely contribute to HIV-1 restriction in vivo, but strong arguments have also implicated several other human A3 proteins (1–4,16).
The seven A3 genes are positioned in tandem on human chromosome 22: A3A, A3B, A3C, A3D (formerly A3DE), A3F, A3G and A3H (17). A defining feature of each A3 gene is that it encodes a protein with one or two conserved zinc (Z)-coordinating deaminase domains. Each Z domain belongs to one of three distinct phylogenetic groups: Z1 (A3A and the C-terminal halves of A3B and A3G), Z2 (A3C, both halves of A3D and A3F, and the N-terminal halves of A3B and A3G) and Z3 (A3H) (18). Based on the relatedness of these Z domains, the human A3 repertoire appears to be the result of a minimum of eight unequal crossing-over recombination events, which mostly occurred during the radiation of primates (18). The net result is that the human A3 mRNAs share considerable identity, ranging from 30% to nearly 100% (Figure 1A and Supplementary Table S1). For example, nt 1–473 of the A3F mRNA are 98.7% identical to A3G nt 50–522. Similarly, A3A nt 259–937 are 96.6% identical to the corresponding region of A3B, nt 692–1370. The A3 genes are also under positive selection and accordingly are highly polymorphic (19–21). These inter-domain identities and polymorphisms present considerable challenges to A3 expression profiling and quantification.
Figure 1.

A panel of quantitative PCR assays to monitor APOBEC3 mRNA levels. (A) Overview of A3 mRNA features. Each A3 mRNA is depicted to scale except 2100 nt of the A3F 3′ UTR are not shown. Inter-A3 regions of 90% or greater identity over >18 nt are highlighted in color. (B) A histogram depicting the results of running each A3 qPCR assay against each of the seven A3 cDNA control templates. (C) A graph showing the A3 qPCR assay amplification ranges and efficiencies. The mean and standard deviation of two independent experiments each consisting of three replica reactions is shown (in most instances the error is smaller than the symbol).
Here we report specific quantitative PCR (qPCR) assays for each of the seven human A3 cDNA sequences. We use these assays to profile the expressed A3 repertoire in common T-cell lines, primary CD4+ T lymphocytes, and 20 distinct human tissues. We also quantify the effects of T-cell stimulation and interferon (IFN) induction on A3 expression. These expression data indicate that several A3 proteins, in addition to A3F and A3G, are expressed in CD4+ cells and are therefore positioned to contribute to HIV-1 restriction. More generally, nearly every cell type and tissue expresses multiple A3s, consistent with a model in which parasitic elements must evolve ways to cope with a constitutive set of restriction factors that can be further fortified by transcriptional induction.
MATERIALS AND METHODS
Cell lines
Human T-cell lines were cultured in RPMI (Thermo-Fisher) supplemented with 10% fetal bovine serum (Denville). SupT1 and H9 were obtained from the AIDS Research and Reference Reagent Program. SupT11 is a sub-clone of SupT1 obtained by limiting dilution. CEM and CEM-SS were described (22).
Enrichment and culture of primary cells
Peripheral blood mononuclear cells (PBMCs) were isolated from blood (Memorial Blood Center, St. Paul, MN) by Ficoll-Paque gradient centrifugation (GE Healthcare). The resulting buffy coat was subjected to negative selection to enrich for naïve primary CD4+ T cells (Miltenyi Biotech). Primary cells were cultured in RPMI supplemented with 10% FBS and stimulated to proliferate with 50 U ml−1 recombinant interleukin-2 (IL-2; Sigma), and 10 µg ml−1 phytohemagglutinin (PHA; Fisher Healthcare). To confirm proliferation, 106 cells were stained with 10 µM carboxyfluorescein diacetate succinimidyl ester (CFSE) according to the manufacturer (Invitrogen) and analyzed by flow cytometry. PBMCs and CD4+ T cells were treated with 2 ng ml−1 universal type I IFN (R&D Systems).
RNA preparation
PBS-washed cells were prepared for RNA isolation by lysis in ice-cold buffer RLT (Roche) supplemented with 10 µl ml−1 2-mercaptoethanol (Sigma). RNA was isolated using the RNeasy kit (Qiagen). Two optional components of the kit, QiaShredder and on-column DNase digestion, were used to homogenize lysates and remove genomic DNA. RNA concentrations were determined spectroscopically and RNA quality was assessed by gel analysis (Supplementary Figure S1). Total RNA from 20 distinct tissues, each from a minimum of three donors, was purchased from Ambion. The control qPCRs for housekeeping genes (below) were similarly efficient for all RNA preparations, indicating equally high qualities and integrities.
cDNA synthesis
Total RNA (1 µg) was used to synthesize cDNA using avian myeloblastosis virus reverse transcriptase (AMV RT; Roche) and random hexameric primers. We found that random hexamer mRNA priming was preferable to oligo-dT priming, which resulted in inefficient synthesis of some A3 cDNAs, particularly A3D and A3F, most likely because of their long, repeat-rich 3′ untranslated regions (UTRs) (Figure 1A and Supplementary Figure S2). cDNA synthesis reactions were performed by mixing 3 µl of 333 µM random hexamer primer (50 µM final concentration) with 1 µg of total RNA diluted in 10 µl of RNase-free water. This mixture was heated for 10 min at 65°C to remove RNA secondary structure and then cooled briefly on ice. Master mix (7 µl) containing 0.5 µl Protector RNase inhibitor (Roche), 0.4 µl AMV RT, 4 µl 5× AMV RT reaction buffer, and 2.1 µl dNTPs (Roche, 10 mM each; ∼1 mM each final concentration) were then added to these reactions, which were subsequently incubated at 25°C for 10 min, 42°C for 1 h, then 95°C for 5 min. Reactions were then diluted by addition of 80 µl RNase-free H2O, and used in qPCR reactions.
qPCR
cDNAs levels were quantified by PCR using a Roche Lightcycler 480 instrument according to the manufacturer’s protocols. Reactions were performed in 96-well plates with each containing 7.5 µl 2× probe master mix (Roche), 1.25 µl H2O, 1.05 µl primers (5 µm each), 0.2 µl UPL probe (Roche) and 5 µl cDNA (prepared as above). Reactions were incubated at 95°C for 10 min, then 40 cycles of 95°C for 10 s, 58°C for 15 s, then 72°C for 2 s. Table 1 lists the full sequences of all primers and probes used in this study; the design rationale and validation experiments are described below. The PCR cycle at which amplification was detectable above a background threshold (threshold cycle, or Ct) was calculated with the maximum second derivative method using the Lightcycler 480 software (Roche, version 1.5.0). cDNA was synthesized and qPCR performed in triplicate for each sample, and the mean values and standard deviations for each triplicate are reported.
Table 1.
APOBEC3 qPCR primers and probes
| Gene symbol | mRNA NCBI accession | 5′ Primer Name | Seq (5′–3′) | 3′ Primer name | Seq (5′–3′) | Probe name | Seqa |
|---|---|---|---|---|---|---|---|
| APOBEC3s | |||||||
| APOBEC3A | NM_145699 | RSH2742 | gagaagggacaagcacatgg | RSH2743 | tggatccatcaagtgtctgg | UPL26 | ctgggctg |
| APOBEC3B | NM_004900 | RSH3220 | gaccctttggtccttcgac | RSH3221 | gcacagccccaggagaag | UPL1 | cctggagc |
| APOBEC3C | NM_014508 | RSH3085 | agcgcttcagaaaagagtgg | RSH3086 | aagtttcgttccgatcgttg | UPL155 | ttgccttc |
| APOBEC3D | NM_152426 | RSH2749 | acccaaacgtcagtcgaatc | RSH2750 | cacatttctgcgtggttctc | UPL51 | ggcaggag |
| APOBEC3F | NM_145298 | RSH2751 | ccgtttggacgcaaagat | RSH2752 | ccaggtgatctggaaacactt | UPL27 | gctgcctg |
| APOBEC3G | NM_021822 | RSH2753 | ccgaggacccgaaggttac | RSH2754 | tccaacagtgctgaaattcg | UPL79 | ccaggagg |
| APOBEC3H | NM_181773 | RSH2757 | agctgtggccagaagcac | RSH2758 | cggaatgtttcggctgtt | UPL21 | tggctctg |
| Reference genes | |||||||
| TBP | NM_003194 | RSH3231 | cccatgactcccatgacc | RSH3232 | tttacaaccaagattcactgtgg | UPL51 | ggcaggag |
| RPL13A | NM_012423 | RSH3227 | ctggaccgtctcaaggtgtt | RSH3228 | gccccagataggcaaactt | UPL74 | ctgctgcc |
| HPRT1 | NM_000194 | RSH2959 | tgaccttgatttattttgcatacc | RSH2960 | cgagcaagacgttcagtcct | UPL73 | gctgagga |
aIt is not known whether the UPL probes correspond to the coding or template DNA strands of their target sequences (Roche proprietary information).
Primer design
Primer pairs were designed to avoid inter-A3 identity and only amplify the intended A3 target (Figure 1A, Supplementary Figure S2, Table 1 and Supplementary Table S1). Primer pair specificity was verified by manually inspecting alignments of primers and A3 cDNA sequences, by using BLAST (version 2.2.20; http://blast.ncbi.nlm.nih.gov/) and Primer-BLAST software (http://www.ncbi.nlm.nih.gov/tools/primer-blast/; default parameters except E set to 1) and, experimentally, by attempting to amplify 104 copies of every A3 control template with each set of A3 qPCR primers (Figure 1B). Primers were additionally designed to have similar melting temperatures and were confirmed to have similar reaction efficiencies (Figure 1C and see below). Furthermore, primers were designed such that they would amplify all described variants of each A3 mRNA (i.e. splice variants and SNPs; data not shown). Design was assisted by the Roche ProbeFinder software (version 2.43; http://qpcr.probefinder.com/roche3.html) and by Primer3 software (version 0.4.0; http://primer3.sourceforge.net/).
Data analysis
Expression level normalization
A3 expression data were normalized to the expression of TATA-box binding protein (TBP; see below). Essentially identical normalized results were obtained using ribosomal protein L13A (RPL13A), or hypoxanthine-guanine phosphoribosyltransferase (HPRT) (data not shown). None of these controls showed altered expression levels upon treatment of cells with IL-2, PMA and/or IFN.
Determination of reaction efficiencies
For all assays, the primer efficiency was determined using serial dilutions of control templates (e.g. Figure 1C). The control templates consisted of portions of the 5′ UTRs and coding regions of the A3 cDNAs amplified by PCR and cloned into pCR2.1-TOPO (Invitrogen). The same templates were used to validate assay specificity (Figure 1B). These plasmids were linearized by digestion with XmnI or BglII, phenol–chloroform extracted, ethanol precipitated, and the DNA concentration was determined spectroscopically. Ten-fold serial dilutions of these plasmids were prepared with 101–108 plasmid molecules per 5 µl. These dilutions were used as templates in qPCR reactions. Ct values were plotted against the log10 number of template molecules in each reaction (Figure 1C), and the slope of this line determines the reaction efficiency according to the equation: efficiency = 10(−1/slope) (23). Reaction efficiencies were also calculated from the actual amplification curves from several experiments (24). Reaction efficiencies calculated by these two methods agreed closely (data not shown).
The reaction efficiencies (E) determined in this manner were then used to calculate relative expression levels between two samples (S1 and S2), normalized to a reference gene (ref, TBP), according to published methods (23):
ΔCt(A3) = CtA3,S1 − CtA3,S2
ΔCt(ref) = Ctref,S1 − Ctref,S2
Relative expression = (EA3)−ΔCt(A3)/(Eref)−ΔCt(ref)
Immunoblotting
Cells were cultured and/or isolated as described above, washed in PBS and lysed in 0.2% NP40 buffer with 1 × EDTA-free protease inhibitor mixture (Roche). Proteins were subjected to ice-cold acetone precipitation prior to quantification (Bio-Rad). An equal amount of protein was fractionated on a 10% SDS-polyacrylamide gel and transferred to a PVDF membrane (Millipore). Membranes were blotted with antibodies specific to A3F, A3G or tubulin (Covance). The A3F and A3G polyclonal antibodies were obtained from the AIDS Research and Reference Reagent Program courtesy of M. Malim (Kings College London) and J. Lingappa (University of Washington), respectively (25,26). Band intensities were quantified using Image J software (NIH).
RESULTS
APOBEC3 qPCR assay designs and optimization experiments
To determine where and when each A3 mRNA is expressed we developed a panel of specific qPCR assays. For each assay, several computational and manual procedures were used to develop specific and efficient qPCR primers. Each primer was selected to span two exons (Figure 1A and Table 1). The primers and probes were screened to avoid known single nucleotide polymorphisms and splice variations (data not shown). Assay specificity was tested by pitting all seven qPCR probe/primer sets against each of the seven A3 cDNA templates in a 49-reaction qPCR matrix. The amplification results demonstrated that each assay was specific to the intended target A3 (Figure 1B).
The next most important parameter to test and optimize was reaction efficiency. Serial dilutions of linearized A3 control cDNA templates were used in qPCR reactions to measure efficiencies. After as many as four primer/probe redesigns for some A3s, high efficiencies ranging from 1.97–1.99 were achieved for each qPCR assay (Figure 1C). These nearly ideal efficiencies indicated that each assay would provide a robust and quantitative measure of the level of expression of each A3 gene. In other words, these data indicated that quantitative comparisons of each A3 relative to the others are possible.
Assay standardization and normalization are crucial parameters to ensure quantitative data set comparisons. We therefore also designed and tested qPCR assays for three common housekeeping genes, TBP, RPL13A and HPRT (‘Materials and Methods’ section). The mRNA levels of each of these genes were consistent between cell types and tissues. To facilitate data normalization and comparisons, only one of these genes (TBP) was used as an internal standard.
Finally, each of the aforementioned A3 qPCR assays was evaluated on two independent platforms to ensure that all data could be reproduced and generalized. The Roche Lightcycler 480 platform, which uses fluorescent probes, was used to develop the assays and for all data reported here. A similar set of reaction specificities was observed using different instrumentation and detection methods (iCycler and SybrGreen, respectively; BioRad, data not shown). These data indicated that our A3 qPCR assays could be applied to a range of experimental questions.
APOBEC3 expression profiles in permissive and non-permissive T-cell lines
Three groups independently discovered A3G in 2002 (5,17,27). One of these studies was based on the observation that there are two distinct phenotypes in human T-cell lines with respect to Vif-deficient HIV-1 infection (5,28–30). Cell lines such as CEM and H9 are resistant to infection by Vif-deficient viruses and, accordingly, are termed non-permissive. On the other hand, cell lines such as CEM-SS (a clonal derivative of CEM) and SupT1 support HIV-1 replication in the presence or absence of Vif and are thus deemed permissive. A3G was originally identified as the dominant restriction factor whose presence accounted for the non-permissive phenotype of CEM cells in comparison to its permissive daughter line, CEM-SS. Since then, overexpression of several A3 family members has been shown to render CEM-SS non-permissive to Vif-deficient HIV replication (1–5,16,22). Despite the elegance of this permissive and non-permissive dichotomy, the full nature of the Vif-deficient HIV-1 replication defect on non-permissive cells has not been elucidated. In other words, which A3s are required for HIV-1 restriction in non-permissive cells: A3G or some combination of A3G and these other A3 proteins?
To shed additional light on this important question, we profiled the expressed A3 repertoire in the two related cell lines, non-permissive CEM and permissive CEM-SS. These cell lines were used to clone A3G by subtractive hybridization (5) and, as expected, A3G mRNA levels were 12-fold higher in the non-permissive line CEM (Figure 2A). However, levels of A3B, A3C, A3D and A3F were also significantly higher than those in CEM-SS, by 19-, 2-, 3- and 28-fold, respectively. These observations suggest that other A3s, in addition to A3G, may contribute to Vif-deficient HIV-1 restriction in CEM. However, the presence of significant A3C mRNA levels in CEM-SS is concordant with it alone not being sufficient to restrict the replication of Vif-deficient HIV-1 (31,32).
Figure 2.
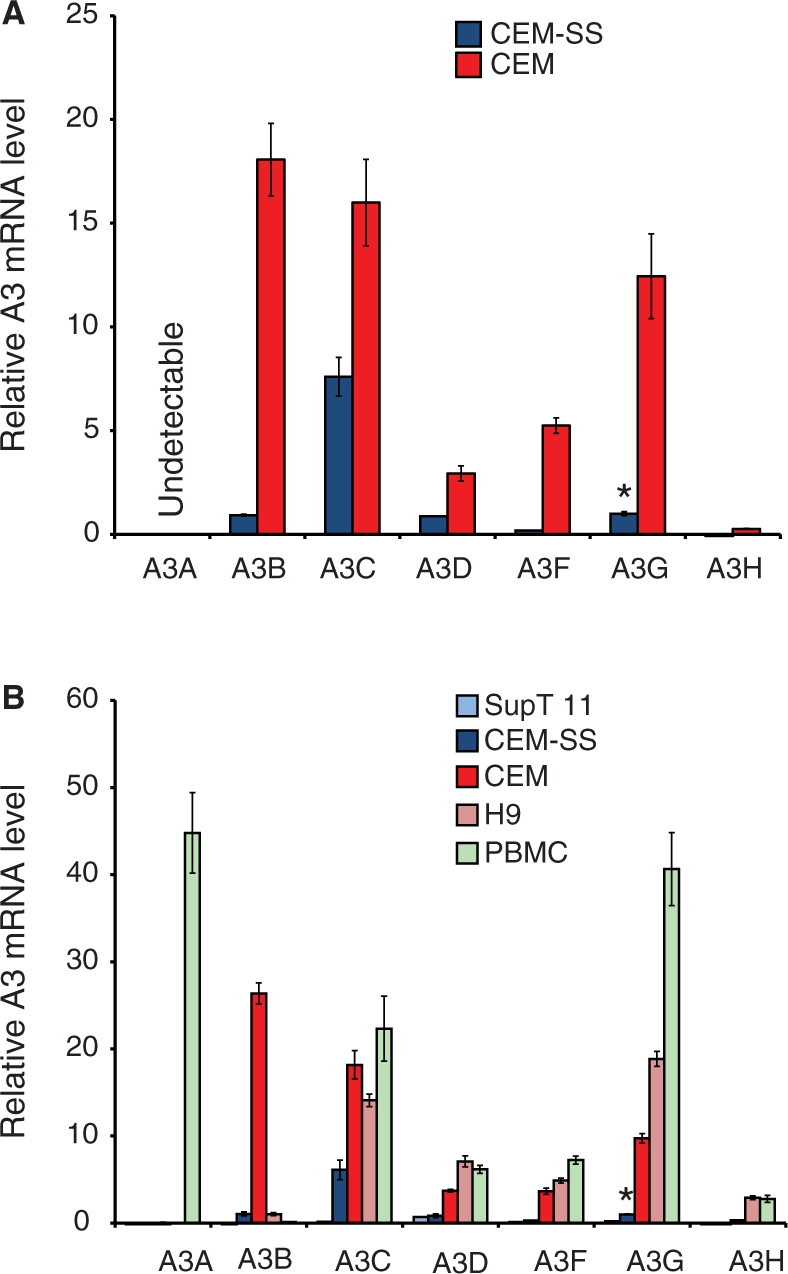
APOBEC3 expression in human T-cell lines and naïve PBMCs. (A) A3 expression in the permissive T-cell line CEM-SS and the non-permissive line CEM. Mean values and standard deviations of three independent qPCR reactions are shown for each condition. Expression is normalized to the reference gene TBP and the level of CEM-SS A3G is set to 1 to facilitate comparison (denoted by the asterisk). (B) A3 expression in the permissive T-cell lines SupT11 and CEM-SS in comparison to non-permissive lines CEM and H9. The expressed A3 repertoire in PBMCs is shown for comparison (data from an independent experiment in which CEM and CEM-SS yielded results similar to those shown here). The experimental parameters are identical to those used in panel A.
Further consistent with the possibility that multiple A3s contribute to the non-permissive phenotype, the non-permissive T-cell line H9 was also found to express multiple A3 mRNAs at levels well beyond those in permissive cells (Figure 2B). A3C, A3D, A3F, A3G, and A3H were 2-, 8-, 16-, 19- and 1000-fold above those in CEM-SS cells, respectively. In contrast to CEM cells, A3B was virtually absent, and A3H was well expressed (considered further below). Notably, the expression levels of all seven A3 genes were extremely low and approaching detection limits in the permissive line SupT11. Thus far, SupT11 is the only T-cell line that we have found that is practically devoid of A3 gene expression. The molecular explanation for this is not known, but it is not due to deletion of the locus because specific qPCR products are still detected.
APOBEC3 expression profiles in primary leukocytes
Next we sought to define the A3 repertoire in fresh, unstimulated PBMCs (Figure 2B). Multiple A3s were expressed in PBMCs with the overall pattern resembling that of CEM and H9 non-permissive lines (significant levels of A3C, A3D, A3F and A3G). However, some major differences were detected. First and most strikingly, PBMCs were found to express high A3A levels, which were ∼5000-fold greater than CEM. These observations were consistent with recent reports indicating that A3A expression is specific to the CD14+ lineage, which includes macrophages and monocytes (11,33–35). Second, PBMCs expressed virtually no A3B mRNA, which is ∼100-fold less than CEM. Third, PBMCs expressed 4-fold more A3G than CEM, and 40-fold more than CEM-SS. Finally, PBMCs were found to express high levels of A3H, similar to those observed in H9, ∼13-fold more than CEM, and nearly 1000-fold more than CEM-SS or SupT11.
The expressed APOBEC3 repertoire in naïve and stimulated CD4+ T lymphocytes
CD4+ T lymphocytes are a major target of HIV-1. To define the expressed A3 repertoire in this important T-cell subset, we used negative selection to isolate CD4+ lymphocytes from fresh PBMCs (Figure 3A). These cells were stimulated with IL-2 and PHA and shown to proliferate by CFSE staining and flow cytometry (Figure 3B). T-cell stimulation caused the induction of every A3 with the exception of A3A (Figure 3C). Mitogen activation had been shown previously to induce A3G expression in CD4+ T cells (35,36). The increase in A3H expression levels is particularly remarkable, rising 22-fold over naïve levels.
Figure 3.

APOBEC3 expression in naïve and stimulated CD4+ lymphocytes. (A) Flow cytometry histograms depicting the results of CD4+ lymphocyte purification by negative selection. (B) Flow cytometry histograms of CFSE-labeled cells 4 days after mock or IL-2/PHA treatment, naïve and stimulated, respectively. (C) A3 expression in naïve and 3 day stimulated CD4+ lymphocytes. Data from CEM are shown for comparison. Expression is normalized to TBP and the level of A3H in CEM is set to 1 (denoted by the asterisk). Mean values and standard deviations of three independent qPCR reactions are shown for each condition.
Several APOBEC3s are IFN-responsive
In response to viral infection, cytokines such as type I IFNs are induced, and these in turn activate the expression of hundreds of genes. Several A3s have been shown to be IFN-responsive, but only two reports have considered the entire A3 repertoire and procedures have varied considerably [(11,35,37–43); see ‘Discussion’ section]. To extend this work, fresh PBMCs were treated with leukocyte IFN and the resulting A3 mRNA levels were quantified by qPCR (Figure 4A). In bulk PBMCs, A3A was clearly induced, in agreement with prior reports (11,35,40,44). The other A3s were also found to be up-regulated but to lesser extents.
Figure 4.

IFN induces APOBEC3 expression in PBMCs but not CD4+ T cells. The relative A3 mRNA levels in (A) PBMCs and (B) CD4+ T lymphocytes treated for 48 h with IL-2/PHA and/or IFN. Expression is normalized to TBP and the naïve A3H level is set to 1 (denoted by the asterisk). Mean values and standard deviations of three independent qPCR reactions are shown for each condition.
We next examined the effects of IL-2, PHA and IFN on A3 expression in naïve and stimulated CD4+ T cells (Figure 4B). As shown above, the T-cell mitogens IL-2 and PHA induced the mRNA levels of all of the A3s except A3A (compare Figures 3C and 4B). In contrast, IFN treatment did little to alter these expression profiles. Thus, the A3s in CD4+ T lymphocytes are not IFN inducible, whereas the A3s in at least one other PBMC cell type are IFN-responsive. Based on recent reports, CD14+ phagocytic cells such as monocytes and macrophages are likely to be the only leukocyte subset in which A3 expression is IFN-inducible [(11,35,40,44) and data not shown].
APOBEC3 expression profile in human tissues
An important question with respect to A3 expression is whether or not it is confined to immune cell compartments. To help address this issue, we quantified the expressed A3 repertoire of twenty normal human tissues. Two cell lines, CEM and SupT11, and fresh PBMCs were assayed in parallel to facilitate comparisons with our other data sets. Several interesting observations emerged from these studies (Figure 5).
Figure 5.

APOBEC3 expression in human tissues. A summary of qPCR data showing the relative A3 mRNA levels in the indicated cells and tissues. The color scheme provides qualitative information, as the full range of blue (low expression) to red (high expression) color is used for each row of data. The inset numbers represent the relative levels of each A3 mRNA across the panel with the median value in each row set to 1. Since the assay efficiencies are almost identical (Figure 1C), these quantitative data can be used to compare any of the values within the table. Three replicas were done for each condition and the average values were used to construct the table (the errors were <10% and are not shown for simplicity).
First, consistent with central roles in innate immunity, A3 expression levels were high in lymphoid organs such as the thymus and spleen. The thymus, which is rich in T lymphocytes, has an expressed A3 repertoire similar to that of primary CD4+ T cells: low A3A and A3B, high A3C, A3D, A3F, A3G and A3H (compare Figures 5 and 3C). The spleen is rich in both B and T lymphocytes, but it is also a major reservoir for undifferentiated monocytes (45). This helped reconcile observations showing that the spleen has relatively high levels of all seven A3s, consistent with previous observations indicating that A3A is restricted to CD14+ cells including monocytes (11,35,40).
Second, many A3s were clearly expressed outside of the blood compartment or common immune tissues. For example, five of seven A3s showed peak expression levels in lung tissue: A3A, A3B, A3C, A3D and A3H. The most remarkable was A3A, which was detected at levels 70-fold higher in the lung than the median value from all 20 tissues. This observation is consistent with large numbers of CD14+ macrophages residing in lung alveoli. A bronchoalveolar lavage cell preparation from a non-smoking individual yields 1 × 10⁷ cells, of which 90–95% are macrophages (46). In addition, A3A was expressed in adipose tissue at levels 5-fold higher than the median value. This level is compatible with the finding that adipose from an obese individual is 40% macrophages by weight (47). Also of note is A3 expression in the ovary. Levels of A3C, A3F and A3G were 3-, 5- and nearly 3-fold higher, respectively, than median values from the other tissues. This may indicate a requirement for viral and transposable element restriction in female germ cells (48).
Finally, some tissues expressed virtually no A3s. The brain and the testes, for instance, had low A3 levels comparable to those of SupT11 (compare Figures 5 and 2B). These are largely immune privileged organs that are physically separated from other tissues and from potential pathogen infections by the blood–brain barrier and the blood–tubular barrier, respectively. The apparent A3 expression deficiency in these tissues may also be due in part to the absence of appropriate gene expression activators such as IFNs, cytokines and/or growth factors.
Strong correlations between APOBEC3 mRNA and protein expression levels
To ask whether the observed APOBEC3 mRNA levels correlate with protein levels, we separated cell extracts by SDS–PAGE and probed the resulting blots with antibodies raised against A3F and A3G (Figure 6). The A3F polyclonal antibody is specific to the best of our knowledge [(22,25) and unpublished observations]. The A3G polyclonal antibody is semi-specific as it reacts with both A3A and A3G, but these proteins are distinguishable by size (11,26,35).
Figure 6.

APOBEC3 immunoblots. (A) T-cell line or (B) primary CD4+ lymphocyte (IL-2/PHA or mock treated) protein extracts were examined by immunoblotting with antibodies specific to A3F or A3G. The blots were stripped and re-probed with anti-tubulin to control for protein loading.
In strong agreement with our qPCR data and many prior studies, A3F and A3G protein levels are considerably lower in CEM-SS than they are in the non-permissive lines CEM [e.g. Figure 6A; (22,49)]. The low but still measurable levels of A3G in the CEM-SS population also enabled quantification by densitometry, revealing a 5–10-fold difference at the protein level between these two lines. This value closely resembles the 10-fold difference in A3G mRNA levels between CEM and CEM-SS (Figure 2). In further agreement with our qPCR data, A3G protein was too low to detect by immunoblotting in SupT11 and ∼1.6-fold higher in H9 than CEM. As for A3F, nearly equivalent protein levels were observed in H9 and CEM, and it was undetectable in SupT11 and CEM-SS (Figures 2 and 6A). Finally, we compared the protein expression of A3F and A3G in primary CD4+ T lymphocytes under naïve and stimulated conditions. Consistent with our qPCR data, A3F was induced slightly and A3G levels increased ∼2-fold upon T-cell stimulation (Figures 3C and 6B). Overall, we conclude that strong correlations are evident between the qPCR results and the immunoblot data.
DISCUSSION
Despite remarkable progress identifying A3 restriction substrates such as HIV-1, transposons, and foreign DNA, the overarching biological functions of the A3 repertoire are still being elucidated (1–5,11,50). What events drove the rapid expansion of the A3 locus to encode seven A3 proteins, and a total of eleven zinc-coordinating domains? Does each A3 protein serve some unique, divergent function or do they serve the same function only in different places and/or at different times? How much redundancy exists? How much specificity? How much of this is governed by transcriptional programs? To begin to address the latter question, in particular, here we report qPCR assays that enable the specific and quantitative detection of the entire seven gene human A3 repertoire. We have improved on previous commercial methods by reporting the identity, specificity and efficiency of each A3 primer/probe set, by demonstrating the assay’s functionality and usefulness across detection platforms and, most importantly, by quantifying A3 expression in multiple human tissues and cell types. During the course of completing our experiments, an independent study on A3 expression in hematopoietic cells and tissues was published by Koning et al. (35). These two studies are largely complementary, but some differences merit discussion.
The first point is technical. We developed our own qPCR assays and, as such, were able to ensure target specificity and near identical reaction efficiencies (Figure 1). We also report the nucleotide sequences of the primers and probes so the assays are fully compatible with many different qPCR methods and instruments (Table 1). In contrast, Koning et al. used proprietary primers and probes from Applied Biosystems, which are optimized for specific reagents and instrumentation and less readily adaptable to other platforms. Knowledge of the primer binding sites is also crucial for detecting and ultimately ascertaining the function of alternatively spliced A3 variants.
Second, our study uniquely focuses on the question of which A3s are expressed in such a manner that they may contribute to HIV-1 restriction in vivo. The observation that the non-permissive T-cell lines CEM and H9 express significantly higher levels of A3G and A3F is not surprising (Figure 2). However, what is notable is that six A3s (i.e. all but A3A) are expressed at higher levels in these non-permissive cell lines. The constitutive A3 repertoire in H9 appears remarkably similar to the induced repertoire in stimulated, primary CD4+ T lymphocytes (Figures 2B and 3C). A3H levels, in particular, increase over 20-fold upon T-cell stimulation with IL-2 and PHA. Together with prior cell culture overexpression studies indicating that A3H can restrict HIV-1 in a Vif susceptible manner (20,51–55), our expression data strengthen the case that A3H may contribute to HIV-1 restriction in vivo. In contrast, a role for A3A in HIV-1 restriction in CD4+ T cells is unlikely, because it is not expressed in this cell type and it does not restrict Vif-deficient HIV-1 in overexpression experiments [this study and (11,31,33,35)]. Unambiguously testing the involvement of other A3s in HIV-1 restriction, in addition to A3F and A3G, will require much further work.
Third, based on an extensive survey of A3 expression in 20 tissues, we conclude that the A3 mRNAs are expressed broadly and not confined to cells of the immune compartment (although there is clearly some bias to immune cell types; Figure 5). For example, adipose, colon, cervix, bladder and the heart all express at least two A3s at levels 2-fold above the median among all tissues. In partial contrast, Koning et al. concluded that, apart from germ cell tissues, A3 expression is confined to the hematopoietic compartment and that their detection in many tissues is simply due to infiltrating leukocytes (35). This is likely the case for some tissues such as lung and adipose where significant numbers of A3A-expressing macrophages are found. Although the true breadth of A3 expression in human tissues (and a different developmental stages) will not be fully appreciated until suitably specific immunohistochemistry antibodies are developed, at least two additional lines of evidence support the likelihood that A3s are expressed broadly. First, as noted by Koning et al. and as is also evident in our data sets, the A3G mRNA levels typically exceed those of A3F in PBMCs and in specific leukocyte types [Figures 3C, 4 and 5; (35)]. This ratio is inverted in some tissues such as the cervix, colon and ovary, strongly suggesting that immune cell infiltration is not the whole story [Figure 5 and (35)]. Second, many clonally derived cancer cell lines of non-immune cell origins have been shown to express multiple human A3s, such as colorectal hepatocarcinoma, adenocarcinoma, melanoma and lung carcinoma lines [(17,27,38,56–59) and http://www.oncomine.org]. It is possible that A3 expression switches on at some stage during oncogenesis, but given the abundance of A3s in cancer cell lines it is likely that part of this reflects the normal gene expression program that existed prior to immortalization. Thus, the broad and apparently constitutive A3 expression profile of many human tissues is consistent with a general role for A3 proteins in innate immunity. Substrates may not only include endogenous and exogenous retroelements, but also DNA viruses and even naked, foreign double-stranded DNA (10–12,60).
Fourth, our data and those of Koning et al. (35) are somewhat discordant on the relative difference between A3G and A3F expression levels. They concluded that the A3G mRNA levels are 10-fold higher than those of A3F. In contrast, we did not observe such a large expression bias. In some tissues such as lung we observed a modest bias in favor of A3G. Conversely, in other tissues such as the colon and ovary, we observed a slight bias toward A3F. However, in general, we observed that A3F and A3G levels are fairly similar and that these mRNAs are invariably expressed together. Our data are consistent with prior A3F and A3G multi-tissue northern blot results and the fact that the promoter regions of A3F and A3G are 96% identical over a 5-kb region including exons 1 and 2 (56). We favor a model in which A3F and A3G are coordinately expressed [proposed originally by ref. (56)]. A greater understanding of the promoters and their associated transcription factors will help provide future tests of this model. It is possible that differences between the results reported here and the literature are due to protocol differences such as random primed versus oligo-dT mediated cDNA synthesis, the latter being much less efficient and susceptible to repetitive elements in 3′ UTRs, and/or to imperfect PCR reaction efficiencies (e.g. Supplementary Figure S2).
On a strong complementary note, a major point detailed here and in the study by Koning and coworkers is the inducibility of A3 mRNA expression. Several prior studies have examined the IFN-responsiveness of the A3s and particularly A3G and the conclusions have been variable (11,35,37–42). However, in agreement with Koning and coworkers, our data indicate that none of the A3s are induced by IFN in primary CD4+ T lymphocytes (Figure 4B). Small increases in A3 expression, such as for A3A, can be attributed readily to a few contaminating CD14+ cells in the T lymphocyte preparations. Rather, the strong IFN responsiveness of the A3s, highlighted by A3A, may be a property of other blood cell lineages such as CD14+ monocytes and macrophages (11,35,39). We also found that T-cell activation with IL-2 and PHA causes the induction of 6/7 A3s [i.e. all but A3A; Figure 4B and refs. (35,36)]. These studies combine to indicate that cells have multiple mechanisms to regulate A3 expression. Thus, in addition to constitutive expression of most of the A3 repertoire in many cell types and tissues, transcriptional regulation is likely to have a major role in ultimately determining the efficacy and potency of A3-dependent defenses against viral and non-viral challenges.
Overall, turning back to the question of HIV-1 restriction, our studies are consistent with A3F, A3G and potentially several other A3s being important in CD4+ T lymphocytes. A3H is the most likely additional restriction factor because (i) it is expressed in the non-permissive T-cell line H9 (Figure 2), (ii) it is expressed in naïve CD4+ cells (Figure 3), (iii) it is induced 20-fold by T-cell activation (Figure 3), and (iv) it is capable of HIV-1 restriction in a Vif-susceptible manner (20,51–55). Although the literature overwhelmingly favors a role for A3G in HIV-1 restriction, with A3F a distant but important second, A3H and several of the other A3s warrant substantive additional investigation.
SUPPLEMENTARY DATA
Supplementary Data are available at NAR Online.
FUNDING
National Institutes of Health (grants GM090437 and AI064046); Bill and Melinda Gates Foundation; Children's Cancer Research Fund (Minneapolis, MN) 3M Graduate Fellowship and a Cancer Biology Training Grant (CA009138) to M.D.S. Funding for open access charge: National Institutes of Health.
Conflict of interest statement. None declared.
Supplementary Material
ACKNOWLEDGEMENTS
The authors thank J. Hultquist for comments on the manuscript, M. Malim for provocative discussion at Cold Spring Harbor, the AIDS Research and Reference Reagent Program for cell lines and antibodies, and D. Bernlohr for the use of a BioRad icycler.
REFERENCES
- 1.Chiu YL, Greene WC. The APOBEC3 cytidine deaminases: an innate defensive network opposing exogenous retroviruses and endogenous retroelements. Annu. Rev. Immunol. 2008;26:317–353. doi: 10.1146/annurev.immunol.26.021607.090350. [DOI] [PubMed] [Google Scholar]
- 2.Goila-Gaur R, Strebel K. HIV-1 Vif, APOBEC, and intrinsic immunity. Retrovirology. 2008;5:51. doi: 10.1186/1742-4690-5-51. [DOI] [PMC free article] [PubMed] [Google Scholar]
- 3.Hultquist JF, Harris RS. Leveraging APOBEC3 proteins to alter the HIV mutation rate and combat AIDS. Future Virol. 2009;4:605–619. doi: 10.2217/fvl.09.59. [DOI] [PMC free article] [PubMed] [Google Scholar]
- 4.Malim MH, Emerman M. HIV-1 accessory proteins–ensuring viral survival in a hostile environment. Cell Host Microbe. 2008;3:388–398. doi: 10.1016/j.chom.2008.04.008. [DOI] [PubMed] [Google Scholar]
- 5.Sheehy AM, Gaddis NC, Choi JD, Malim MH. Isolation of a human gene that inhibits HIV-1 infection and is suppressed by the viral Vif protein. Nature. 2002;418:646–650. doi: 10.1038/nature00939. [DOI] [PubMed] [Google Scholar]
- 6.Mangeat B, Turelli P, Caron G, Friedli M, Perrin L, Trono D. Broad antiretroviral defence by human APOBEC3G through lethal editing of nascent reverse transcripts. Nature. 2003;424:99–103. doi: 10.1038/nature01709. [DOI] [PubMed] [Google Scholar]
- 7.Zhang H, Yang B, Pomerantz RJ, Zhang C, Arunachalam SC, Gao L. The cytidine deaminase CEM15 induces hypermutation in newly synthesized HIV-1 DNA. Nature. 2003;424:94–98. doi: 10.1038/nature01707. [DOI] [PMC free article] [PubMed] [Google Scholar]
- 8.Derse D, Hill SA, Princler G, Lloyd P, Heidecker G. Resistance of human T cell leukemia virus type 1 to APOBEC3G restriction is mediated by elements in nucleocapsid. Proc. Natl Acad. Sci. USA. 2007;104:2915–2920. doi: 10.1073/pnas.0609444104. [DOI] [PMC free article] [PubMed] [Google Scholar]
- 9.Lee YN, Malim MH, Bieniasz PD. Hypermutation of an ancient human retrovirus by APOBEC3G. J. Virol. 2008;82:8762–8770. doi: 10.1128/JVI.00751-08. [DOI] [PMC free article] [PubMed] [Google Scholar]
- 10.Suspène R, Guétard D, Henry M, Sommer P, Wain-Hobson S, Vartanian JP. Extensive editing of both hepatitis B virus DNA strands by APOBEC3 cytidine deaminases in vitro and in vivo. Proc. Natl Acad. Sci. USA. 2005;102:8321–8326. doi: 10.1073/pnas.0408223102. [DOI] [PMC free article] [PubMed] [Google Scholar]
- 11.Stenglein MD, Burns MB, Li M, Lengyel J, Harris RS. APOBEC3 proteins mediate the clearance of foreign DNA from human cells. Nat. Struct. Mol. Biol. 2010;17:222–229. doi: 10.1038/nsmb.1744. [DOI] [PMC free article] [PubMed] [Google Scholar]
- 12.Vartanian JP, Guetard D, Henry M, Wain-Hobson S. Evidence for editing of human papillomavirus DNA by APOBEC3 in benign and precancerous lesions. Science. 2008;320:230–233. doi: 10.1126/science.1153201. [DOI] [PubMed] [Google Scholar]
- 13.Bogerd HP, Wiegand HL, Hulme AE, Garcia-Perez JL, O'Shea KS, Moran JV, Cullen BR. Cellular inhibitors of long interspersed element 1 and Alu retrotransposition. Proc. Natl Acad. Sci. USA. 2006;103:8780–8785. doi: 10.1073/pnas.0603313103. [DOI] [PMC free article] [PubMed] [Google Scholar]
- 14.Chiu YL, Witkowska HE, Hall SC, Santiago M, Soros VB, Esnault C, Heidmann T, Greene WC. High-molecular-mass APOBEC3G complexes restrict Alu retrotransposition. Proc. Natl Acad. Sci. USA. 2006;103:15588–15593. doi: 10.1073/pnas.0604524103. [DOI] [PMC free article] [PubMed] [Google Scholar]
- 15.Muckenfuss H, Hamdorf M, Held U, Perkovic M, Lower J, Cichutek K, Flory E, Schumann GG, Munk C. APOBEC3 proteins inhibit human LINE-1 retrotransposition. J. Biol. Chem. 2006;281:22161–22172. doi: 10.1074/jbc.M601716200. [DOI] [PubMed] [Google Scholar]
- 16.Albin JS, Harris RS. Interactions of host APOBEC3 restriction factors with HIV-1 in vivo: implications for therapeutics. Expert Rev. Mol. Med. 2010;12:e4. doi: 10.1017/S1462399409001343. [DOI] [PMC free article] [PubMed] [Google Scholar]
- 17.Jarmuz A, Chester A, Bayliss J, Gisbourne J, Dunham I, Scott J, Navaratnam N. An anthropoid-specific locus of orphan C to U RNA-editing enzymes on chromosome 22. Genomics. 2002;79:285–296. doi: 10.1006/geno.2002.6718. [DOI] [PubMed] [Google Scholar]
- 18.LaRue RS, Jónsson SR, Silverstein KAT, Lajoie M, Bertrand D, El-Mabrouk N, Hötzel I, Andrésdóttir V, Smith TPL, Harris RS. The artiodactyl APOBEC3 innate immune repertoire shows evidence for a multi-functional domain organization that existed in the ancestor of placental mammals. BMC Mol. Biol. 2008;9:104. doi: 10.1186/1471-2199-9-104. [DOI] [PMC free article] [PubMed] [Google Scholar]
- 19.Kidd JM, Newman TL, Tuzun E, Kaul R, Eichler EE. Population stratification of a common APOBEC gene deletion polymorphism. PLoS Genet. 2007;3:e63. doi: 10.1371/journal.pgen.0030063. [DOI] [PMC free article] [PubMed] [Google Scholar]
- 20.OhAinle M, Kerns JA, Li MM, Malik HS, Emerman M. Antiretroelement activity of APOBEC3H was lost twice in recent human evolution. Cell Host Microbe. 2008;4:249–259. doi: 10.1016/j.chom.2008.07.005. [DOI] [PMC free article] [PubMed] [Google Scholar]
- 21.Sawyer SL, Emerman M, Malik HS. Ancient adaptive evolution of the primate antiviral DNA-editing enzyme APOBEC3G. PLoS Biol. 2004;2:E275. doi: 10.1371/journal.pbio.0020275. [DOI] [PMC free article] [PubMed] [Google Scholar]
- 22.Haché G, Shindo K, Albin JS, Harris RS. Evolution of HIV-1 isolates that use a novel Vif-independent mechanism to resist restriction by human APOBEC3G. Curr. Biol. 2008;18:819–824. doi: 10.1016/j.cub.2008.04.073. [DOI] [PMC free article] [PubMed] [Google Scholar]
- 23.Pfaffl MW. A new mathematical model for relative quantification in real-time RT-PCR. Nucleic Acids Res. 2001;29:e45. doi: 10.1093/nar/29.9.e45. [DOI] [PMC free article] [PubMed] [Google Scholar]
- 24.Peirson SN, Butler JN, Foster RG. Experimental validation of novel and conventional approaches to quantitative real-time PCR data analysis. Nucleic Acids Res. 2003;31:e73. doi: 10.1093/nar/gng073. [DOI] [PMC free article] [PubMed] [Google Scholar]
- 25.Holmes RK, Koning FA, Bishop KN, Malim MH. APOBEC3F can inhibit the accumulation of HIV-1 reverse transcription products in the absence of hypermutation. Comparisons with APOBEC3G. J. Biol. Chem. 2007;282:2587–2595. doi: 10.1074/jbc.M607298200. [DOI] [PubMed] [Google Scholar]
- 26.Newman EN, Holmes RK, Craig HM, Klein KC, Lingappa JR, Malim MH, Sheehy AM. Antiviral function of APOBEC3G can be dissociated from cytidine deaminase activity. Curr. Biol. 2005;15:166–170. doi: 10.1016/j.cub.2004.12.068. [DOI] [PubMed] [Google Scholar]
- 27.Harris RS, Petersen-Mahrt SK, Neuberger MS. RNA editing enzyme APOBEC1 and some of its homologs can act as DNA mutators. Mol. Cell. 2002;10:1247–1253. doi: 10.1016/s1097-2765(02)00742-6. [DOI] [PubMed] [Google Scholar]
- 28.Gabuzda DH, Lawrence K, Langhoff E, Terwilliger E, Dorfman T, Haseltine WA, Sodroski J. Role of Vif in replication of human immunodeficiency virus type 1 in CD4+ T lymphocytes. J. Virol. 1992;66:6489–6495. doi: 10.1128/jvi.66.11.6489-6495.1992. [DOI] [PMC free article] [PubMed] [Google Scholar]
- 29.Strebel K, Daugherty D, Clouse K, Cohen D, Folks T, Martin MA. The HIV ‘A’ (sor) gene product is essential for virus infectivity. Nature. 1987;328:728–730. doi: 10.1038/328728a0. [DOI] [PubMed] [Google Scholar]
- 30.von Schwedler U, Song J, Aiken C, Trono D. Vif is crucial for human immunodeficiency virus type 1 proviral DNA synthesis in infected cells. J. Virol. 1993;67:4945–4955. doi: 10.1128/jvi.67.8.4945-4955.1993. [DOI] [PMC free article] [PubMed] [Google Scholar]
- 31.Bishop KN, Holmes RK, Sheehy AM, Davidson NO, Cho SJ, Malim MH. Cytidine deamination of retroviral DNA by diverse APOBEC proteins. Curr. Biol. 2004;14:1392–1396. doi: 10.1016/j.cub.2004.06.057. [DOI] [PubMed] [Google Scholar]
- 32.Yu Q, Chen D, Konig R, Mariani R, Unutmaz D, Landau NR. APOBEC3B and APOBEC3C are potent inhibitors of simian immunodeficiency virus replication. J. Biol. Chem. 2004;279:53379–53386. doi: 10.1074/jbc.M408802200. [DOI] [PubMed] [Google Scholar]
- 33.Chen H, Lilley CE, Yu Q, Lee DV, Chou J, Narvaiza I, Landau NR, Weitzman MD. APOBEC3A is a potent inhibitor of adeno-associated virus and retrotransposons. Curr. Biol. 2006;16:480–485. doi: 10.1016/j.cub.2006.01.031. [DOI] [PubMed] [Google Scholar]
- 34.Peng G, Greenwell-Wild T, Nares S, Jin W, Lei KJ, Rangel ZG, Munson PJ, Wahl SM. Myeloid differentiation and susceptibility to HIV-1 are linked to APOBEC3 expression. Blood. 2007;110:393–400. doi: 10.1182/blood-2006-10-051763. [DOI] [PMC free article] [PubMed] [Google Scholar]
- 35.Koning FA, Newman EN, Kim EY, Kunstman KJ, Wolinsky SM, Malim MH. Defining APOBEC3 expression patterns in human tissues and hematopoietic cell subsets. J. Virol. 2009;83:9474–9485. doi: 10.1128/JVI.01089-09. [DOI] [PMC free article] [PubMed] [Google Scholar]
- 36.Stopak KS, Chiu YL, Kropp J, Grant RM, Greene WC. Distinct patterns of cytokine regulation of APOBEC3G expression and activity in primary lymphocytes, macrophages, and dendritic cells. J. Biol. Chem. 2007;282:3539–3546. doi: 10.1074/jbc.M610138200. [DOI] [PubMed] [Google Scholar]
- 37.Argyris EG, Acheampong E, Wang F, Huang J, Chen K, Mukhtar M, Zhang H. The interferon-induced expression of APOBEC3G in human blood-brain barrier exerts a potent intrinsic immunity to block HIV-1 entry to central nervous system. Virology. 2007;367:440–451. doi: 10.1016/j.virol.2007.06.010. [DOI] [PMC free article] [PubMed] [Google Scholar]
- 38.Bonvin M, Achermann F, Greeve I, Stroka D, Keogh A, Inderbitzin D, Candinas D, Sommer P, Wain-Hobson S, Vartanian JP, et al. Interferon-inducible expression of APOBEC3 editing enzymes in human hepatocytes and inhibition of hepatitis B virus replication. Hepatology. 2006;43:1364–1374. doi: 10.1002/hep.21187. [DOI] [PubMed] [Google Scholar]
- 39.Chen K, Huang J, Zhang C, Huang S, Nunnari G, Wang FX, Tong X, Gao L, Nikisher K, Zhang H. Alpha interferon potently enhances the anti-human immunodeficiency virus type 1 activity of APOBEC3G in resting primary CD4 T cells. J. Virol. 2006;80:7645–7657. doi: 10.1128/JVI.00206-06. [DOI] [PMC free article] [PubMed] [Google Scholar]
- 40.Peng G, Lei KJ, Jin W, Greenwell-Wild T, Wahl SM. Induction of APOBEC3 family proteins, a defensive maneuver underlying interferon-induced anti-HIV-1 activity. J. Exp. Med. 2006;203:41–46. doi: 10.1084/jem.20051512. [DOI] [PMC free article] [PubMed] [Google Scholar]
- 41.Tanaka Y, Marusawa H, Seno H, Matsumoto Y, Ueda Y, Kodama Y, Endo Y, Yamauchi J, Matsumoto T, Takaori-Kondo A, et al. Anti-viral protein APOBEC3G is induced by interferon-alpha stimulation in human hepatocytes. Biochem. Biophys. Res. Commun. 2006;341:314–319. doi: 10.1016/j.bbrc.2005.12.192. [DOI] [PubMed] [Google Scholar]
- 42.Wang FX, Huang J, Zhang H, Ma X, Zhang H. APOBEC3G upregulation by alpha interferon restricts human immunodeficiency virus type 1 infection in human peripheral plasmacytoid dendritic cells. J. Gen. Virol. 2008;89:722–730. doi: 10.1099/vir.0.83530-0. [DOI] [PubMed] [Google Scholar]
- 43.Vetter ML, Johnson ME, Antons AK, Unutmaz D, D'Aquila RT. Differences in APOBEC3G expression in CD4+ T helper lymphocyte subtypes modulate HIV-1 infectivity. PLoS Pathog. 2009;5:e1000292. doi: 10.1371/journal.ppat.1000292. [DOI] [PMC free article] [PubMed] [Google Scholar]
- 44.Taylor MW, Grosse WM, Schaley JE, Sanda C, Wu X, Chien SC, Smith F, Wu TG, Stephens M, Ferris MW, et al. Global effect of PEG-IFN-alpha and ribavirin on gene expression in PBMC in vitro. J. Interferon Cytokine Res. 2004;24:107–118. doi: 10.1089/107999004322813354. [DOI] [PubMed] [Google Scholar]
- 45.Swirski FK, Nahrendorf M, Etzrodt M, Wildgruber M, Cortez-Retamozo V, Panizzi P, Figueiredo JL, Kohler RH, Chudnovskiy A, Waterman P, et al. Identification of splenic reservoir monocytes and their deployment to inflammatory sites. Science. 2009;325:612–616. doi: 10.1126/science.1175202. [DOI] [PMC free article] [PubMed] [Google Scholar]
- 46.Daniele RP, Dauber JH, Altose MD, Rowlands D.T., Jr, Gorenberg DJ. Lymphocyte studies in asymptomatic cigarette smokers. A comparison between lung and peripheral blood. Am. Rev. Respir. Dis. 1977;116:997–1005. doi: 10.1164/arrd.1977.116.6.997. [DOI] [PubMed] [Google Scholar]
- 47.Weisberg SP, McCann D, Desai M, Rosenbaum M, Leibel RL, Ferrante A.W., Jr Obesity is associated with macrophage accumulation in adipose tissue. J. Clin. Invest. 2003;112:1796–1808. doi: 10.1172/JCI19246. [DOI] [PMC free article] [PubMed] [Google Scholar]
- 48.Stenglein MD, Harris RS. APOBEC3B and APOBEC3F inhibit L1 retrotransposition by a DNA deamination-independent mechanism. J. Biol. Chem. 2006;281:16837–16841. doi: 10.1074/jbc.M602367200. [DOI] [PubMed] [Google Scholar]
- 49.Haché G, Harris RS. CEM-T4 cells do not lack an APOBEC3G cofactor. PLoS Pathog. 2009;5:e1000528. doi: 10.1371/journal.ppat.1000528. [DOI] [PMC free article] [PubMed] [Google Scholar]
- 50.Esnault C, Heidmann O, Delebecque F, Dewannieux M, Ribet D, Hance AJ, Heidmann T, Schwartz O. APOBEC3G cytidine deaminase inhibits retrotransposition of endogenous retroviruses. Nature. 2005;433:430–433. doi: 10.1038/nature03238. [DOI] [PubMed] [Google Scholar]
- 51.Dang Y, Siew LM, Wang X, Han Y, Lampen R, Zheng YH. Human cytidine deaminase APOBEC3H restricts HIV-1 replication. J. Biol. Chem. 2008;283:11606–11614. doi: 10.1074/jbc.M707586200. [DOI] [PMC free article] [PubMed] [Google Scholar]
- 52.Harari A, Ooms M, Mulder LC, Simon V. Polymorphisms and splice variants influence the antiretroviral activity of human APOBEC3H. J. Virol. 2009;83:295–303. doi: 10.1128/JVI.01665-08. [DOI] [PMC free article] [PubMed] [Google Scholar]
- 53.OhAinle M, Kerns JA, Malik HS, Emerman M. Adaptive evolution and antiviral activity of the conserved mammalian cytidine deaminase APOBEC3H. J. Virol. 2006;80:3853–3862. doi: 10.1128/JVI.80.8.3853-3862.2006. [DOI] [PMC free article] [PubMed] [Google Scholar]
- 54.Tan L, Sarkis PT, Wang T, Tian C, Yu XF. Sole copy of Z2-type human cytidine deaminase APOBEC3H has inhibitory activity against retrotransposons and HIV-1. FASEB J. 2009;23:279–287. doi: 10.1096/fj.07-088781. [DOI] [PMC free article] [PubMed] [Google Scholar]
- 55.Li MM, Wu LI, Emerman M. The range of human APOBEC3H sensitivity to lentiviral Vif proteins. J. Virol. 2010;84:88–95. doi: 10.1128/JVI.01344-09. [DOI] [PMC free article] [PubMed] [Google Scholar]
- 56.Liddament MT, Brown WL, Schumacher AJ, Harris RS. APOBEC3F properties and hypermutation preferences indicate activity against HIV-1 in vivo. Curr. Biol. 2004;14:1385–1391. doi: 10.1016/j.cub.2004.06.050. [DOI] [PubMed] [Google Scholar]
- 57.Henry M, Guetard D, Suspene R, Rusniok C, Wain-Hobson S, Vartanian JP. Genetic editing of HBV DNA by monodomain human APOBEC3 cytidine deaminases and the recombinant nature of APOBEC3G. PloS ONE. 2009;4:e4277. doi: 10.1371/journal.pone.0004277. [DOI] [PMC free article] [PubMed] [Google Scholar]
- 58.Kock J, Blum HE. Hypermutation of hepatitis B virus genomes by APOBEC3G, APOBEC3C and APOBEC3H. J. Gen. Virol. 2008;89:1184–1191. doi: 10.1099/vir.0.83507-0. [DOI] [PubMed] [Google Scholar]
- 59.Jost S, Turelli P, Mangeat B, Protzer U, Trono D. Induction of antiviral cytidine deaminases does not explain the inhibition of hepatitis B virus replication by interferons. J. Virol. 2007;81:10588–10596. doi: 10.1128/JVI.02489-06. [DOI] [PMC free article] [PubMed] [Google Scholar]
- 60.Narvaiza I, Linfesty DC, Greener BN, Hakata Y, Pintel DJ, Logue E, Landau NR, Weitzman MD. Deaminase-independent inhibition of parvoviruses by the APOBEC3A cytidine deaminase. PLoS Pathog. 2009;5:e1000439. doi: 10.1371/journal.ppat.1000439. [DOI] [PMC free article] [PubMed] [Google Scholar]
Associated Data
This section collects any data citations, data availability statements, or supplementary materials included in this article.