Abstract
The soil bacterium Myxococcus xanthus is a model for the study of cooperative microbial behaviours such as social motility and fruiting body formation. Several M. xanthus developmental traits that are frequently quantified for laboratory strains are likely to be significant components of fitness in natural populations, yet little is known about the degree such traits vary in the wild and may therefore be subject to natural selection. Here we have tested whether several key M. xanthus developmental life-history traits have diverged significantly among strains both from globally distant origins and from within a sympatric, cm-scale population. The isolates examined here were found to vary greatly, in a heritable manner, in their rate of developmental aggregation and in both their rate and efficiency of spore production. Isolates also varied in the nutrient concentration threshold triggering spore formation and in the heat resistance of spores. The extensive diversity in developmental phenotypes documented here opens questions regarding the relative roles of selection and genetic drift in shaping the diversity of local soil populations with respect to these developmental traits. It also raises the question whether fitness in the wild is largely determined by traits that are expressed independently of social context or by behaviors that are expressed only in genetically heterogeneous social groups.
Keywords: social evolution, intra-specific variation, soil bacteria, fruiting bodies, multicellular development
Introduction
Heritable phenotypic variation allows adaptive evolution to occur and the comparative analysis of such variation in natural populations has been the mainstay of evolutionary biology since Darwin and Wallace. Variable phenotypes include both morphological and behavioural traits and often affect fitness-related interactions with other organisms, within or across species. Intra-specific variation in social interactions has been extensively studied in animals (Krebs and Davies 1997) but microorganisms are now also known to engage in many and diverse social behaviours (Crespi 2001, Velicer 2003, West et al. 2007) that are mediated primarily by the synthesis and export of extracellular compounds that harm (Hibbing et al. 2010) or help (Fuqua and Greenberg 2002, Lewenza et al. 2002) neighbouring cells. Although knowledge regarding the genetics and biochemistry of microbial social traits has expanded greatly, relatively little is known about the degree to which such traits vary in natural populations (Collier et al. 2005, Davelos et al. 2004, Fiegna and Velicer 2005, Fortunato et al. 2003, Kadam 2006, Oda et al. 2003, Stefanic and Mandic-Mulec 2009, Vogel 2003, Vos and Velicer 2008b, 2009, Vosahlikova et al. 2007). Characterization of intra-specific variation in fitness-related social phenotypes within local natural populations of microbes is necessary for understanding microbial social evolution in the wild.
Quantifiable social traits can be examined within genetically homogeneous or heterogeneous social environments and might be constant or variable across social environments. While microbial social phenotypes expressed in heterogeneous groups have received much emphasis in microbial behavioural ecology (Griffin et al. 2004, Kohler et al. 2009, Velicer et al. 2000), relatively little attention has been given to social variation among genotypes as expressed in homogenous social groups. Such variation in the social phenotypes of clonal groups is likely to be important for competition outcomes both when physical or behavioural barriers hinder migration of genotypes across social groups (Gibbs et al. 2008) and in heterogeneous social groups as well (Buttery et al. 2009). Myxococcus xanthus (order Myxococcales, species of which are collectively known as the myxobacteria) is a prominent model organism for the study of microbial social behaviour (Berleman et al. 2008, Fiegna et al. 2006, Kaplan 2003, Shimkets 1990, Vos and Velicer 2009, Wu et al. 2007, Zusman et al. 2007). M. xanthus cells actively migrate through the soil in search of prey or other food sources using two genetically and mechanistically distinct motility systems, one of which involves cell-cell contact mediated by Type IV pili to function (Kaiser 2008). Cell swarms of M. xanthus secrete a variety of compounds that kill and lyse other microorganisms, thus converting them into growth substrates (Rosenberg and Varon 1984). Perhaps the most extensively studied M. xanthus social trait is fruiting body formation. Upon depletion of growth substrate, intracellular signaling cascades cause cells to aggregate into high-density groups that gradually build up into erect fruiting bodies (Kaiser 2001, Singer and Kaiser 1995). While a small minority of cells inside this structure form metabolically quiescent spores that are resistant to heat and desiccation, the remainder of cells either remain as undifferentiated rods or lyse (Wireman and Dworkin 1977). It has been hypothesized that cell lysis within fruiting bodies provides compounds and/or energy that benefit spore differentiation and maintenance (O’Connor and Zusman 1988, Wireman and Dworkin 1977). Although various hypotheses have been formulated regarding possible benefits of forming spores within social fruiting bodies rather than individualistically (Velicer and Vos 2009), no study has yet tested rigorously between these hypotheses.
Although fruiting body development is likely to be very important for fitness in the wild (Velicer et al 1998), almost nothing is known about how this striking social trait varies and evolves within myxobacterial species in their natural habitats. In a recent study, 78 clones of M. xanthus were isolated from a centimeter-scale soil population in Tübingen, Germany (Vos and Velicer 2006), among which 21 unique MLST (multi-locus sequence typing) genotypes were identified. Variation among these cm-scale isolates has been previously documented for several traits, including swarm expansion rates and morphologies on multiple surface types, predatory efficiency on diverse prey (Morgan, Maclean & Velicer, in prep), secondary metabolite production profiles (Krug et al. 2008) and spore production across diverse social environments (Vos & Velicer 2009). Here we have tested whether several key developmental traits have diverged among these cm-scale M. xanthus isolates as well as among more divergent strains isolated from distant locations. The variation uncovered in this study opens new questions regarding the evolution of M. xanthus development in the wild.
Materials and Methods
Strains
Strain GJV1 is a laboratory descendant of the commonly studied reference strain DK1622 (Kaiser 1979) and is distinguished from it by five accumulated mutations of unknown effect (Velicer et al. 2006). The “A” strains examined here (A9, A12, A17, A23, A30, A41, A45, A47, A66, A75, A82, A85, A94, A96 and A98) were isolated by M. Vos from a 16 × 16 cm grid of soil in Tübingen, Germany (Vos and Velicer 2006). DK836 was obtained from D. Kaiser and isolated from Albany, New York. The Mxx strains were obtained from H. Reichenbach and were isolated from Olympia, Greece (Mxx12 and Mxx15) and Mt Ar-Li, Taiwan (Mxx144).
Bacterial cultures
Bacteria were inoculated from frozen stock cultures into 8 ml “TTT” liquid medium (a slightly modified version of CTT medium (Hodgkin and Kaiser 1977) in which casitone was replaced by tryptone) and grown at 32 °C while shaking at 300 rpm for three to four days. Cultures grown up after three days were diluted to prevent entry into stationary phase. All cultures were diluted into fresh medium after four days of growth and incubated overnight to synchronize growth prior to initiation of development. Cultures in exponential growth phase were centrifuged 15′ at 4500g and re-suspended to a density of ~7.5 × 10⁹ cells/ml in TPM buffer (Kroos et al. 1986) before being aliquoted onto TPM agar plates. All plate cultures were kept at 32 °C and 90% rH. All experiments were repeated in at least three temporally independent replicate blocks. Statistical analysis of spore production data was performed with log10-transformed data.
Timing of developmental morphogenesis and spore production
Ten μl of each re-suspended culture were placed on a TPM 1.5% agar plate (containing no carbon source) to induce development and then allowed to dry. Plated cultures were photographed after 0, 2, 4, 6, 8, 12, 24, 28, 48, 128 and 168 hours with a Nikon Eclipse 90i microscope at 20-fold magnification. Under the microscope lighting conditions used, developmental aggregates were initially translucent and subsequently became distinctly opaque. For the sporulation assays, plates for each strain were harvested after 24, 36, 48, 72, 128 and 168 hours with a sterile scalpel blade and washed into ddH2O. Samples were heated at 50 °C for two hours and sonicated to kill all non-spore cells. Sonicated samples were diluted into TTT soft agar (0.5% agar) and incubated for eight days before colonies were counted.
Morphogenesis and sporulation at variable nutrient levels
Ten μl of re-suspended bacterial cultures were placed on TPM agar supplemented with 0, 0.32, 3.2 or 10 g/L tryptone and allowed to dry. In the morphogenesis assay, plates were photographed at 0, 24, 48 and 72 hours after inoculation. In the sporulation assay, developmental cultures were harvested after 72 hours, sonicated and diluted into TTT soft agar and resulting colonies counted after eight days.
Spore heat resistance
Development of strains GJV1, DK836, Mxx144, A66, A75 and A98 was initiated as above. Plates were incubated for 72 hours, after which spores were harvested. Samples were heated for two hours at 50°C, 55°C, 60°C or 65°C and subsequently diluted into TTT soft agar after sonication. Colonies were counted after eight days of incubation.
Phylogenetic analysis
Sequences of the C-signal gene csgA (Hagen and Shimkets 1990) and putative zinc metalloprotease gene fibA (Kearns et al. 2002) had been previously obtained (Vos and Velicer 2006) or were generated here (Mxx12) by the same protocol (Genbank accession numbers csgA: DQ411064-DQ411141, fibA: DQ411142-411219). Sequences for forward and reverse primers for csgA and fibA are available upon request.
Sequences were aligned using ClustalW and adjusted manually. The final alignment included 1196 bp (csgA: 580 bp and fibA: 616 bp). Phylogenetic analyses of each gene individually and both genes combined were performed using maximum parsimony (MP), maximum likelihood (ML), and Bayesian inference (BI). For the ML approach, we determined the most appropriate model of nucleotide evolution using the Akaike Information Criterion (Hulsenbeck and Rannala 1997) using Modeltest v.3.7 (Posada and Crandall 1998). We performed MP and ML search using a heuristic search setting with random-addition sequences and TBR branch swapping in PAUP*4.0b10 (Swofford 2003). Support for MP and ML trees was assessed using 1000 bootstrap pseudoreplicates in PAUP*.
BI analyses were performed in MrBayes v. 3.0b4 software (Hulsenbeck and Ronquist 2001). For the BI searches, we determined the most appropriate model of nucleotide evolution using the Akaike Information Criterion (Hulsenbeck and Rannala 1997) using MrModeltest v. 1.1b (Nylander 2004). Four Markov Chain Monte Carlo (MCMC) runs were performed in two simultaneous runs. Analyses were run for 10 million generations, with trees sampled every 1000th generation. Convergence was assessed through the inspection of likelihood values and parameter sample plots using Tracer v. 1.4. The first 10% of the analysis was discarded as burn-in. Bootstrap values >70% and Bayesian posterior probabilities >0.95 were interpreted as strong support for a clade (Wilcox et al. 2002).
Results
Variation in rate of developmental morphogenesis
The twenty strains examined varied significantly in their timing of aggregation and in the darkening of aggregates that subsequently developed into mature, spore-containing fruiting bodies. Although all four global isolates (DK836, Mxx12, Mxx15 and Mxx144) and most local strains showed initial aggregation by four hours and initial opacity by six hours (e.g. Fig. 1A), there were notable exceptions. In particular, three local isolates (A66, A75 and A98) exhibited fast morphological development with initial opacity occurring after only four hours (e.g. Fig. 1B). Interestingly, all three of these fast-developing isolates yield higher densities of fruiting bodies than strains that develop more slowly (e.g. Fig. 1B in contrast to Figs. 1A & C).
Figure 1.
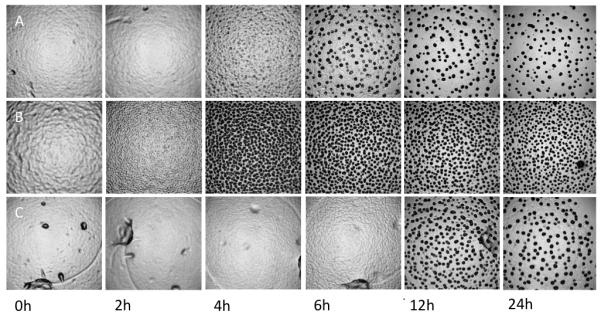
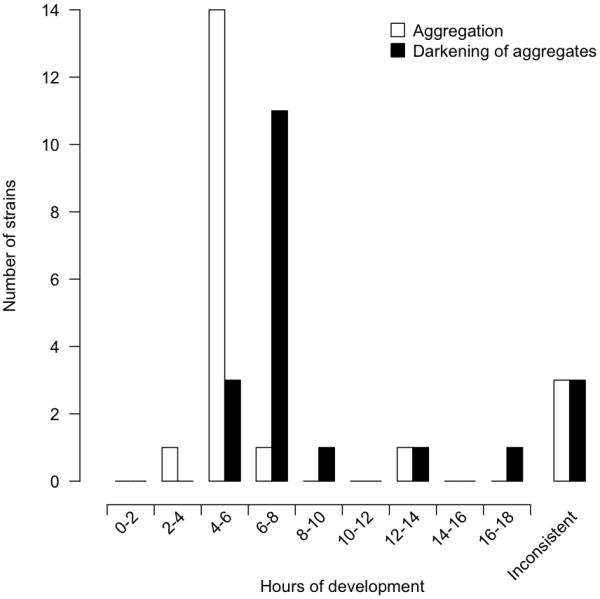
The lab reference strain GJV1 developed markedly slower than most other strains under our experimental conditions, showing initial opacity after only 8 hours and substantial opacity after 12 hours. Only one other isolate (A94) consistently showed a similarly slow pattern throughout all replicate blocks and did not become opaque until 12 to 28 hours after the onset of starvation (Fig 1C). Most isolates were highly consistent in the timing and darkening of aggregates across replicates but a subset of strains (A9, A17, A45) exhibited large variation in these traits across replicates and made zero or very few distinct opaque aggregates in at least one replicate. The overall distribution of the average times of initial aggregation and initial opacity for all strains across all replicate blocks is shown in Figure 2.
Figure 2.
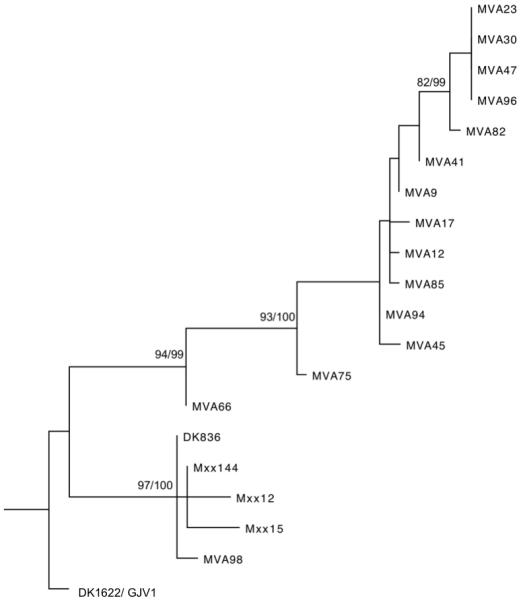
Patterns of variation in developmental timing among strains were not found to reflect patterns of phylogenetic relatedness (Fig. 3). For example, the fast developing isolates A66, A75 and A98 do not cluster together in a common clade, but are distributed across the phylogeny, as are the two slowest developing strains, GJV1 and A94. Ancestral character states for rate of development are difficult to infer for several nodes.
Figure 3.
Variation in temporal patterns of spore production
A subset of strains representing slow (GJV1, A9, A94), medium (DK836, Mxx144, A41, A85) and fast (A66, A75, A98) rates of developmental morphogenesis was also examined for variation in the levels and patterns of spore production at six time points after the onset of starvation ranging from 24 to 168 h. Spore production varied significantly across strains (one-way ANOVA, F = 26.75, df = 9, p < 0.001) and across harvest time points (F = 11.68, df = 5, p < 0.001) but not across replicate blocks (F = 0.79, df = 3, p = 0.50). Figure 4 shows the log-transformed average number of spores for all strains at each harvest time. No strains produced viable spores within 24 h. Four strains first produced a significant number of spores at 36 h (p = 0.025, 0.01, 0.039 and 0.001 for DK836, Mxx144, A66 and A98, respectively, n = 4 in all cases, one-sample, one-sided t-tests) and one each at 48 h (A75, p < 0.001, n = 4) and 72 h (GJV1, p = 0.005, n = 4). The spore counts of strains A9, A41, A85 and A94 (dashed lines) never became significantly greater than zero across replicate blocks at any time point. Spore counts for most strains did not begin to level off substantially or decrease until 72 h, but spore production by Mxx144 increased only between 24 and 36 hours and remained (statistically) unchanged thereafter.
Figure 4.
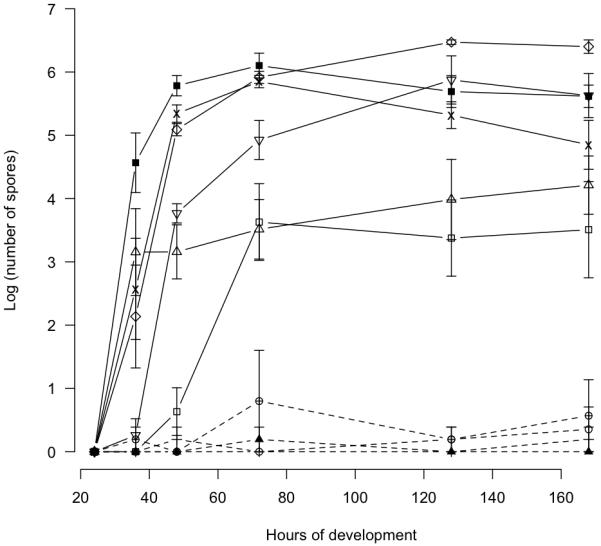
Intriguingly, a significant positive correlation was found between the rank order of initial developmental opacity and the ranked maximum number of spores produced (Spearman’s rank test, rS = 0.89, n = 10). In other words, early aggregating strains tended to rank higher in maximum spore production than slow developing strains, indicating the absence of trade-off between rate and productivity of development.
Variation in spore heat resistance
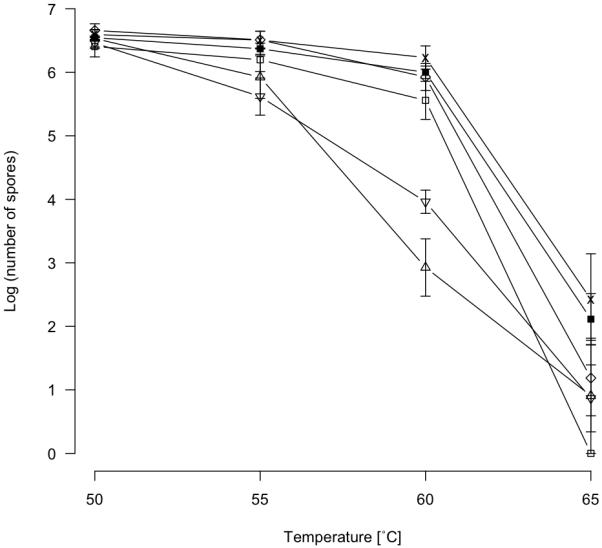
The number of spores produced that remain viable after 2 h of heating at 50, 55, 60 and 65 °C was determined for strains GJV1, DK836, Mxx144, A66, A75 and A98 (Fig. 5). Overall, the number of surviving spores was predicted by temperature treatment, strain, and temperature by strain interaction (GLM, F = 78.94, df = 2 p < 0.001; F = 22.52, df = 5 p < 0.001 and F = 11.54, df = 10, p < 0.001, respectively). Sporulation of GJV1, DK836, A66 and A98 was reduced only slightly and non-significantly at 55° and 60° relative to the next lower temperature treatment. In contrast, spore production by strains A75 and Mxx144 dropped to a greater degree than other strains at 55° (relative to 50°) and plummeted more than 100-fold in both cases at 60° (relative to 55°) (p < 0.025 for both A75 and Mxx144, df = 2, one-sided, two-sample t-tests for difference between 60° and 55° treatments). All strains produced very few or zero spores capable of surviving the 65° heat treatment. There is no evidence for trade-off between rapid development and spore quality (as reflected by heat resistance), as two of the three fast developing strains (A66 and A98) strains had high spore counts at 60°.
Figure 5.
Dependence of spore development on nutrient scarcity
To determine the effects of variable nutrient levels on the initiation and progress of development, we first examined all twenty isolates at five resource concentrations (0-10 g/L tryptone). Although clear variation in multi-cellular morphology was observed among strains at each nutrient concentration (data not shown), it was not always possible to distinguish between multicellular mounds caused by vegetative growth versus those caused by developmental aggregation. Subsequent analysis therefore focused on quantification of spore production at different nutrient concentrations for a subset of six strains (GJV1, DK836, A45, A66, A75 and A94).
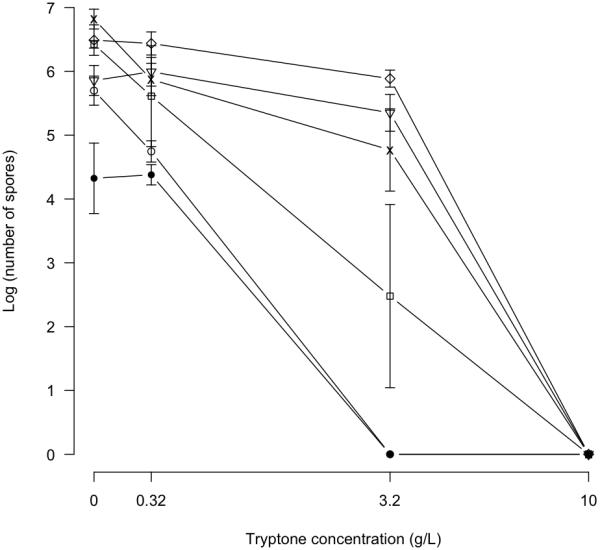
Spore production after three days of development (Fig. 6) varied significantly across nutrient treatments and nearly significantly among strains (One-way ANOVA; F = 76.06, df = 3, p < 0.001 and F = 2.29, df = 5, p = 0.053, respectively) but not among replicate blocks (F = 0.06, df = 3, p = 0.979). No spores were recovered from plates supplemented with 10 g/L tryptone for any strain. The average spore count for all strains did not differ significantly between the 0 g/L and 0.32 g/L tryptone treatments, but was significantly reduced at 3.2 relative to 0.32 g/L tryptone (two-sample, two-sided t-test; df = 17, p < 0.001). DK836 and A94 were the only strains to show significant drops in spore production at 0.32 g/L tryptone relative to zero tryptone (p < 0.025 for DK836 and A94, one-sided t-tests, df = 3). Drops in spore production at 3.2 g/L tryptone (relative to lower tryptone levels) were relatively small for strains DK836, A66 and A75 but were very large for GJV1 (>1000-fold decrease relative to 0.32 g/L tryptone), A45 and A94 (complete loss of spore production at 3.2 g/L tryptone in both cases).
Figure 6.
Discussion
Clear understanding of evolutionary processes occurring in natural populations of microbes requires detailed characterization of heritable variation in fitness-related traits. We tested whether quantifiable components of M. xanthus development have diverged significantly among several natural isolates since the isolates diverged from their most recent common ancestor. Extensive heritable variation was found in all developmental traits examined, including total spore production, rate of developmental aggregation, temporal patterns of spore formation, effect of multiple nutrient levels on spore production and the stress resistance of spores. This variation was found not only among relatively divergent strains isolated from sites separated by long distances, but also among highly similar strains isolated from a cm-scale patch of soil. Patterns of phenotypic variation were not found to reflect patterns of phylogenetic relatedness, suggesting that the traits examined here evolve rapidly relative to the sequence concatemer employed to measure genetic relatedness. Future work will be required to explain the relative roles of natural selection and genetic drift in determining the range of developmental variation documented here in local soil populations.
The frequency with which M. xanthus engages in multicellular development in natural habitats is unknown, as is the contribution of development to overall fitness (Velicer & Hillesland 2008). Relaxed selection on developmental proficiency rapidly leads to the evolution of socially defective genotypes (Velicer et al. 1998, Zhang et al. 2005), so the globally widespread presence of developmentally competent strains (Vos and Velicer 2008a) indicates that social proficiency is highly beneficial in many habitats. Variation in selective forces across space and time may have generated the diverse developmental phenotypes documented here, either directly by acting on the traits per se or indirectly by acting on other traits linked by pleiotropy to those examined here.
The degree to which phenotypic variation present in natural microbial habitats is reflected by variation observed in laboratory studies is a difficult but important open question. Variation documented in the lab may be affected by differential “pre-adaptation” of strains to laboratory conditions (Velicer and Lenski 1999) that might mask details of how variation is expressed in natural habitats. Thus, inferences made from phenotypic variation in the lab for understanding variation in fitness strategies in nature ought to be conservative. Nonetheless, it seems unlikely that the major developmental differences observed among the strains examined here are purely laboratory artifacts.
Previous studies have demonstrated large fitness asymmetries between natural M. xanthus isolates mixed at the onset of development (Fiegna & Velicer 2005, Vos & Velicer 2009), despite the fact that the strains employed in those studies exhibited similar levels of total spore production in clonal culture. While actively antagonistic behaviours between strains are required to explain some of the competition outcomes observed in these studies (e.g. the mutual extinction of paired genotypes (Fiegna and Velicer 2005)), large fitness asymmetries in mixed cultures might also result from intrinsic behavioural differences (i.e. differences manifest in pure culture) between competitors that are masked by simple assays of spore production in pure culture at a given point in time (Buttery et al. 2009). For example, two strains that produce similar numbers of spores at a given time in pure culture (e.g. strains A75 and A98 at 168 h, Fig. 4) might develop at markedly different rates in a manner unaffected by social environment. In mixed competition, the faster developing strain might monopolize signaling molecules produced by both strains and thereby largely exclude the slower-developing competitor from making viable spores. Such a scenario could result in a competitive outcome indistinguishable from that between two strains that exhibit similar temporal patterns of spore production in pure culture but engage in some form of interference competition in chimeric groups. Our data demonstrate the existence of variation in intrinsic developmental traits (e.g. rate of development) that might cause major fitness asymmetries in chimeric groups without interference competition.
The relationship between the amount of carbon substrate available for vegetative growth and developmental spore production varied dramatically among even the cm-scale natural isolates examined here (Fig. 6). Thus, these strains have diverged in the operation of the key regulatory pathway that controls how M. xanthus transitions from vegetative growth to fruiting body development. While some of the major components of this pathway have been identified (Crawford and Shimkets 2000, Harris et al. 1998, Yu and Velicer) understanding of the genetics and biochemistry of the transition from growth to development remains incomplete. Analysis of natural variation in this transition and future identification of the genetic diversity that underlies this phenotypic variation may help elucidate the fundamental biology of the gateway between growth and development.
Acknowledgements
This work was supported by the Max-Planck Society for the Advancement of Science, Indiana University and U.S. National Institutes of Health (grant R01 GM07690). We thank Dale Kaiser and Hans Reichenbach for providing the global-scale used in this study and Michiel Vos for isolating the cm-scale isolates. We thank Andrew Morgan and Michiel Vos for helpful discussion and comments and Christopher Muir for help with R.
References
- Berleman JE, Scott J, Chumley T, Kirby JR. Predataxis Behavior in Myxococcus xanthus. P Natl Acad Sci USA. 2008;105:17127–17132. doi: 10.1073/pnas.0804387105. [DOI] [PMC free article] [PubMed] [Google Scholar]
- Buttery NJ, Rozen DE, Wolf JB, Thompson CRL. Quantification of Social Behavior in D. discoideum Reveals Complex Fixed and Facultative Strategies. Curr Biol. 2009;19:1373–1377. doi: 10.1016/j.cub.2009.06.058. [DOI] [PubMed] [Google Scholar]
- Collier FA, Elliot SL, Ellis RJ. Spatial Variation in Bacillus thuringiensis cereus Populations within the Phyllosphere of Broad-Leaved Dock (Rumex obtusifolius) and Surrounding Habitats. FEMS Microbiol Ecol. 2005;54:417–425. doi: 10.1016/j.femsec.2005.05.005. [DOI] [PubMed] [Google Scholar]
- Crawford EW, Shimkets LJ. The Stringent Response in Myxococcus xanthus is Regulated by SocE and the CsgA C-Signaling Protein. Gene Dev. 2000;14:483–492. [PMC free article] [PubMed] [Google Scholar]
- Crespi BJ. The Evolution of Social Behavior in Microorganisms. Trends Ecol Evol. 2001;16:178–183. doi: 10.1016/s0169-5347(01)02115-2. [DOI] [PubMed] [Google Scholar]
- Davelos AL, Kinkel LL, Samac DA. Spatial Variation in Frequency and Intensity of Antibiotic Interactions among Streptomycetes from Prairie Soil. Appl Environ Microb. 2004;70:1051–1058. doi: 10.1128/AEM.70.2.1051-1058.2004. [DOI] [PMC free article] [PubMed] [Google Scholar]
- Fiegna F, Velicer GJ. Exploitative and Hierarchical Antagonism in a Cooperative Bacterium. PLoS Biol. 2005;3:1980–1987. doi: 10.1371/journal.pbio.0030370. [DOI] [PMC free article] [PubMed] [Google Scholar]
- Fiegna F, Yu Y-TN, Kadam SV, Velicer GJ. Evolution of an Obligate Social Cheater to a Superior Cooperator. Nature. 2006;441:310–314. doi: 10.1038/nature04677. [DOI] [PubMed] [Google Scholar]
- Fortunato A, Strassmann JE, Santorelli L, Queller DC. Co-Occurence in Nature of Different Clones in the Social Amoeba, Dictyostelium discoideum. Mol Ecol. 2003;12:1031–1038. doi: 10.1046/j.1365-294x.2003.01792.x. [DOI] [PubMed] [Google Scholar]
- Fuqua C, Greenberg EP. Listening in on Bacteria: Acyl-Homoserine Lactone Signaling. Nat Rev Mol Cell Bio. 2002;3:685–695. doi: 10.1038/nrm907. [DOI] [PubMed] [Google Scholar]
- Gibbs KA, Urbanowski ML, Greenberg EP. Genetic Determinants of Self Identity and Social Recognition in Bacteria. Science. 2008;321:256–259. doi: 10.1126/science.1160033. [DOI] [PMC free article] [PubMed] [Google Scholar]
- Griffin AS, West SA, Buckling A. Cooperation and Competition in Pathogenic Bacteria. Nature. 2004;430:1024–1027. doi: 10.1038/nature02744. [DOI] [PubMed] [Google Scholar]
- Hagen TJ, Shimkets LJ. Nucleotide-Sequence and Transcriptional Products of the csg Locus of Myxococcus xanthus. J Bacteriol. 1990;172:15–23. doi: 10.1128/jb.172.1.15-23.1990. [DOI] [PMC free article] [PubMed] [Google Scholar]
- Harris BZ, Kaiser D, Singer M. The Guanosine Nucleotide (p)ppGpp Initiates Development and A-Factor Production in Myxococcus xanthus. Gene Dev. 1998;12:1022–1035. doi: 10.1101/gad.12.7.1022. [DOI] [PMC free article] [PubMed] [Google Scholar]
- Hibbing ME, Fuqua C, Parsek MR, Peterson SB. Bacterial Competition: Surviving and Thriving in the Microbial Jungle. Nat Rev Microbiol. 2010;8:15–25. doi: 10.1038/nrmicro2259. [DOI] [PMC free article] [PubMed] [Google Scholar]
- Hodgkin J, Kaiser D. Cell-to-Cell Stimulation of Movement in Non-Motile Mutants of Myxococcus. P Natl Acad Sci USA. 1977;74:2938–2942. doi: 10.1073/pnas.74.7.2938. [DOI] [PMC free article] [PubMed] [Google Scholar]
- Hulsenbeck JP, Rannala B. Phylogenetic Methods Come of Age: Testing Hypotheses in an Evolutionary Context. Science. 1997;276:227–232. doi: 10.1126/science.276.5310.227. [DOI] [PubMed] [Google Scholar]
- Hulsenbeck JP, Ronquist F. MRBAYES: Bayesian Inference of Phylogenetic Trees. Bioinformatics. 2001;17:754–755. doi: 10.1093/bioinformatics/17.8.754. [DOI] [PubMed] [Google Scholar]
- Kadam SV, Velicer GJ. Variable Patterns of Density-Dependent Survival in a Social Bacterium. Behav Ecol. 2006;17:833–838. [Google Scholar]
- Kaiser D. Social Gliding is Correlated with the Presence of Pili in Myxococcus xanthus. P Natl Acad Sci USA. 1979;76:5952–5956. doi: 10.1073/pnas.76.11.5952. [DOI] [PMC free article] [PubMed] [Google Scholar]
- Kaiser D. Building a Multicellular Organism. Annual Review of Genetics. 2001;35:103–123. doi: 10.1146/annurev.genet.35.102401.090145. [DOI] [PubMed] [Google Scholar]
- Kaiser D. Myxococcus-From Single-Cell Polarity to Complex Multicellular Patterns. Annu Rev Genet. 2008;42:109–130. doi: 10.1146/annurev.genet.42.110807.091615. [DOI] [PubMed] [Google Scholar]
- Kaplan HB. Multicellular Development and Gliding Motility in Myxococcus xanthus. Curr Opin Microbiol. 2003;6:572–577. doi: 10.1016/j.mib.2003.10.006. [DOI] [PubMed] [Google Scholar]
- Kearns DB, Bonner PJ, Smith DR, Shimkets LJ. An Extracellular Matrix-Associated Zinc Metalloprotease is Required for Dilauroyl Phosphatidylethanolamine Chemotactic Excitation in Myxococcus xanthus. J Bacteriol. 2002;184:1678–1684. doi: 10.1128/JB.184.6.1678-1684.2002. [DOI] [PMC free article] [PubMed] [Google Scholar]
- Kohler T, Buckling A, van Delden C. Cooperation and Virulence of Clinical Pseudomonas aeruginosa Populations. P Natl Acad Sci USA. 2009;106:6339–6344. doi: 10.1073/pnas.0811741106. [DOI] [PMC free article] [PubMed] [Google Scholar]
- Krebs J, Davies N. Ecology: An Evolutionary Approach. Blackwell Science Ltd.; Oxford: 1997. [Google Scholar]
- Kroos L, Kuspa A, Kaiser D. A Global Analysis of Developmentally Regulated Genes in Myxococcus xanthus. Dev Biol. 1986;117:252–266. doi: 10.1016/0012-1606(86)90368-4. [DOI] [PubMed] [Google Scholar]
- Krug D, Zurek G, Revermann O, Vos M, Velicer GJ, Muller R. Discovering the Hidden Secondary Metabolome of Myxococcus xanthus: a Study of Intraspecific Diversity. Appl Environ Microb. 2008;74:3058–3068. doi: 10.1128/AEM.02863-07. [DOI] [PMC free article] [PubMed] [Google Scholar]
- Lewenza S, Visser MB, Sokol PA. Interspecies Communication between Burkholderia cepacia and Pseudomonas aeruginosa. Can J Microbiol. 2002;48:707–716. doi: 10.1139/w02-068. [DOI] [PubMed] [Google Scholar]
- Nylander JA. In: MrModeltest v2. Centre EB, editor. Evolutionary Biology Centre, Uppsala University; Uppsala, Sweden: 2004. [Google Scholar]
- Oda Y, Star B, Huisman LA, Gottschal JC, Forbey LJ. Biogeography of the Purple Nonsulfur Bacterium Rhodopseudomonas palastris. Appl Environ Microb. 2003;69:5186–5191. doi: 10.1128/AEM.69.9.5186-5191.2003. [DOI] [PMC free article] [PubMed] [Google Scholar]
- O’Connor KA, Zusman DR. Re-examination of the Role of Autolysis in the Development of Myxococcus xanthus. J Bacteriol. 1988;170:4103–4112. doi: 10.1128/jb.170.9.4103-4112.1988. [DOI] [PMC free article] [PubMed] [Google Scholar]
- Posada D, Crandall KA. Modeltest: Testing the Model of DNA Substitution. Bioinformatics. 1998;14:817–818. doi: 10.1093/bioinformatics/14.9.817. [DOI] [PubMed] [Google Scholar]
- Rosenberg E, Varon M. Antibiotics and Lytic Enzymes. Springer-Verlag; New York: 1984. [Google Scholar]
- Shimkets LJ. Social and Developmental Biology of the Myxobacteria. Microbiol Rev. 1990;54:473–501. doi: 10.1128/mr.54.4.473-501.1990. [DOI] [PMC free article] [PubMed] [Google Scholar]
- Singer M, Kaiser D. Ectopic Production of Guanosine Pentaphosphate and Tetraphosphate can Initiate Early Developmental Gene-Expression in Myxococcus xanthus. Gene Dev. 1995;9:1633–1644. doi: 10.1101/gad.9.13.1633. [DOI] [PubMed] [Google Scholar]
- Stefanic P, Mandic-Mulec I. Social Interactions and Distribution of Bacillus subtilis Pheroypes at Microscale. J Bacteriol. 2009;191:1756–1764. doi: 10.1128/JB.01290-08. [DOI] [PMC free article] [PubMed] [Google Scholar]
- Swofford DL. In: PAUP*: Phylogenetic Analysis Using Parsimony (*and other Methods) Associates S, editor. Sunderland, MA: 2003. [Google Scholar]
- Velicer GJ. Social Strife in the Microbial World. Trends Microbiol. 2003;11:330–337. doi: 10.1016/s0966-842x(03)00152-5. [DOI] [PubMed] [Google Scholar]
- Velicer GJ, Lenski RE. Evolutionary Trade-Offs under Conditions of Resource Abundance and Scarcity: Experiments with Bacteria. Ecology. 1999;80:1168–1179. [Google Scholar]
- Velicer GJ, Vos M. Sociobiology of the Myxobacteria. Annu Rev Microbiol. 2009;63:599–623. doi: 10.1146/annurev.micro.091208.073158. [DOI] [PubMed] [Google Scholar]
- Velicer GJ, Kroos L, Lenski RE. Loss of Social Behaviors by Myxococcus xanthus during Evolution in an Unstructured Habitat. P Natl Acad Sci USA. 1998;95:12376–12380. doi: 10.1073/pnas.95.21.12376. [DOI] [PMC free article] [PubMed] [Google Scholar]
- Velicer GJ, Kroos L, Lenski RE. Developmental Cheating in the Social Bacterium Myxococcus xanthus. Nature. 2000;404:598–601. doi: 10.1038/35007066. [DOI] [PubMed] [Google Scholar]
- Vogel J, Normand P, Thioulouse J, Nesme X, Grundmann GL. Relationship between Spatial and Genetic Distance in Agrobacterium spp. in 1 Cubic Centimeter of Soil. Appl Environ Microb. 2003;69:1482–1487. doi: 10.1128/AEM.69.3.1482-1487.2003. [DOI] [PMC free article] [PubMed] [Google Scholar]
- Vos M, Velicer GJ. Genetic Population Structure of the Soil Bacterium Myxococcus xanthus at the Centimeter Scale. Appl Environ Microb. 2006;72:3615–3625. doi: 10.1128/AEM.72.5.3615-3625.2006. [DOI] [PMC free article] [PubMed] [Google Scholar]
- Vos M, Velicer GJ. Isolation by Distance in the Spore-Forming Soil Bacterium Myxococcus xanthus. Curr Biol. 2008a;18:386–391. doi: 10.1016/j.cub.2008.02.050. [DOI] [PubMed] [Google Scholar]
- Vos M, Velicer GJ. Natural Variation of Gliding Motility in a Centimeter-Scale Population of Myxococcus xanthus. FEMS Microbiol Ecol. 2008b;64:343–350. doi: 10.1111/j.1574-6941.2008.00484.x. [DOI] [PubMed] [Google Scholar]
- Vos M, Velicer GJ. Social Conflict in Centimeter- and Global-Scale Populations of the Bacterium Myxococcus xanthus. Curr Biol. 2009;19:1763–1767. doi: 10.1016/j.cub.2009.08.061. [DOI] [PMC free article] [PubMed] [Google Scholar]
- Vosahlikova S, Drevinek P, Cinek O, Pohunek P, Maixnerova M, Urbaskova P, van den Reijden TJK, Dijkshoorn L, Nemec A. High Genotypic Diversity of Pseudomonas aeruginosa Strains Isolated from Patients with Cystic Fibrosis in the Czech Republic. Res Microbiol. 2007;158:324–329. doi: 10.1016/j.resmic.2007.02.003. [DOI] [PubMed] [Google Scholar]
- West SA, Diggle SP, Buckling A, Gardner A, Griffins AS. The Social Lives of Microbes. Annu Rev Ecol Evol S. 2007;38:53–77. [Google Scholar]
- Wilcox TP, Zwickl DJ, Heath TA, Hillis DM. Phylogenetic Relationships of the Dwarf Boas and a Comparison of Bayesian and Bootstrap Measures of Phylogenentic Support. Mol Phylogenet Evol. 2002;25:361–371. doi: 10.1016/s1055-7903(02)00244-0. [DOI] [PubMed] [Google Scholar]
- Wireman JW, Dworkin M. Developmentally Induced Autolysis during Fruiting Body Formation by Myxococcus xanthus. J Bacteriol. 1977;129:798–802. doi: 10.1128/jb.129.2.798-802.1977. [DOI] [PMC free article] [PubMed] [Google Scholar]
- Wolgemuth C, Hoiczyk E, Kaiser D, Oster G. How Myxobacteria Glide. Curr Biol. 2002;12:369–377. doi: 10.1016/s0960-9822(02)00716-9. [DOI] [PubMed] [Google Scholar]
- Wu YL, Jiang Y, Kaiser D, Alber M. Social Interactions in Myxobacterial Swarming. PloS Comput Biol. 2007;3:2546–2558. [Google Scholar]
- Yu Y-TN, Velicer GJ. A Regulatory Small RNA Controls Myxococcus Development and Mediates a Major Social Adaptation. Submitted. [Google Scholar]
- Zhang YQ, Li YZ, Wang B, Wu ZH, Zhang CY, Gong X, Qiu ZJ, Zhang Y. Characteristics and Living Patterns of Marine Myxobacterial Isolates. Appl Environ Microb. 2005;71:3331–3336. doi: 10.1128/AEM.71.6.3331-3336.2005. [DOI] [PMC free article] [PubMed] [Google Scholar]
- Zusman DR, Scott AE, Yang Z, Kirby JR. Chemosensory Pathways, Motility and Development in Myxococcus xanthus. Nat Rev Microbiol. 2007;5:862–872. doi: 10.1038/nrmicro1770. [DOI] [PubMed] [Google Scholar]


