Abstract
Study Design
Test-retest reliability study, cross-sectional
Purpose
The purpose of this study was to examine the reliability and validity of a new grip measurement device, the Multi-Axis Profile (MAP) dynamometer, in comparison with the Baseline dynamometer and vigorimeter.
Methods
28 participants (< 30 years, n=14 and > 65 years, n=14) completed grip strength testing using all three devices. Measurements were obtained at baseline and 1–2 weeks later.
Results
Intraclass correlation coefficients (ICC) for the MAP ranged from 0.94–0.99. The other two devices had ICC's of 0.95–0.98. Correlations between the MAP dynamometer, the Baseline and vigorimeter were 0.78–0.90.
Conclusions
The results indicate high concurrent validity among all three devices and that all devices are reliable instruments with which to measure the grip strength of both younger and older adults. In addition to measuring grip strength, the MAP dynamometer measures other grip-related information such as grip force vectors, rate of force build-up, and force variability. This additional grip information may improve our understanding of hand function and changes due to aging.
Level of Evidence
Not applicable
INTRODUCTION
The simple measurement of grip strength has been administered for many years with a wide variety of instruments and for very different purposes. The most widely used devices are those which quantify scalar magnitudes for strength (e.g. Jamar, J.A. Preston Corporation, Jackson, MI, USA and Baseline dynamometer, Fabrication Enterprises Inc., White Plains, NY, USA). Grip strength devices like the Jamar and Baseline, which are equivalent and therefore interchangeable for measurement of grip strength,1 have been used extensively in studies ranging from normative2, 3 to those assessing function of the hand4–6 and the individual.7, 8 These devices have been examined for test-retest reliability9 and have been used to validate other instruments.1, 10–16 Their reliability has also been tested in different populations, ranging from children to older adults9, 13 and has consistently demonstrated intraclass correlation coefficients (ICC's) above 0.90.
Another device commonly used to measure grip strength is the vigorimeter. This device measures grip strength (pressure) when squeezing a rubber bulb. Although the reliability (ICC 0.84–0.86) of this instrument has been studied,13 this type of device has been criticized as being highly dependent on the hand-device interface.17 The vigorimeter measures the pressure exerted by the whole hand and is therefore a fundamentally different measurement than the force measurement obtained by the Baseline dynamometer. As pressure is defined as force/area, any change in the hand-device interface, and therefore the area, greatly influences the measurement.17 Nevertheless, previous research has demonstrated moderate to good correlation (0.60–0.90) between the vigorimeter and the Jamar.10, 17
As grip strength has demonstrated to be a very valuable clinical and research measurement for assessing upper extremity function,18, 19 disability,20 complication,21, 22 and mortality,20 it is of critical importance that grip force measurement instruments are not only repeatable, but are capable of quantifying relevant variables associated with grip. One relevant variable is the direction the grip forces are oriented, which necessitates measurement of shear forces. Pinch strength research indicates the direction in which the fingers orient force is altered due to aging23 but grip force orientation information is lacking. Another variable is the rate at which grip forces are built-up. It is well known that grip strength declines with age, especially after the age of 65.2 However, recent research in the lower extremities of older adults indicates the ability to rapidly build up force is more predictive of function than strength alone.24 Additionally, pinch force variability has been shown to increase due to aging25 but neither force build-up rates, or force variability during power grip, have been studied in older adults' hands. Other potentially important grip-related variables include time to fatigue and estimations of individual finger contributions.
As current clinical grip strength measurement instruments do not quantify the majority of these variables, we developed a Multi-Axis Profile (MAP) grip force dynamometer. The MAP is able to quantify grip force vectors produced by the hand.26 This information allows force magnitudes to be described as well as the direction the forces are oriented. Traditional grip measurement devices only measure force in one direction, thereby ignoring shear forces. In addition, the new device also is able to measure grip force over time,27 which allows examination of grip force build-up rates, force variability, and time to fatigue.
The purpose of this study was to evaluate the test-retest reliability and validity of the MAP dynamometer in two different populations and compare the MAP with the Baseline dynamometer and vigorimeter.
METHODS AND MATERIALS
Subjects
The study included 28 right-hand dominant participants, 14 older (> 65 years) and 14 younger (< 30 years) adults. Both groups were comprised of 10 females and 4 males. Demographic data are detailed in Table 1. All young participants were university students and were tested on campus. The older individuals were all community-dwelling and were tested at a local senior center. Exclusion criteria included pain, presence of upper extremity injury, or difficulty using hands during activity. Additional exclusion criteria included sensory or cognitive impairments.
Table 1.
Demographic information
| Age | Height | Weight | Hand Length | |||||||
|---|---|---|---|---|---|---|---|---|---|---|
| Gender | N | Mean [yr] | SD | Mean [cm] | SD | Mean [kg] | SD | Mean [cm] | SD | |
| Younger | Female | 10 | 24.5 | (3.7) | 170.7 | (7.6) | 81.6 | (32.0) | 17.7 | (1.0) |
| Male | 4 | 22.25 | (3.9) | 179.1 | (6.1) | 81.0 | (10.4) | 19.3 | (0.9) | |
|
|
||||||||||
| Older | Female | 10 | 74 | (7.7) | 159.1 | (9.1) | 71.9 | (11.1) | 17.7 | (0.8) |
| Male | 4 | 77.25 | (6.4) | 170.8 | (2.5) | 81.8 | (17.4) | 18.5 | (0.4) | |
|
|
||||||||||
Participants were compensated for their time and the experimental protocol was reviewed and approved by the University of Wisconsin-Madison Human Subjects Committee.
Instrumentation
Three grip strength measurement devices were used in this experiment. The Baseline dynamometer (Fabrication Enterprises inc., White Plains, NY) was tested due to its prevalence in research and clinical settings. A vigorimeter (Baseline inc., White Plains, NY), which consists of an air-filled bulb and a pressure gauge, was tested as it is also a common instrument for grip strength testing, especially in people with hand pain or injury.28 These devices are depicted in Figure 1.
Figure 1.
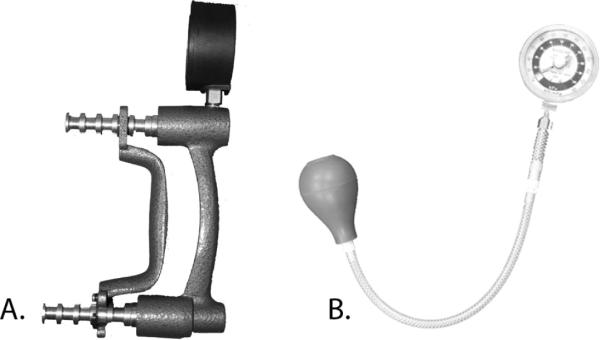
A. Baseline Dynamometer and B. Vigorimeter
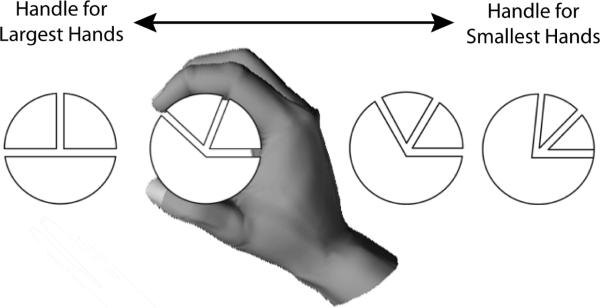
The MAP grip strength dynamometer used in the study was a three-beam design affixed with a 6.35cm diameter cylindrical plastic cover. Other covers in varying shapes or sizes are available but we chose to use a cylindrical cover due to its similarity in shape to most handrails and grab bars. The dynamometer is displayed in Figure 2. Although all participants grasped a fixed 6.35cm diameter handle, the plastic covers were sized according to each participant's hand length in an effort to ensure an equal proportion of their fingers contacted each beam. The pieces can be thought of as slices of a pie (Figure 3). Participants with smaller hands grasped smaller pie slices and those with larger hands grasped larger pie slices.
Figure 2.
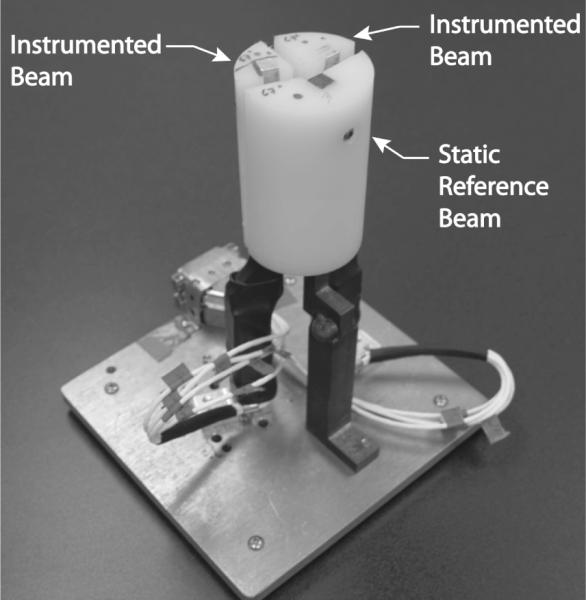
MAP with instrumented beams identified
Figure 3.
Participant hand size determined how the 6.35 cm cover was segmented
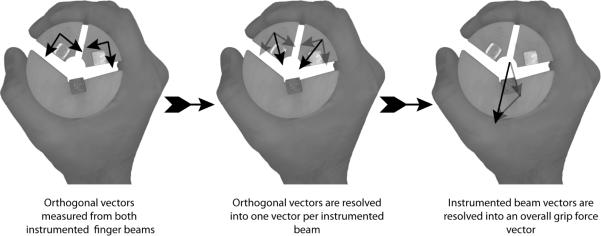
Forces produced by the hand were measured with strain gauges which were mounted in a manner to ensure the force measured was independent of vertical point of force application. Therefore, force measurements are the same regardless of where the handle is grasped along the MAP's long axis. Two sets of gauges are mounted on each instrumented beam so that each beam measured two orthogonal force vectors. These orthogonal vectors are resolved into one force vector per instrumented beam (distal and proximal). Thus, each instrumented beam measured a force vector with magnitude and angle. The two individual force vectors are, in turn, resolved into one overall grip force vector which is representative of grip strength (Figure 4).
Figure 4.
Vector summation of the grip forces
For the purposes of the analysis in this manuscript, the overall grip force vector was used. The overall grip force vector is described with a magnitude and angle (Figure 5). Custom software was developed to acquire and compile the grip force data. Grip data were collected at 1000Hz. The instrumentation is described in detail in Irwin and Radwin.27
Figure 5.
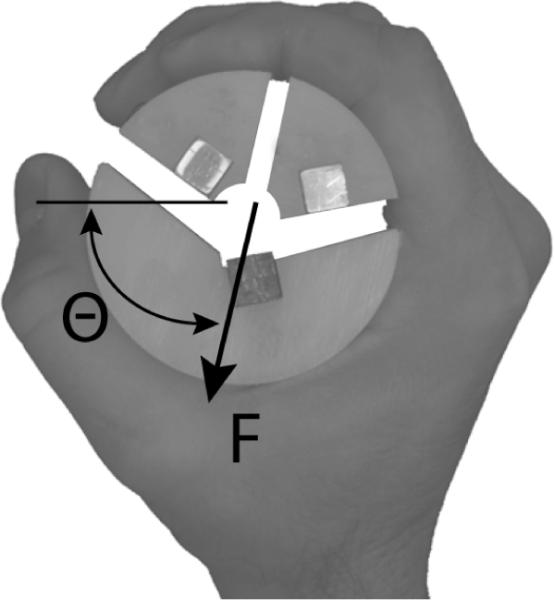
Overall grip force vector with magnitude (F) and angle (θ)
Procedure
Before testing, demographic data were collected. Data included age, height, weight, and living arrangement. Anthropometric data of hand length and breadth were also collected. Additionally, participants completed questionnaires which focused on self-reported function. Participants were seated and the grip strength testing posture recommended by the American Society of Hand Therapists was used.2 Participants were positioned with the shoulder adducted and neutrally rotated with the elbow at 90° flexion and the wrist and forearm in neutral. Both the Baseline dynamometer and the vigorimeter were held suspended by the participant. The MAP dynamometer rested on the participant's thigh. The MAP is heavier than the other two devices and holding it suspended would require a large grip forces solely to keep it from slipping out of the participant's hand. The Baseline dynamometer was set at span #2 and bulb #3 was used with the vigorimeter. For the MAP dynamometer, the metacarpal-phalangeal joint was lined up with a landmark on the handle to ensure repeatability of the hand placement.
For all devices, participants were instructed to “squeeze the handle as hard as you can and build up force as quickly as possible and hold for 5 seconds”. Participants were given verbal indication for when to begin and end each exertion. Three repetitions were completed for each hand and each device for a total of 9 exertions per hand. Participants were provided at least a one-minute break between exertions. Additionally, participants alternated hands between exertions to minimize fatigue. For each hand and for each session, the order of grip devices was randomized. All participants were retested between 1 and 2 weeks after the initial testing.
Data analysis
Both the absolute peak measure of grip force and the average of the middle three seconds or “plateau” phase of the grasp event were calculated for each repetition using the MAP dynamometer (Figure 6). The absolute peak of the force curve is analogous to the peak forces that were collected using the Baseline dynamometer and the vigorimeter. From the MAP dynamometer, four distinct measurements of grip force were evaluated for repeatability: 1) the maximum of the 3 repetitions for peak force measurement (Peakmax), 2) the maximum of the 3 repetitions for the plateau measurement (Plateaumax), 3) the average of the 3 repetitions for the peak measurement and (Peakavg), and 4) the average of the 3 repetitions for the plateau measurement (Plateauavg). In addition, the overall grip force vector angle and forces from each instrumented beam were examined for repeatability. For the Baseline dynamometer and the vigorimeter, the Peakmax and the Peakavg were evaluated for repeatability.
Figure 6.
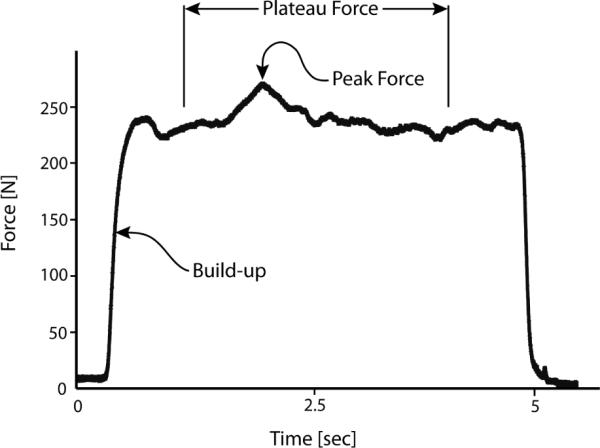
Representative force profile illustrating the build-up and plateau phases
Data analysis was completed using SPSS version 17. Two-way random effects single measure reliability intraclass correlation coefficients were calculated. Pearson correlation coefficients were used to evaluate concurrent validity between session 1 peak grip strength measures for all three devices. Repeated measures analysis of variance (ANOVA) was used to evaluate differences between testing sessions and differences between measurement devices. ANOVA was used to evaluate for differences based on age and gender. Post hoc analysis was completed using the Bonferroni multiple pair-wise comparison method. Differences were considered significant at the 0.05 level of significance.
RESULTS
Grip Force
Maximal grip force results (Peakmax) on both days for both younger and older adultss are displayed in Table 2. Session 1 grip forces for all devices were used to test whether significant differences exist between right hand grip forces for younger and older individuals as well as between males and females. Depending on the device, older adults' grip forces averaged between 60–71% of young participants' (p<0.05) and females averaged between 70–77% the force of males (p<0.05). Similar results were obtained for both methods of calculating grip force with the Baseline and vigorimeter and all four methods of calculating grip force with the MAP.
Table 2.
Peakmax grip force data
| MAP [N] | Baseline [N] | |||||||||
|---|---|---|---|---|---|---|---|---|---|---|
| Session 1 | Session 2 | Session 1 | Session 2 | |||||||
| n | Mean | (SD) | Mean | (SD) | Mean | (SD) | Mean | (SD) | ||
| Left | Younger | 14 | 226.6 | (38.8) | 219.1 | (37.0) | 379.6 | (80.2) | 384.7 | (77.5) |
| Older | 14 | 141.0 | (37.4) | 145.6 | (48.1) | 260.0 | (76.2) | 261.9 | (72.2) | |
|
|
||||||||||
| Total | 183.8 | (57.5) | 182.3 | (56.6) | 319.8 | (98.0) | 323.3 | (96.7) | ||
|
|
||||||||||
| Right | Younger | 14 | 242.3 | (51.1) | 236.0 | (45.3) | 414.6 | (84.0) | 415.9 | (85.3) |
| Older | 14 | 153.6 | (49.0) | 155.7 | (54.9) | 295.3 | (91.6) | 285.7 | (88.4) | |
|
|
||||||||||
| Total | 197.9 | (66.7) | 195.8 | (64.1) | 354.9 | (105.5) | 350.8 | (108.0) | ||
| Vigorimeter [kPa] | ||||||
|---|---|---|---|---|---|---|
| Session 1 | Session 2 | |||||
| n | Mean | (SD) | Mean | (SD) | ||
|
|
||||||
| Left | Younger | 14 | 94.3 | (20.0) | 95.5 | (18.6) |
| Older | 14 | 53.2 | (12.4) | 54.7 | (13.1) | |
|
|
||||||
| Total | 73.7 | (26.2) | 75.1 | (26.2) | ||
|
|
||||||
| Right | Younger | 14 | 103.4 | (24.6) | 100.1 | (20.7) |
| Older | 14 | 62.5 | (21.3) | 62.3 | (21.0) | |
|
|
||||||
| Total | 83.0 | (30.8) | 81.2 | (28.1) | ||
Differences between the maximum grip strength score of the three repetitions (Peakmax) and the average of the three repetitions (Peakavg) for all three devices were less than 6% (p<0.05). The results from the Peakmax and Plateaumax grip force measurements with the MAP indicate that the plateau phase of the grip force profile averaged 73% of the peak.
Differences Between Sessions
No differences (p>0.05) were detected between session 1 and session 2 for any of the four grip force variables with the MAP dynamometer or the two grip force variables with the vigorimeter and Baseline dynamometer. For session 1 and session 2, Peakmax force grip data is presented in Table 2. In addition, no differences (p>0.05) were detected for the overall grip force vector angle and the grip forces from the proximal instrumented beams between session 1 and session 2 (Table 3).
Table 3.
Session 1 and 2 data for secondary grip measurements
| Session 1 | Session 2 | |||
|---|---|---|---|---|
| Mean | (SD) | Mean | (SD) | |
| Overall Force Angle [degrees] | 88.8 | (16.3) | 88.8 | (13.9) |
| Proximal Beam Force [N] | 75.2 | (37.4) | 78.2 | (38.3) |
| Distal Beam Force [N] | 142.9 | (43.5) | 138.9 | (42.0) |
|
|
||||
Reliability
Intraclass correlation coefficients (ICC's) for the right hand ranged from 0.95 to 0.99 for all devices and measurement types (Peakmax, Peakavg, Plateaumax and Plateauavg). For the left hand, ICC's ranged from 0.94 to 0.98. Using Munro's29 correlation classification scheme, in which scores of 0.5–0.69 are considered to have a moderate correlation, 0.7–0.89 have high correlation and 0.9–1.0 have very high correlation, all devices and measurement types had “very high” correlations. The response stability and ICC's for right hand Peakmax are displayed in Table 4.
Table 4.
Response stability for the right hand
| Cronbach's | |||||
|---|---|---|---|---|---|
| Alpha | ICC | SEM | |||
| All | MAP | 0.99 | 0.99 | 5.4 | N |
| Baseline | 0.99 | 0.97 | 12.8 | N | |
| Vigorimeter | 0.98 | 0.96 | 3.9 | Kpa | |
|
|
|||||
| Older | MAP | 0.99 | 0.99 | 4.3 | N |
| Baseline | 0.98 | 0.96 | 13.4 | N | |
| Vigorimeter | 0.99 | 0.98 | 2.4 | Kpa | |
|
|
|||||
| Younger | MAP | 0.99 | 0.97 | 5.5 | N |
| Baseline | 0.98 | 0.97 | 11.1 | N | |
| Vigorimeter | 0.95 | 0.90 | 4.8 | Kpa | |
|
|
|||||
ICC's for the measures of overall grip force vector angle and the forces from each instrumented beam were between 0.92 and 0.95, indicating very high reliability.
Concurrent validity
A significant difference in grip strength measures was found between the MAP and Baseline dynamometers (p<0.05). Pearson correlation coefficients for the 3 different grip strength measurement devices indicate the MAP dynamometer had high correlations with both the Baseline dynamometer (0.88–0.90) and the vigorimeter (0.78–0.88). Correlations between the Baseline and the vigorimeter were also high (0.78–0.83). All three devices were significantly correlated with each other for both hands (p<0.001).
DISCUSSION
Both the Baseline dynamometer and vigorimeter are common clinical instruments for measuring grip strength. However, the vigorimeter measures a pressure, which is fundamentally a different measurement than those obtained with either the Baseline or MAP dynamometers. Although both the Baseline and MAP measure force, the MAP dynamometer is also able to quantify shear forces and force directions. If both instruments were grasped with the same hand geometry, the MAP, which measures both normal and shear forces, would register a greater grip force due to vector summation. However, the results of this study indicate that the participants can produce more force with the Baseline dynamometer. When grasping the Baseline, the fingers are able to curl around the handles. Alternately, when grasping a cylinder (like the MAP), the fingers are more extended and in a less biomechanically-friendly position. This results in the decreased magnitude of measured grip forces observed in this study.
In the current study, the MAP measures of peak force (Peakmax or Peakavg) and plateau force (Plateaumax or Plateauavg) all demonstrated very high reliability. The plateau phase of the grasp has been referred to as “sustained strength” in other publications.30 Although there is not consensus on whether peak or plateau force is more reliable, several studies examining both have found the peak measure of force to be more consistent than plateau force.30–32 As both measures in this study had very high reliability, either would be an appropriate measure with the MAP dynamometer. From a force magnitude standpoint, the measure of plateau force averaged 73% that of peak force. This agrees well with results from Svensson et al.,30 in which the plateau force averaged between 75–76% of the peak force. Regardless if peak or plateau (sustained) strength is used, both measures have been shown to be repeatable. In comparison, standard clinical instruments like the Jamar, Baseline or Vigorimeter only measure the peak force of the exertion and information on the plateau phase of grip is unavailable.
Another disagreement exists when considering whether to use the average grip force13, 33 of two or three repetitions or the repetition with the greatest grip force31, 34 for analysis. The results of the current study indicate that the repetition with the greatest peak force was significantly greater (~6%) than the average force of the three repetitions. This finding is consistent with that of Langerstrom and Nordgren,31 which found one-repetition maximums averaged 4–5% greater than the average of three repetitions. Both methods have demonstrated very high repeatability in the current study. Other studies have concurrently examined both methods and have also demonstrated the repeatability of both.9, 31 These findings stress the importance of stating which method is used in the analysis as both are valid and repeatable but the difference in force is approximately 4–6%.
The MAP dynamometer examined in the current study has reliability and validity consistent with other devices currently used in clinical and research settings, when testing both young participants and community dwelling older adults. This is important as evidence indicates the older adult population may have greater relative variability in grip force.2 In addition, similar differences in grip strength were observed between young participants and community dwelling older adults regardless of device. The benefit of the new device is that information about the way hands produce force can be obtained from each trial. The grip profile can be dissected to reveal information on grip force vectors, force build-up, peak force, plateau force, force variability and time to reach fatigue
Unlike the Baseline dynamometer, the MAP captures the force vectors involved in gripping. This information is important because results from Amis35 indicate that shear forces are a sizable portion of the overall grip force. Devices that only measure the scalar magnitude are unable to quantify the shear forces involved in gripping. Additionally, the MAP dynamometer can estimate the finger contributions involved in the grip27 which can help clinicians or researchers determine whether individual fingers are not contributing to the grip. As a whole, these data available from the MAP dynamometer have clinical and research importance. By understanding which components of grip strength are most affected, targeted interventions can be developed to address the specific deficits. The limitations of the MAP dynamometer include its current lack of commercial availability and the cost due to specialized fabrication and instrumentation techniques. However, the MAP provides a more comprehensive evaluation of the function of the hand than is available from standard devices.
CONCLUSION
In populations of both healthy older and healthy younger participants, the MAP dynamometer had very high reliability and high validity, similar to other devices currently used in clinical settings. Grip strength differences between healthy older and younger participants were similar regardless of device. The additional information provided by this device, including grip force vectors and angles, estimated finger contribution, and force build-up may provide valuable information to rehabilitation specialists, therapists, surgeons and designers to enhance the function of the hand.
Acknowledgements
The contents of this paper were developed under grant 1UL1RR025011 from the Clinical and Translational Science Award (CTSA) program of the National Center for Research Resources, National Institutes of Health and grant T32 AG000265 Women's Health and Aging Research and Leadership Training Grant from the National Institute on Aging
Footnotes
Publisher's Disclaimer: This is a PDF file of an unedited manuscript that has been accepted for publication. As a service to our customers we are providing this early version of the manuscript. The manuscript will undergo copyediting, typesetting, and review of the resulting proof before it is published in its final citable form. Please note that during the production process errors may be discovered which could affect the content, and all legal disclaimers that apply to the journal pertain.
The authors have not received benefits of any kind from commercial parties associated with products or companies mentioned in this article, and do not have any financial interest in such companies or products. The authors are considering intellectual property protection on their device.
REFERENCES
- 1.Mathiowetz V, Vizenor L, Melander D. Comparison of baseline instruments to the Jamar dynamometer and the B&L engineering pinch gauge. Occup Ther J Res. 2000;20:147–162. [Google Scholar]
- 2.Mathiowetz V, Kashman N, Volland G, Weber K, Dowe M, Rogers S. Grip and pinch strength - normative data for adults. Arch Phys Med Rehabil. 1985;66:69–74. [PubMed] [Google Scholar]
- 3.Gunther CM, Burger A, Rickert M, Crispin A, Schulz CU. Grip strength in healthy Caucasian adults, reference values. J Hand Surg-Am Vol. 2008;33A:558–565. doi: 10.1016/j.jhsa.2008.01.008. [DOI] [PubMed] [Google Scholar]
- 4.Vlieland T, vanderWijk TP, Jolie IMM, Zwinderman AH, Hazes JMW. Determinants of hand function in patients with rheumatoid arthritis. J Rheumatol. 1996;23:835–840. [PubMed] [Google Scholar]
- 5.Tremayne A, Taylor N, McBurney H, Baskus K. Correlation of impairment and activity limitation after wrist fracture. Physiother Res Int. 2002;7:90–99. doi: 10.1002/pri.245. [DOI] [PubMed] [Google Scholar]
- 6.Field J, Herbert TJ, Prosser R. Total wrist fusion - A functional assessment. J Hand Surg [Br] 1996;21B:429–433. doi: 10.1016/s0266-7681(96)80039-8. [DOI] [PubMed] [Google Scholar]
- 7.Rantanen T, Guralnik JM, Sakari-Rantala R, Leveille S, Simonsick EM, Ling S, Fried LP. Disability, physical activity, and muscle strength in older women: The women's health and aging study. Arch Phys Med Rehabil. 1999;80:130–135. doi: 10.1016/s0003-9993(99)90109-0. [DOI] [PubMed] [Google Scholar]
- 8.Giampaoli S, Ferrucci L, Cecchi F, Lo Noce C, Poce A, Dima F, Santaquilani A, Vescio MF, Menotti A. Hand-grip strength predicts incident disability in non-disabled older men. Age Ageing. 1999;28:283–288. doi: 10.1093/ageing/28.3.283. [DOI] [PubMed] [Google Scholar]
- 9.Bohannon RW, Schaubert KL. Test-retest reliability of grip-strength measures obtained over a 12-week interval from community-dwelling elders. J Hand Ther. 2005;18:426–427. doi: 10.1197/j.jht.2005.07.003. [DOI] [PubMed] [Google Scholar]
- 10.Fike ML, Rousseau E. Measurement of adult hand strength - a comparison of 2 instruments. Occup Ther J Res. 1982;2:43–49. [Google Scholar]
- 11.Bellace JV, Healy D, Besser MP, Byron T, Hohman L. Validity of the Dexter Evaluation System's Jamar dynamometer attachment for assessment of hand grip strength in a normal population. J Hand Ther. 2000;13:46–51. doi: 10.1016/s0894-1130(00)80052-6. [DOI] [PubMed] [Google Scholar]
- 12.Bohannon RW. Parallel comparison of grip strength measures obtained with a MicroFET 4 and a Jamar dynamometer. Percept Mot Skills. 2005;100:795–798. doi: 10.2466/pms.100.3.795-798. [DOI] [PubMed] [Google Scholar]
- 13.Molenaar HM, Zuidam JM, Selles RW, Stam HJ, Hovius SER. Age-specific reliability of two grip-strength dynamometers when used by children. J Bone Joint Surg [Am] 2008;90A:1053–1059. doi: 10.2106/JBJS.G.00469. [DOI] [PubMed] [Google Scholar]
- 14.Beaton DE, Odriscoll SW, Richards RR. Grip strength testing using the BTE work simulator and the Jamar dynamometer - a comparative study. J Hand Surg-Am Vol. 1995;20A:293–298. doi: 10.1016/s0363-5023(05)80029-2. [DOI] [PubMed] [Google Scholar]
- 15.Shechtman O, Gestewitz L, Kimble C. Reliability and validity of the DynEx dynamometer. J Hand Ther. 2005;18:339–347. doi: 10.1197/j.jht.2005.04.002. [DOI] [PubMed] [Google Scholar]
- 16.Shechtman O, Davenport R, Malcolm M, Nabavi D. Reliability and validity of the BTE-Primus grip tool. J Hand Ther. 2003;16:36–42. doi: 10.1016/s0894-1130(03)80022-4. [DOI] [PubMed] [Google Scholar]
- 17.Desrosiers J, Hebert R, Bravo G, Dutil E. Comparison of the Jamar dynamometer and the martin vigorimeter for grip strength measurements in a healthy elderly population. Scand J Rehabil Med. 1995;27:137–143. [PubMed] [Google Scholar]
- 18.Ranganathan VK, Siemionow V, Sahgal V, Yue GH. Effects of aging on hand function. J Am Geriatr Soc. 2001;49:1478–1484. doi: 10.1046/j.1532-5415.2001.4911240.x. [DOI] [PubMed] [Google Scholar]
- 19.Hyatt RH, Whitelaw MN, Bhat A, Scott S, Maxwell JD. Association of muscle strength with functional status of elderly people. Age ageing. 1990;19:330–336. doi: 10.1093/ageing/19.5.330. [DOI] [PubMed] [Google Scholar]
- 20.Gale CR, Martyn CN, Cooper C, Sayer AA. Grip strength, body composition, and mortality. Int J Epidemiol. 2007;36:228–235. doi: 10.1093/ije/dyl224. [DOI] [PubMed] [Google Scholar]
- 21.Griffith CDM, Whyman M, Bassey EJ, Hopkinson BR, Makin GS. Delayed Recovery of Hand Grip Strength Predicts Postoperative Morbidity Following Major Vascular-Surgery. Br J Surg. 1989;76:704–705. doi: 10.1002/bjs.1800760717. [DOI] [PubMed] [Google Scholar]
- 22.Windsor JA, Hill GL. Grip Strength - A Measure of the Proportion of Protein Loss in Surgical Patients. Br J Surg. 1988;75:880–882. doi: 10.1002/bjs.1800750917. [DOI] [PubMed] [Google Scholar]
- 23.Cole KJ. Age-related directional bias of fingertip force. Exp Brain Res. 2006;175:285–291. doi: 10.1007/s00221-006-0553-0. [DOI] [PubMed] [Google Scholar]
- 24.Foldvari M, Clark M, Laviolette LC, Bernstein MA, Kaliton D, Castaneda C, Pu CT, Hausdorff JM, Fielding RA, Singh MA. Association of muscle power with functional status in community-dwelling elderly women. J Gerontol A Biol Sci Med Sci. 2000;55:M192–199. doi: 10.1093/gerona/55.4.m192. [DOI] [PubMed] [Google Scholar]
- 25.Cole KJ. Grasp force control in older adults. J Mot Behav. 1991;23:251–258. doi: 10.1080/00222895.1991.9942036. [DOI] [PubMed] [Google Scholar]
- 26.Irwin CB, Radwin RG. A novel dynamometer for describing forces and vectors in the long fingers during gripping. Human Factors and Ergonomics Society Conference; Baltimore, MD. 2007. [Google Scholar]
- 27.Irwin CB, Radwin RG. Forces produced by the long fingers when gripping varying diameter cylindrical handles. Manuscript submitted for publication to Ergonomics. 2009 [Google Scholar]
- 28.Desrosiers J, Bravo G, Hebert R, Dutil E. Normative data for grip strength of elderly men and women. Am J Occup Ther. 1995;49:637–644. doi: 10.5014/ajot.49.7.637. [DOI] [PubMed] [Google Scholar]
- 29.Munro . Statistical methods for health care research. 3 ed. JB Lippincott; Philadelphia, PA: 1997. [Google Scholar]
- 30.Svensson E, Waling K, Haeger-Ross C. Grip strength in children: Test-retest reliability using Grippit. Acta Paediatrica. 2008;97:1226–1231. doi: 10.1111/j.1651-2227.2008.00895.x. [DOI] [PubMed] [Google Scholar]
- 31.Lagerstrom C, Nordgren B. On the reliability and usefulness of methods for grip strength measurement. Scand J Rehabil Med. 1998;30:113–119. doi: 10.1080/003655098444228. [DOI] [PubMed] [Google Scholar]
- 32.van Meeteren J, van Rijn RM, Selles RW, Roebroeck ME, Stam HJ. Grip strength parameters and functional activities in young adults with unilateral cerebral palsy compared with healthy subjects. J Rehabil Med. 2007;39:598–604. doi: 10.2340/16501977-0095. [DOI] [PubMed] [Google Scholar]
- 33.Mathiowetz V, Weber K, Volland G, Kashman N. Reliability and validity of grip and pinch strength evaluations. J Hand Surg-Am Vol. 1984;9A:222–226. doi: 10.1016/s0363-5023(84)80146-x. [DOI] [PubMed] [Google Scholar]
- 34.Mathiowetz V. Effects of three trials on grip and pinch strength measurements. J Hand Ther. 1990;3:195–198. [Google Scholar]
- 35.Amis AA. Variation of finger forces in maximal isometric grasp tests on a range of cylinder diameters. J Biomed Eng. 1987;9:313–320. doi: 10.1016/0141-5425(87)90079-3. [DOI] [PubMed] [Google Scholar]


