Abstract
All-trans-retinal is the precursor of A2E, a fluorophore within lipofuscin, which accumulates in human retinal pigment epithelial (hRPE) cells and contributes to age-related macular degeneration. Here we have compared the in vitro dark cytotoxicity and visible-light-mediated photoreactivity of all-trans-retinal and A2E in hRPE cells.
All-trans-retinal caused distinct cytotoxicity in hRPE cells measured with MTS and LDH assays. Significant increases in intracellular oxidized glutathione (GSSG), extracellular GSH and GSSG levels and lipid hydroperoxide production were observed in cells incubated in the dark with 25 and 50 μM all-trans-retinal. Light modified all-trans-retinal's harmful action and decreased extracellular glutathione and hydroperoxide levels.
A2E (<25 μM) did not affect cell metabolism or cytoplasmic membrane integrity in the dark or when irradiated. 25 μM A2E raised the intracellular GSSG level in hRPE cells to a much smaller extent than 25 μM all-trans-retinal. A2E did not induce glutathione efflux or hydroperoxide generation in the dark or after irradiation.
These studies support our previous conclusions that although A2E may be harmful at high concentrations or when oxidized, its phototoxic properties are insignificant compared to those of all-trans-retinal. The endogenous production of A2E may serve as a protective mechanism to prevent damage to the retina by free all-trans-retinal.
Introduction
Retinoids - retinol, retinaldehyde and retinyl esters - are vitamin A metabolites that are major constituents in the vertebrate visual cycle (1-4). Light that reaches the rod or cone outer segments in the retina induces photoisomerization of 11-cis-retinal, a visual chromophore combined with rhodopsin to all-trans-retinal, which accumulates in the photoreceptor outer segments (4-6). Most of the all-trans-retinal (atRal) is released from opsin into the disc lumen (5), after which the chromophore is transported from the inside of disc membranes into the cytoplasm (5, 7) by the photoreceptor specific ATP-binding cassette transporter (ABCA4/ABCR) (5, 8, 9) localized in the rim of the photoreceptor disc (3). There, all-trans-retinal is reduced to the less reactive all-trans-retinol by NADPH-dependent all-trans-retinol dehydrogenases (RDHs) such as RDH8, RDH11 and RDH12 (1, 2, 4, 5, 7, 10). Photoreceptors are unable to reisomerize all-trans-retinal or all-trans-retinol back to 11-cis-retinal (11). Thus, all-trans-retinol is transported to the retinal pigment epithelial (RPE) cells, esterified by lecithin-retinol acyltransferase (LRAT), recycled to 11-cis-retinal and translocated back to the photoreceptors (5).
The RPE cells form a single-cell layer that is the most distal layer of the retina. The role of the RPE is not limited to only the recycling processes of the visual cycle. The cells also transport ions, water, and metabolic end products from the subretinal space to the blood (11) and deliver nutrients such as glucose, retinol, and fatty acids in the opposite direction - from the blood to the photoreceptors. Moreover, the RPE cells phagocyte light-damaged photoreceptor outer segments in a circadian regulated process, and then shed, digest, recycle and transport the essential elements of their contents back to the photoreceptors (11, 12).
All-trans-retinal in its free form is a highly reactive molecule. When it is released from photoactivated rhodopsin it can react with phosphatidylethanolamine (PE), a primary amine that is present in membranes of the photoreceptor outer segments at relatively high abundance. A fraction of all-trans-retinal -PE adduct can undergo further condensation leading to formation of A2E (13). The precursor of the A2E chromophore is transported to the RPE cells in phagocytosed photoreceptor outer segments. It can be also synthesized in the retinal pigment epithelial cells and removed (14). However with age, it is observed that A2E and other fluorescent chromophores (15) accumulate in human retinal pigment epithelial (hRPE) cells in the form of granules called lipofuscin. In advanced age, the concentration of A2E can reach 20 μM (14, 16, 17). Lipofuscin accumulation increases particularly in the elderly and is considered to be one of the causative factors of age-related macular degeneration (AMD). This disease is a major cause of visual impairment in the United States and the leading cause of legal blindness for people over age 65. It is estimated that more than 1.5% of Caucasians at age more than 70 years old suffer advanced AMD and another 10% have symptoms of early macular degeneration (18).
Most all-trans-retinal molecules formed in the photoreceptor outer segments are reduced to all-trans-retinol or undergo condensation processes before they reach RPE cells during phagocytosis. However, it was postulated that intensive illumination would rapidly generate substantial amounts of all-trans-retinal, which then would be present in phagocytosed outer segment disks in the RPE cells (19). The results of the most recent studies performed on Rdh8-/-Abca4-/- mice suggest that loss of the all-trans-RDHs, RDH8 and RDH12 enzymes, which facilitate conversion of all-trans-retinal to all-trans-retinol in the RPE, can cause atRal to excessively accumulate in the photoreceptors and diffuse into the RPE (5), where it can be stored in lipofuscin (20). All-trans-retinal is also synthesized inside the RPE cells. The oxidative cleavage of β,β-carotene catalyzed by β,β-carotene-15,15′-dioxygenase leads to atRal formation under dark or photic conditions directly in the RPE (21). Additionally, atRal is synthesized in the RPE cells from all-trans-retinol of the retinylester pool (11) and plays a role as a substrate of retinal G protein-coupled receptor (RGR), a microsomal opsin present in the RPE cells (21). It was shown that all-trans-retinol is oxidized efficiently by a specific retinol dehydrogenase and that significant amounts of all-trans-retinal accumulate in ARPE-hRGR and bovine RPE cells in the absence of light (21).
Adult human retinal pigment epithelium and the anterior layers of the retina constantly receive intense visible light (>400 nm) (22). There are several endogenous RPE chromophores including melanin, the mitochondrial enzyme cytochrome-c oxidase and riboflavin that can act as potential photosensitizers that may be responsible for visible light short-wavelength damage to the RPE (23). However, their photoreactivity is negligible compared to lipofuscin or all-trans-retinal (3, 24-26). A2E is one of the retinoid chromophores isolated from ocular lipofuscin and has been reported to be a potential photosensitizer (23). A2E absorbs in the visible range of light and is characterized by two maxima at 336 and 439 nm (27). Although the absorbance spectrum of all-trans-retinal is located mostly in UV with a maximum at 380 nm, it partially absorbs in the visible light range up to ∼450 nm (25).
We report here a series of experiments comparing the toxicity and phototoxicity of two retinal chromophores, A2E and all-trans-retinal. The results of experiments carried out in vitro proved that although both chromophores produce superoxide anion during irradiation with visible light, A2E does so less efficiently (26, 28). Both chromophores exposed to ultraviolet irradiation also generate singlet oxygen (14, 26, 28, 29), but the 1O2 photoproduction yield of A2E is at least one order of magnitude lower than that of its precursor. In addition, it was found that A2E also has antioxidant properties. It quenches singlet oxygen with about the same efficiency as vitamin E (14).
We present here a comparison of the in vitro visible-light photoreactivity of A2E and its precursor all-trans-retinal and dark cytotoxicity of both of these chromophores in hRPE cells.
Materials and Methods
Reagents
All-trans-retinal, bovine albumin (fraction V), butylated hydroxytoluene, cumene hydroperoxide, DMSO sterile, FeSO4·7H2O, sodium nitrite, and 5-sulfosalicylic acid were purchased from Sigma (St. Louis, MO, USA), ethanolamine, HClO4, potassium chromate, triphenylphosphine and xylenol orange from Aldrich (Milwaukee, WI, USA), and sodium carbonate anhydrous from Mallinckrodt (Paris, KY, USA). All reagents used for experiments were at least analytical grade.
Synthesis of A2E
A2E was synthesized as described previously (27). Briefly, a mixture of all-trans-retinal and ethanolamine (2:1 ratio) was incubated at room temperature for 2 days. The post-synthesis mixture was purified by silica gel column chromatography and then by HPLC. The purity of A2E was checked using HPLC and TLC methods. The A2E concentration was determined by absorption spectroscopy (27) using a Hewlett Packard diode array 8453 spectrophotometer (Hewlett Packard GmbH, Waldbronn, Germany). Dry A2E samples were stored under argon at -70°C for further use.
Cell cultures
The human RPE cells were isolated from donor eyes using the method of Hu et al. (30) and cultured in Falcon tissue culture Ø10 cm dishes (Becton Dickinson Labware, Franklin Lakes, NJ, USA) with F-12 nutrient mixture containing 1.5 mM L-glutamine and supplemented with 10% fetal bovine serum, and 50 μg/ml gentamicin (Gibco, Grand Island, NY, USA). Cells were in the 15th – 22nd passage. They were detached by 0.125% trypsin solution (Gibco, Grand Island, NY, USA), diluted 1:3-1:4 and plated for subculture in 96-well plates (Corning Incorporated, Corning, NY, USA) for cell viability and cytotoxicity assays, and in the Falcon dishes for the remaining experiments.
The hRPE cells used in the present study consisted of one cell line of pure culture of cells in active growth status. The purity of the cell line was demonstrated by immunocytochemical methods: hRPE cells display S-100 and cytokeratin, uveal melanocytes display S-100 antigen but not cytokeratin, and fibroblasts display neither of these proteins (31).
The average cell density was (43.0 ± 5.6)·103 cells/well in the 96-well plate and (2.8 ± 0.8)·106 cells/dish in the Falcon dishes.
Cell incubation with all-trans-retinal and A2E
All-trans-retinal and A2E were reconstituted in DMSO and diluted with the medium to the required concentration immediately before addition to the cell culture. In most experiments, the cells were incubated in the dark with 10 - 25 μM A2E, which mimics the highest concentration of accumulated A2E in the elderly (16) or with 20 - 50 μM all-trans-retinal. Although the concentrations of atRal and A2E were comparable in all experiments, we also incubated the cells in medium containing 50 μM all-trans-retinal. We used an atRal concentration twice as high as the maximal concentration of A2E in order to test the potential significance of all-trans-retinal condensation and subsequent A2E synthesis for protection of the RPE cells against cyto- and phototoxic effects of atRal, since one A2E molecule is a condensation product of two all-trans-retinal molecules. The DMSO concentration was 0.3% in all treatment solutions including control samples, which were incubated in medium without any chromophore. Samples were maintained at 37°C in an air atmosphere containing 5% CO2 for 0–24 h to determine dark toxicity and for 5 h prior to light exposure. The amounts of all-trans-retinal and A2E incorporated into the cells and the total lipid contents were determined by thin layer chromatography.
Light exposure
The hRPE cells were irradiated directly in the covered plates in which they had been grown by two fluorescent bulbs (Philips F40AX50, 40 W, 5000 K, Advantage X, Sommerset, NJ, USA), through a horizontal liquid filter [aqueous solution of NaNO2 (50 g/l), K2CrO4 (0.2 g/l) and Na2CO3 (1 g/l)] with a 1 cm pathlength transmitting wavelengths longer than 400 nm. Cells were irradiated for 0–20 min at a light intensity of 6.1 W/m2.
Cell metabolic activity and cell membrane permeability assays
After the specified incubation time, the nutrient mixture containing 10% FBS was exchanged for medium supplemented with 2% FBS during the all-trans-retinal dark toxicity experiments or for PBS in the plates containing cells assigned for irradiation. After light exposure, PBS was replaced with the 2% FBS medium. The cells were incubated in the dark at 37°C in a 5% CO2 atmosphere for about 18 h. Cell metabolic activity and cell membrane permeability were determined using MTS (The CellTiter 96® AQueous Non-Radioactive Cell Proliferation Assay, Promega Corp., Madison, WI, USA) and LDH assay (The CytoTox 96® Non-Radioactive Cytotoxicity Assay, Promega Corp., Madison, WI, USA), respectively.
Absorption spectra
After 5-hour incubation with 20, 30 or 50-μM atRal or 25-μM A2E in 10-cm Petri dishes, the medium was collected and centrifuged at 140g and 22°C for 6 min. Each cell pellet was resuspended in 5-ml PBS and the cell suspensions were transferred to the corresponding cell dishes. The cells were exposed to visible light or stored in the dark for 20 min as described above. Then they were scraped off, transferred to 15-ml tubes and centrifuged at 3000g and 4°C for 10 min. Supernatant was removed and 1 ml of it was left in each tube. A half ml of each cell suspension was extracted with 800 μl of CHCl3/CH3OH (2:1) mixture for 4 min. The remaining cell suspension was used for protein content determination. The entire lower (organic) layer (∼600 μl) was transferred to empty tubes and evaporated in N2. Each sample was reconstituted in 500 μl MeOH. Absorption spectra were recorded in a 0.5-cm spectrophotometric cell using a Hewlett Packard diode array 8453 spectrophotometer (Hewlett Packard GmbH, Waldbronn, Germany).
Preparation of cell samples for glutathione and hydroperoxide determination
Each medium containing one of the chromophores was replaced with 5 ml of PBS after dark incubation. Directly after light exposure, 325 μl of PBS supernatant was taken from each dish and transferred to a tube containing 325 μl of 5% solution of 5-sulfosalicylic acid (SSA). The tube contents were mixed intensively and placed on ice for protein precipitation. After 5 min incubation the samples were centrifuged at 10000 g and 4°C for 5 min. Two 250 μl volumes of each supernatant were placed in separate tubes for the extracellular glutathione assay – total (GSx) and the oxidized form (GSSG), respectively. The samples were stored at -80°C until the assay. The remaining volume of PBS was removed from each cell plate and replaced with 0.5 ml HCl (10 mM). The cells were scraped off, placed in separate tubes and diluted with the HCl solution to 1 ml. A half of milliliter of each cell suspension was transferred to separate tubes containing 0.8 ml of extraction mixture [50 μM solution of BHT in CHCl3/CH3OH (2:1)], intensively shaken for a minute and centrifuged as previously. 700 μl of the lower (chloroform) phase was transferred from each tube to an empty one, evaporated in a nitrogen stream and stored at -80°C until the hydroperoxide determination. The remaining volume of each cell suspension was sonicated (Ultrasonic Homogenizer 4710 Series, Cole-Parmer instruments Co., Chicago, IL, USA) for 10 s and centrifuged as previously. 50 μl aliquots of each supernatant were placed in empty tubes and the samples were stored at -80°C for protein assay. To prepare samples for intracellular glutathione determination, 325 μl of each cell supernatant was transferred to separate tubes containing 325 μl of 5% SSA and treated in the same way as the samples designated for external glutathione determination.
Determination of glutathione
Both extra- and intracellular concentrations of total and oxidized (GSSG) glutathione were determined using the assay previously described (32). The concentration of the reduced form (GSH) was calculated in accordance with the equation: GSH = GSx – 2·GSSG. The cellular redox state of intracellular glutathione was expressed as the ratio GSH/GSSG.
Hydroperoxide assay
The modified ferric-xylenol orange (FOX) assay was used for quantifying concentrations of hydroperoxides (33-35). Non-lipid hydroperoxides were determined after incubation of samples with triphenylphosphine (TPP) (34, 35).
Each sample of the evaporated chloroform phase was dissolved in 25 μl of methanol and stored on dry ice. Ten microliters of each solution was added to 90 μl of methanol or 11.1 mM of TPP solution in CH3OH to determine all ROOH and non-lipid hydroperoxides, respectively. The samples were mixed and incubated for 30 min at room temperature in the dark. To prepare the FOX reagent solution, 2.78 mg of FeSO4·7H2O was dissolved in 1 ml of XO (2.5 mM) solution in HClO4 (1.1 M). Then 18 ml of BHT (4.44 mM) solution in methanol, 1.5 ml of the XO solution in HClO4 and 0.5 ml of the iron (II) solution were mixed together in a vial. At the end of the incubation time 0.9 ml of the FOX reagent was added to each sample and stored for another 30 min. After that, the samples were mixed and centrifuged at 2400 g and 22°C for 10 min. Absorbance of the samples was measured at 560 nm using a Hewlett Packard diode array 8453 spectrophotometer (Hewlett Packard GmbH, Waldbronn, Germany). Cumene hydroperoxide was used as a standard for a calibration curve in each assay.
LOOH concentration was calculated by subtraction of the non-lipid hydroperoxide concentration from the total ROOH concentration.
Protein determination
Protein concentration was determined using a Protein Assay Kit (Pierce, Rockford, IL, USA) containing bicinchoninic acid (BCA). The samples assigned for protein determination were diluted with PBS. The assays were carried out in 96-well plates. Absorbance of the samples was measured at 560 nm in a GENios plate reader (TECAN Austria GmbH, Grödig/Salzburg, Austria). Bovine albumin was used as a standard.
Statistical analysis
Data in graphs are presented as average ± SD of four to six measurements.
Results
Dark cytotoxicity
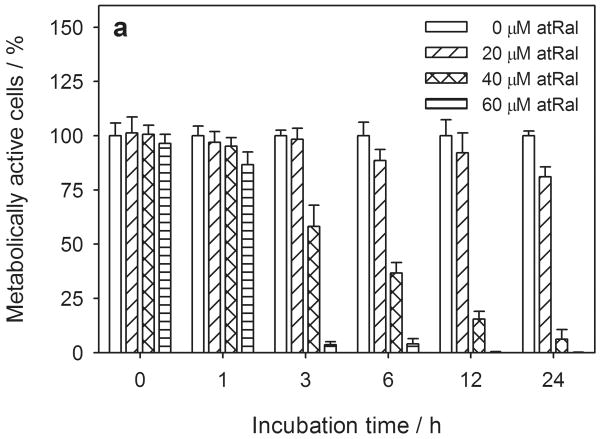
Preliminary experiments determined that all-trans-retinal (atRal) and A2E were incorporated into human RPE cells as monitored by thin layer chromatography (data not shown). All-trans-retinal significantly impaired the metabolism of hRPE cells at concentrations higher than 20 μM (Fig. 1a) in a dose dependent manner as measured by the MTS assay. After a 3-hour treatment at 20 μM atRal there was some decrease in viability (∼20% after 24 hours), at 40 μM there was a larger (∼40%) decrease, and at 60 μM, metabolic activity was almost complete inhibited.
Figure 1.
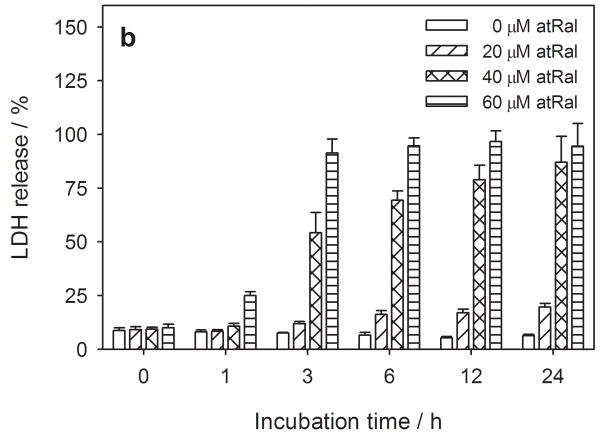
Cytotoxic effect of all-trans-retinal (atRal) on human RPE cells. Cells cultured in a 96-well plate were incubated in the dark up to 24 hours in medium supplemented with 0-60 μM atRal. Metabolic activity of the cells and cytoplasmic membrane integrity were monitored using the MTS assay (a) and LDH assay (b). Metabolic activity of the cells incubated with atRal was normalized to the sample containing no retinal incubated for the same time. Cell membrane permeability expressed as the concentration of LDH released from the cells was normalized to the total concentration of LDH in cells treated in the same way and lysed before the assay.
All-trans-retinal treatment of the hRPE cells did induce release of lactate dehydrogenase (LDH) from the cells (Fig. 1b) and was also dose dependent from 20 μM through 60 μM. At the maximum concentration tested (60 μM) LDH efflux was observed in the cells just after an hour, with total release of LDH within 3 hours of treatment.
However, when the hRPE cells were incubated with 10-25 μM A2E, no significant changes in cell metabolic activity or LDH efflux from the cells were observed even after 24 hours of treatment (data not shown).
The effect of light on cell metabolism and cytoplasmic membrane integrity
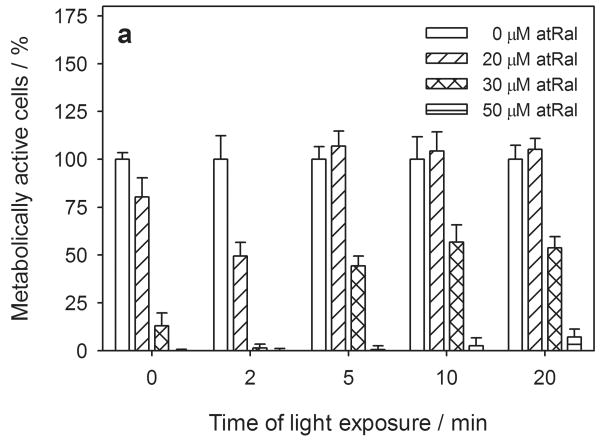
We further investigated the effect of visible light exposure on the metabolism and cytoplasmic membrane permeability of hRPE cells with 0, 20, 30 and 50 μM all-trans-retinal. Incubation of hRPE cells for 5 hours in the dark caused a decrease in their metabolism by ∼20%, ∼90% and even more when the medium contained 20, 30 and 50 μM all-trans-retinal, respectively (Fig. 2a). A two-minute light (λ > 400 nm) exposure of the cells preincubated with 20 μM atRal diminished their metabolic activity to ∼50% and almost stopped it in cells pretreated with 30 μM atRal. Interestingly, prolonged irradiation lessened the harmful action of retinal. Metabolism of the cells preincubated with 20 μM atRal and irradiated for up to 20 min totally recovered while those treated with the higher concentration of the retinoid recovered to a level of 50%. A very slight increase in metabolic activity was observed in the human RPE cells preincubated with 50 μM atRal and exposed to visible light for 20 min.
Figure 2.
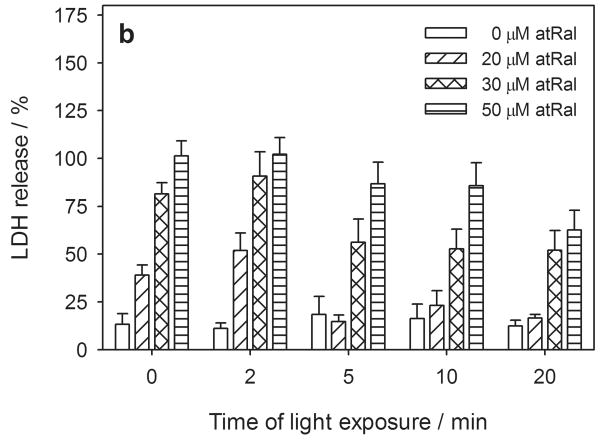
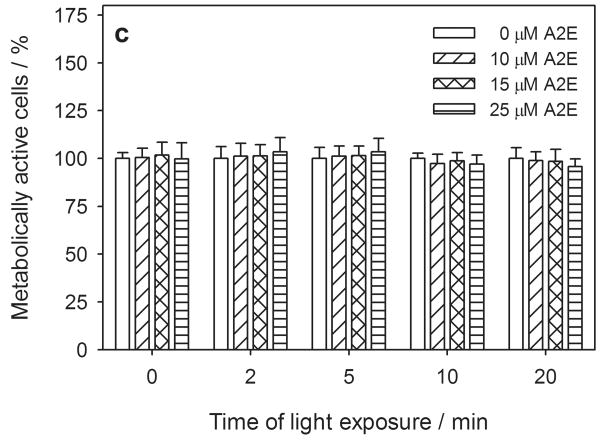
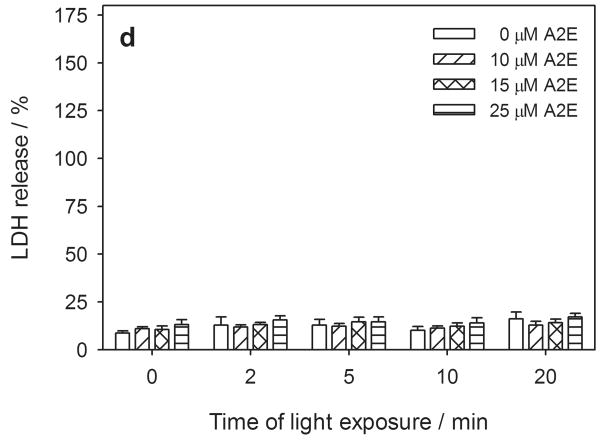
Metabolic activity and cytoplasmic membrane permeability in human RPE cells pretreated with 0-50 μM all-trans-retinal (atRal) (a, b) or 0-25 μM A2E (c, d) and exposed to visible light. The cells cultured in 96-well plates were incubated in medium containing atRal or A2E for 5 hours. Then the medium was replaced with PBS and the cells were exposed to light (λ>400nm, 6.1 W/m2) for up to 20 min. After irradiation the cells were incubated overnight in medium containing 2% FBS. Metabolic activity of the cells and their cytoplasmic membrane permeability were determined with the MTS assay (a) and LDH assay (b). In each series of different irradiation time experiments, the metabolic activity of the cells was normalized to the sample containing no retinal. LDH release in each sample was normalized to cells treated and irradiated in the same way but lysed before the assay.
Cytoplasmic membrane permeability, as monitored with the LDH assay, showed changes corresponding to metabolic activity in the hRPE cells preloaded with atRal and exposed to visible light (Fig. 2b). The LDH efflux from cells pretreated with 20 μM atRal increased from 40% detected in cells stored in the dark to ∼50% in samples irradiated for 2 min and decreased to the level of 20% during prolonged irradiation. A similar effect was observed in the cells pretreated with 30 μM atRal - nearly 80% of LDH was released from the cells in the dark, while the LDH level increased in cells exposed to light for 2 min and dropped to ∼50% in cells irradiated for a longer time. Preincubation of human RPE cells with 50 μM atRal in the dark induced significant cell membrane permeability, which caused release of almost all the LDH from the cells. Samples of the cells pretreated with 50 μM atRal and irradiated longer than 2 min showed a lower level of LDH released from the cells to their surroundings.
However, A2E incorporated into hRPE cells showed neither detectable cytotoxicity in the dark nor when irradiated with visible light at λ > 400 nm (Fig. 2c, d), with either the MTS or LDH assays.
Absorption spectra
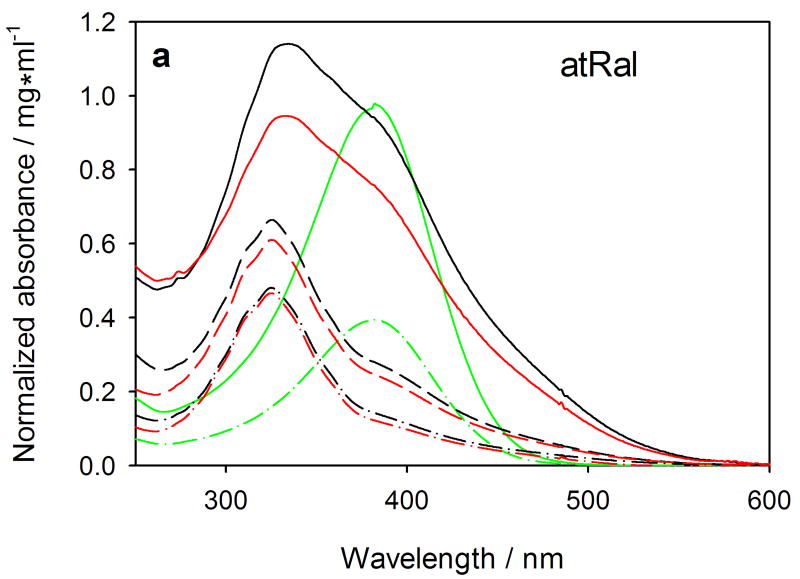
The absorption spectrum of 20 μM all-trans-retinal in methanol is characterized by one broad band with a maximal absorbance at 382 nm (Fig. 3a). The chromophore absorbs mostly in the UVA and in the short-wavelength range of visible light. No significant shift of the maximal absorbance wavelength was observed in a 50 μM atRal spectrum that could indicate aggregation of the retinoid. However, after 5-hour incubation with 20 μM atRal, the absorption spectrum of the chloroform/methanol extract from hRPE cells differed significantly from that of the initial chromophore. The main absorption spectrum band was shifted toward short wavelengths and the maximal absorbance was at 325 nm, but the original all-trans-retinal component remained as a small fraction. The absorption spectrum of the extract from the cells incubated with 30 μM atRal was generally similar to that obtained after the 20-μM retinal incubation. However, the extract of cells treated with 50-μM atRal was characterized by a short-wavelength band with the maximum at 332-334 nm. The absorbance of the long-wavelength one was relatively much higher (A382/A334 = 0.82) in comparison to the lower atRal concentration extracts – A382/A325 was 0.30 and 0.42 for the 20-μM and 30-μM atRal extracts, respectively (Table 1).
Figure 3.
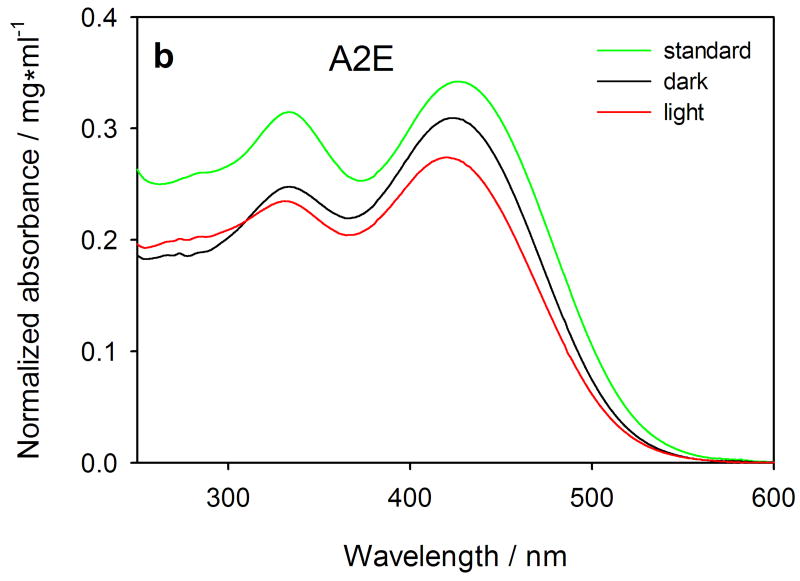
Absorption spectra (normalized to protein content) of extracts of human RPE cells treated with 20 (dashed-dotted-dashed lines), 30 (dashed lines) or 50 μM (solid lines) all-trans-retinal (atRal) (Fig. a) or 25 μM A2E (Fig. b). After treatment with a retinoid, the cells were exposed to visible light (red lines) or stored in the dark (black lines), collected and divided into 2 equal samples. One of them was used to extract the retinoids in CHCl3/CH3OH (2:1) mixture. The lower (organic) layer was evaporated in gaseous nitrogen, reconstituted in methanol and absorption spectra were recorded in a spectrophotometric cell with 0.5-cm pathlength. The remaining cell samples were used for determination of protein content with the BCA assay. Standard solutions (green lines) of 20 (dashed-dotted-dashed) and 50 μM (solid) atRal and 25 μM A2E were prepared in methanol and absorption spectra were recorded in the same spectrophotometric cell.
Table 1.
| catRal (μM) |
Treatment | λp (nm) |
Ap | λr (nm) |
Ar | Ar/Ap |
|---|---|---|---|---|---|---|
| 20 | dark | 325 | 0.481 | 382 | 0.142 | 0.30 |
| 20 | light | 325 | 0.466 | 382 | 0.122 | 0.26 |
| 30 | dark | 325 | 0.664 | 382 | 0.280 | 0.42 |
| 30 | light | 325 | 0.610 | 382 | 0.247 | 0.40 |
| 50 | dark | 334 | 1.140 | 382 | 0.940 | 0.82 |
| 50 | light | 332 | 0.945 | 382 | 0.757 | 0.80 |
catRal – atRal concentration used for incubation with cells;
λr, λp – wavelengths of the broad band maximal absorbances
(Ar and Ap) of atRal and its product absorption spectra, respectively
Light exposure of atRal treated cells caused a decrease of the extract absorbance normalized to protein content (Fig. 3a). The strongest drop of the absorbance was observed in extracts of cells incubated with 50-μl atRal. Simultaneously, the ratio of absorbance at 382 nm to the short-wavelength band one (Ar/Ap) decreased in each concentration in samples of cells exposed to light compared to those stored in the dark (Table 1).
The absorption spectrum of the extract of the cells incubated with 25-μM A2E and stored in the dark was virtually the same as the A2E standard (Fig. 3b). Light exposure caused a slight absorbance decrease of both extract bands and a 5-nm hypsometric (blue) shift.
Intracellular glutathione
Glutathione acts as an important molecule in the cellular antioxidant system, with the ratio of its reduced to its oxidized form used as a factor in describing the cellular redox state. A considerable increase of the concentration of the oxidized form of glutathione inside the cells or an efflux from them can serve to indicate a harmful effect of toxins or other environmental factors on the cells.
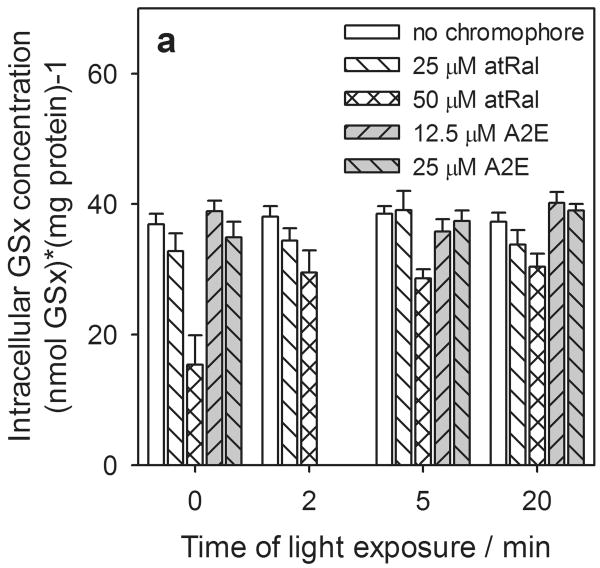
When hRPE cells were incubated for five hours in the presence of 25 μM atRal, the total glutathione concentration (∼37 nmol / mg protein) in the cells was not affected in comparison to control cells (Fig. 4a). A lowered level (∼15 nmol / mg protein) of intracellular GSx was observed only when the cells were preincubated in medium containing 50 μM atRal and not exposed to light. Cells irradiated with visible light did not show changes in the cellular GSx level, when they were preincubated with 25 μM atRal the GSx level was comparable to that in hRPE cells untreated with all-trans-retinal. In cells preincubated with 50 μM atRal a gradual increase in the GSx level was observed in samples exposed for a longer time.
Figure 4.
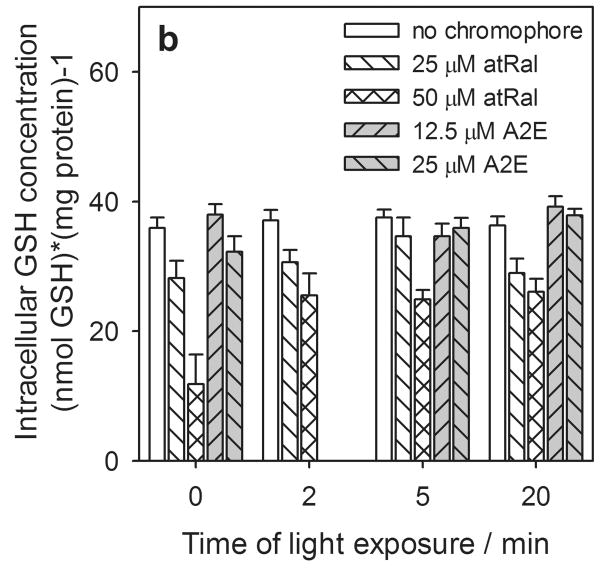
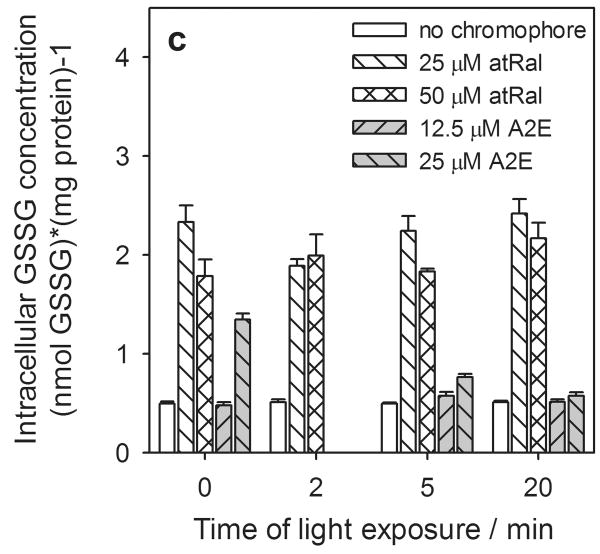
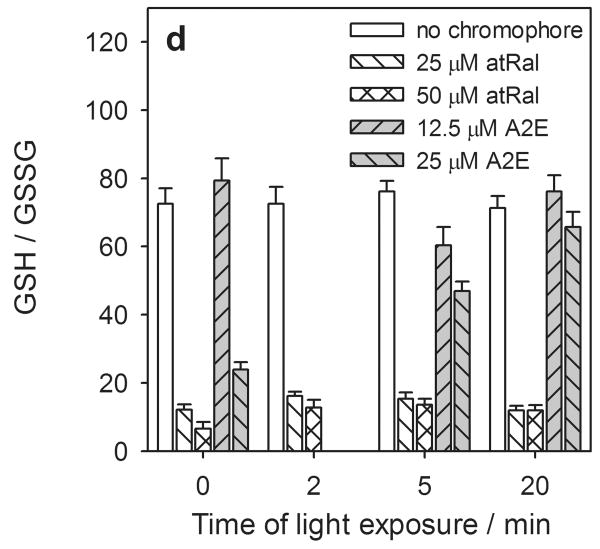
Concentration of intracellular total glutathione (GSx) (a), reduced (GSH) (b) and oxidized (GSSG) (c) forms and redox state expressed as a ratio of GSH/GSSG (d) in human RPE cells preincubated with all-trans-retinal (atRal) or A2E and exposed to visible light. Cells were incubated in the dark in medium containing 25 and 50 μM atRal or 12.5 and 25 μM A2E for 5 hours. Then the medium was replaced with PBS and the cells were exposed to light (λ>400nm) or stored in the dark (control) for 5 or 20 min. Cells were collected for internal total and oxidized glutathione assays immediately after irradiation. The reduced glutathione concentration was calculated as GSH = GSx – 2·GSSG. The determined concentration of each form of glutathione was normalized to protein concentration in the same cell sample.
There was no significant effect of A2E at concentrations of up to 25 μM on intracellular total glutathione concentration in hRPE cells with either a 5 or 20 min light exposure or retained in the dark (Fig. 4a). The changes in the level of the reduced glutathione form inside the cells were similar to the intracellular total glutathione (Fig. 4b).
In contrast, the presence of all-trans-retinal in hRPE cells caused a substantial increase in the oxidized form of glutathione (Fig. 4c). Incubation of the cells in a medium containing 25 μM atRal raised the intracellular GSSG level by about a factor of 4 compared to the cells not fed with retinal. When the cells were exposed to light for 2 minutes the concentration of the glutathione oxidized form decreased by ∼20%. Under prolonged irradiation, the GSSG concentration in the cells increased to its level in unexposed cells. Cells incubated in medium containing 50 μM atRal and stored in the dark exhibited a slight decrease of the GSSG level compared to cells pretreated with 25 μM atRal. When cells preincubated with 50 μM retinoid were exposed to light the intracellular GSSG concentration increased slightly.
In the cells fed with A2E, the intracellular GSSG concentration did not reach such a high level (Fig. 4c) as in the presence of atRal. Cells incubated in medium containing 12.5 μM A2E showed a level of oxidized glutathione similar to that of the control cells. However, the presence of 25 μM A2E in the incubation medium caused an almost 3-fold increase in intracellular GSSG concentration. Then, with a 20 min light exposure, the level of oxidized glutathione decreased to one comparable to that in cells not treated with A2E.
The cellular redox state
The cellular redox state of glutathione depended on the concentration of a chromophore incorporated into hRPE cells (Fig. 4d). Incubation of the cells in the presence of 25 and 50 μM atRal led to a fall in the GSH/GSSG ratio by almost 70% and more than 80%, respectively. During irradiation of the hRPE cells, significant changes in the cellular redox state were not observed in either the retinal-laden cells or the control ones.
In hRPE cells preincubated in medium containing 12.5 μM A2E, the GSH/GSSG ratio did not change significantly compared to the controls. However, the presence of 25 μM A2E in the nutrient mixture decreased the cellular redox state of glutathione by ∼70% in cells stored in the dark. Light exposure caused an increase in the GSH/GSSG ratio in cells pretreated with 25 μM A2E. Cells irradiated for 20 min had a GSH/GSSG ratio ∼2.8 times higher than cells kept in the dark.
Extracellular glutathione
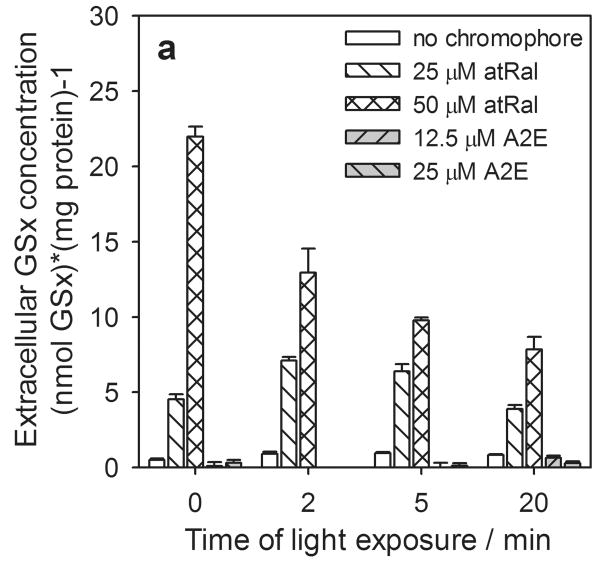
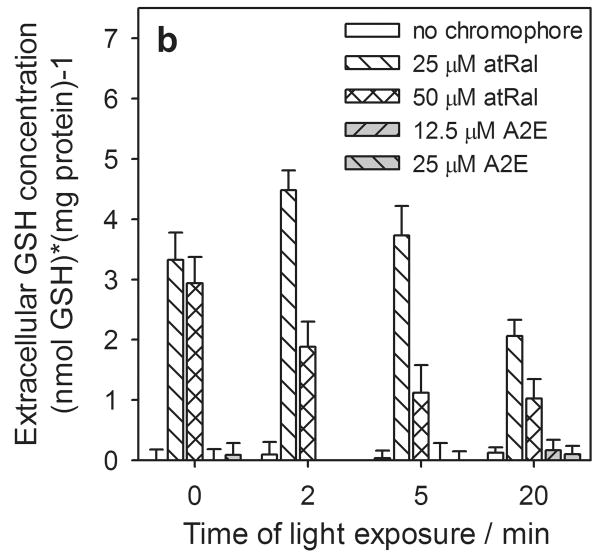
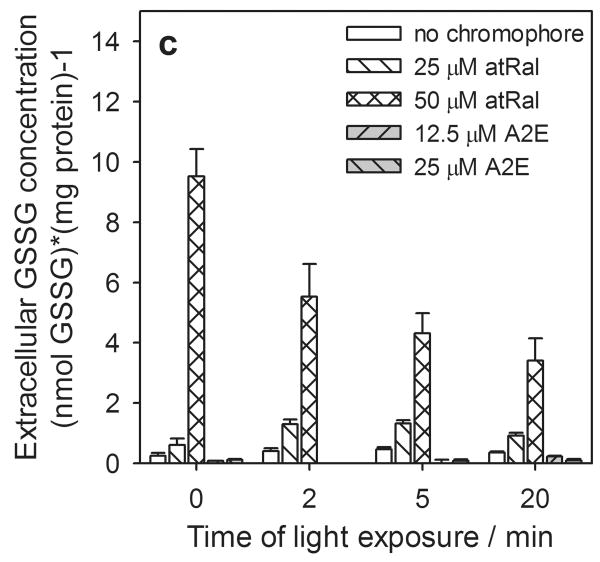
In samples containing hRPE cells incubated in the dark the levels of the extracellular total, reduced and oxidized forms of glutathione rose rapidly at the higher concentrations of atRal (Fig. 5). For 50 μM atRal the levels of both the total and oxidized glutathione forms were ∼30 times higher (Fig. 5a, c), while GSH increased by a factor of ∼14 (Fig. 5b) compared to controls. When cells previously incubated in medium containing 25 μM atRal were irradiated with visible light, an initial increase was generated in extracellular glutathione concentration (total glutathione - more than 50% and twofold in GSSG) (Fig. 5a, c). The level of GSH rose only slightly (Fig. 5b). Prolonged exposure decreased the level of all forms of glutathione and after 20 min of illumination, GSx and GSSG concentrations returned to values comparable to the initial ones (Fig. 5a, c) while the GSH level decreased by a half (Fig. 5b). The extracellular amounts of all forms of glutathione decreased monotonically when the cells preincubated with 50 μM atRal were irradiated for a longer time period. Nevertheless, after 20 min irradiation, the concentrations of all extracellular glutathione forms remained at a level about 7 times higher than in the control cells.
Figure 5.
The changes in extracellular glutathione determined in the supernatant of human RPE cells pretreated with all-trans-retinal (atRal) or A2E and exposed to visible light. Cells were incubated in the dark in medium containing 25 and 50 μM atRal or 12.5 and 25 μM A2E for 5 hours. The medium was replaced with PBS and the cells were exposed to light (λ>400nm) for 5 or 20 min or stored in the dark (control). Directly after irradiation the cell supernatant was collected, treated appropriately as described in Methods and frozen. Total glutathione (GSx) (a) and its oxidized form GSSG (c) were determined with the DTNB assay. Concentration of the glutathione reduced form (GSH) (b) was calculated in accordance with the equation: GSH = GSx – 2·GSSG. The concentration of each glutathione form was normalized to protein concentration in the same sample of hRPE cells.
The presence of A2E in hRPE cells did not cause a glutathione efflux from the cells even when they were irradiated with visible light for 20 min (Fig. 5).
Generation of hydroperoxides
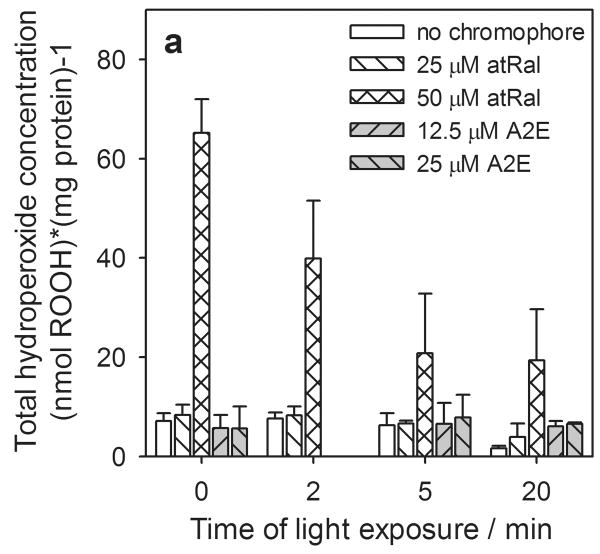
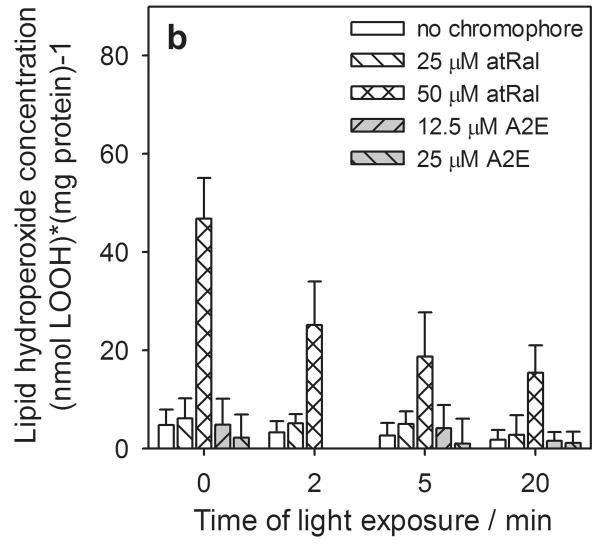
Under oxidative stress conditions, a significant amount of hydroperoxides can be produced in cells. We observed that similarly to extracellular glutathione, in hRPE cells incubated in the dark the total concentration of hydroperoxides and the amounts of lipid hydroperoxides rose dramatically (7- to 8-fold) in the presence of 50 μM all-trans-retinal (Fig. 6a). The cells exposed to light, both pretreated with 25 μM atRal and controls, showed a slight decrease in the hydroperoxide level with increasing irradiation time. A similar and much stronger effect was observed in cells preincubated in medium contained 50 μM all-trans-retinal. Nevertheless, total and lipid hydroperoxide concentration after 20 min light exposure was still several times higher than the control samples or cells containing a lower concentration of all-trans-retinal and illuminated for the same time periods.
Figure 6.
Hydroperoxide formation in human RPE cells pretreated with all-trans-retinal (atRal) or A2E and exposed to visible light. The cells were incubated in the dark in medium containing 25 and 50 μM atRal or 12.5 and 25 μM A2E for 5 hours. Then the medium was replaced with PBS and the cells were exposed to light (λ>400nm) for 5 and 20 min. After irradiation the cells were collected and frozen. Total hydroperoxide concentration (a) and the level of lipid hydroperoxides (b) in the cells were determined with the FOX assay and normalized to protein concentration in hRPE cells treated in the same way.
The amount of hydroperoxides formed during irradiation of hRPE cells with incorporated A2E was negligible compared to that induced by retinal, which was intercepted during cell incubation in medium containing a 50 μM solution of all-trans-retinal (Fig. 6a, b). However, concentration of hydroperoxides generated in A2E-laden cells, both irradiated and kept in the dark, was similar to that in the cells preincubated with 25 μM atRal.
Discussion
Dark cytotoxicity
All-trans-retinal is synthesized and accumulates in the photoreceptor outer segments and the RPE cells (3). It was shown that the concentration of all-trans-retinal released from mouse opsin in vivo (5) is much higher than the range of retinal concentrations used in this study. We have found that there was a significant decline of metabolic activity and a substantial increase of cytoplasmic membrane permeability in hRPE cells in the presence of all-trans-retinal. Similar cytotoxic effects of all-trans-retinal were observed when ARPE-19 cells were incubated in the dark with atRal in its free form and the cell metabolism monitored with the MTT assay (5, 23). Another study performed on isolated mitochondria determined that retinal as a product of β-carotene cleavage inhibited oxidative phosphorylation by 12% in isolated mitochondria at concentrations as low as 1 μM (36). Additionally, all-trans-retinal inhibited mitochondrial oxidation and uncoupled oxidative phosphorylation at concentrations >50 μM in mitochondria isolated from rat hearts, whereas A2E did not affect these metabolic functions even at a concentration of 600 μM (5).
All-trans-retinal in its free form has a high affinity to membranes, including cytoplasmic membranes, and may alter their stability (5). It can react via a Schiff base linkage with primary amines (23) present in membrane phospholipids and proteins. All-trans-retinal binding to those basic components of the cellular membrane can modify the structure of the membrane and make it more permeable. Simultaneously, the all-trans-retinal structure can undergo modification during incubation with hRPE cells, which manifests in a dramatic change in its absorption spectrum, particularly at low concentrations of the retinoid (Fig. 3). However, the cells show a limited potential for atRal modification, as more unchanged atRal remained at higher concentrations of the retinoid used for incubation with hRPE cells.
A2E also exhibits hydrophobic properties, but its structure does contain groups as reactive as those of all-trans-retinal. A2E also accumulates in membranes of human RPE cells cultured in vitro, but mostly in the lysosomes and to a lesser extent in mitochondrial membranes (37). The RPE cells cultured in vitro showed: inhibition of the ATP-driven proton pump of lysosomes when incubated with 2 μM A2E (38), perturbation of cholesterol metabolism when treated with 15 μM A2E (17), impairment of mitochondrial ATP synthesis and phagocytotic properties of the cells at 50 μM A2E (39) and inhibition of phagolysosomal degradation of photoreceptor phospholipids by RPE cells at 100 μM A2E (40).
At lower concentrations of A2E of up to 25 μM using the MTS and LDH assay, we did not observe either an effect of cellular dehydrogenase activity or an increase of the cytoplasmic membrane permeability in hRPE cells, both in the dark and exposed to visible light.
Phototoxicity
All-trans-retinal, in addition to its normal physiological function, is also an efficient photosensitizer (25, 26). A phototoxic effect of all-trans-retinal was also observed in previous studies when ARPE-19 cells were preincubated with a higher (0.1 mM) retinal concentration in phosphatidylcholine liposomes and exposed to visible light (41). At much lower concentrations of free all-trans-retinal, irradiation with blue light caused photodamage in the same type of RPE cells and also in HEK293 cells derived from human kidneys (5).
All-trans-retinal-mediated photodamage to lipids and proteins is oxygen-dependent (3, 42, 43). In vitro experiments showed that all-trans-retinal exposed to UV or visible light produced the retinoid free radicals in the presence of hydrogen atoms or electron donors (NADH), superoxide anions and singlet oxygen (20, 25, 26, 28, 44). The semioxidized retinoid can further interact with tyrosine and cysteine, leading to protein oxidation (44).
All-trans-retinal or other retinoid chromophores can play an important role in light-induced damage of photoreceptors and RPE cells (3). In vitro studies showed that all-trans-retinal exposed to visible light impairs the ABCR transporter present in photoreceptor outer segments (42). Other studies performed on rpe65 -/- mice indirectly proved that all-trans-retinal can induce light dependent degeneration in the retina. The absence of 11-cis-retinal and all-trans-retinal in the photoreceptors made the retina resistant to light toxicity (3).
Photochemical reactions of retinoids proceed through several possible routes - photoisomerization, photodegradation, photooxidation, and photopolymerization (20, 45). The absorption spectra of the extracts of hRPE cells incubated with atRal slightly decreased and the shape of their absorption spectra did not change significantly (Fig. 3). This result excludes a retinal photaggregation process in the cells. On the other hand, retinoids including all-trans-retinol and all-trans-retinal undergo isomerization into a mixture of trans- and cis- isomers (20). When retinoids are exposed to light they oxidize, giving products such as retinol, 5,6-epoxide- and 4-keto-retinol, and 5,6-endoperoxide (20). The all-trans-retinal absorption spectrum consists of a broad band in the range 280-480 nm with a maximal absorbance at 382 nm. However, continuous irradiation of atRal in argon-saturated methanol caused almost total bleaching of the chromophore and formation of 9,10-dihydroretinal, which has an absorption spectrum shifted to below 300 nm (25). It seems that bleaching of all-trans-retinal accompanied by the formation of less photoreactive products when irradiated with visible light is the main mechanism of its decreasing phototoxic effects in RPE cells.
Studies performed previously on the cytotoxic effect of all-trans-retinal on ARPE-19 cells showed that atRal toxicity was significantly inhibited when phosphatidylethanolamine (PE) was present in liposomes containing the chromophore (41). Moreover, the semioxidized atRal-PE adducts are less damaging to proteins than semioxidized atRal (44). During the processes leading to A2E formation, which take place in the photoreceptor outer segments, one atRal molecule reacts with PE and the atRal-PE adduct is produced. Then, another atRal molecule can bind to the adduct to form A2E-PE - a direct precursor of A2E. Thus, one effect of the formation of A2E and its precursor A2E-PE is to lower the photoreactivity of all-trans-retinal. Pawlak et al. (26) have determined with in vitro experiments that A2E is really much less photoreactive than its biosynthetic precursor. It was demonstrated that liposome samples containing atRal and irradiated with 407 nm light consumed 20.6 times more oxygen than did those containing A2E.
The oxygen uptake in all-trans-retinal samples was used mostly for 1O2 photogeneration, which was confirmed by formation of 5α-hydroperoxycholesterol, a specific indicator of Type-II photosensitized oxidation of cholesterol. Singlet oxygen was photogenerated in samples containing atRal at a rate ∼70 times faster than those with A2E, where only a vestigial concentration of the specific 1O2 derived oxidation product of cholesterol was detected. A2E is a relatively efficient quencher of singlet oxygen, with a constant quenching rate of 108 M-1·s-1. On the other hand, when A2E is exposed to light, it generates superoxide anion (46). EPR spin trapping showed that A2E irradiated with 407 nm light produced superoxide anion ∼4 times faster than all-trans-retinal. However, the quantum efficiency for O2•- generation by A2E determined in the study was very low (0.0003), and was more than 30 times lower than for riboflavin (26). Therefore, although irradiation of A2E also releases reactive oxygen species (ROS), the quantum yield is insufficient to account for the amount of ROS produced by lipofuscin.
Glutathione efflux
The RPE cells are permanently exposed to factors that potentially induce oxidative stress. Those conditions assure that RPE cells contain high amounts of superoxide dismutase and catalase (11). The presence of aldehyde dehydrogenase was affirmed in the RPE cells (47); this cytosolic enzyme participates in the oxidation of various aldehydes, including all-trans-retinal. Interestingly, it was shown that the expression of aldehyde dehydrogenase 6 (ALD6) was reduced in RPE cells isolated from older human eyes (48). The second line of defense against the negative effects of oxidative stress in the RPE cells is the presence of low-molecular-weight nonenzymatic antioxidants. Phototoxicity of all-trans-retinal toward RPE cells is significantly reduced by α-tocopherol and zeaxanthin (41).
The defense system in the RPE cells is supported by glutathione (11), particularly by its reduced form, which is the most abundant cellular nonprotein thiol (3). Synthesis and maintenance of GSH are important for appropriate protection against reactive electrophiles and oxidants (3). In this study the measurements of extracellular glutathione showed that the concentration of both its forms dramatically increased. The efflux of the thiol was caused by increased membrane permeability in cells preincubated with all-trans-retinal. Similar effects were observed in other studies, where β-carotene cleavage products containing retinal induced depletion of glutathione and protein-SH in isolated mitochondria (36). The level of GSH dramatically decreased in mitochondria in the presence of retinal and other cleavage products; however a parallel increase of GSSG content was observed.
Irradiation of RPE cells preincubated with all-trans-retinal had diverse effects on both intra- and extracellular GSH and GSSG concentrations depending on atRal concentration and time of light exposure. Cells partially impaired by the dark cytotoxic effect of all-trans-retinal were exposed to additional stress in the form of reactive intermediates of retinal and oxygen. The cells produced more GSH, which effluxed from them and was used to counteract the negative effects of oxidative stress. Prolonged irradiation induced bleaching, isomerization and autooxidation of the retinal, thus diminishing the effects of oxidative stress: cell metabolism and cytoplasmic membrane integrity recovered, and glutathione efflux from the cells decreased significantly.
The observed decrease of GSH content inside the cells treated with atRal was caused by greater efflux and oxidation, which was manifested by a dramatic increase in the extracellular GSSG level. Light exposure induced positive effects in the cells. The higher concentration of atRal in cell membranes caused reactive oxygen species photoproduced by retinal to react directly with its molecules, leading to their faster autooxidation. Modification of retinal structure allowed the cell to recover: cell metabolism, cytoplasmic membrane integrity, and intracellular GSH content increased significantly, while the levels of both glutathione forms fell dramatically during visible light exposure.
Hydroperoxide generation
The antioxidant defense in hRPE cells was ineffective when the cells were incubated in the dark with 50 μM all-trans-retinal. A dramatic increase of lipid hydroperoxides as well as those formed in the hydrophilic environment of the cytoplasm was observed. All-trans-retinal can react with primary amines (23), which then bind to proteins and deactivate enzymes including the antioxidant enzymes. All-trans-retinal can enhance superoxide formation, increase hydrogen peroxide levels and induce lipid peroxidation. The effect of all-trans-retinal on H2O2 formation in the dark was indirectly proved by noting the reduction of dark toxicity in the presence of catalase added to RPE cells preincubated with atRal (41). Additionally, the formation of malonic dialdehyde, a product of lipid peroxidation, was detected in mitochondria incubated with β-carotene cleavage products containing retinal (36).
The TBARS assay showed a direct effect of all-trans-retinal on lipid peroxidation in ARPE-19 cells (3). The same study also showed that the TBARS concentration rose during irradiation of cells, while here the lipid hydroperoxide level decreased with prolonged exposure to visible light. That apparent contradiction may be caused by the fact that the cells in the studies of Gao and Talalay (3) were irradiated with UVA, while we exposed them to visible light. When cells preloaded with atRal are irradiated with UVA, potential photosensitizing products of retinal photo-bleaching, -isomerization, and -oxidation that do not absorb visible light can produce further reactive oxygen species when they are exposed to UVA.
Hydroperoxides are the intermediate products of lipid peroxidation. Their reduced formation during visible light exposure shows that the rate of photoproduction of lipid peroxidation end products also decreases. The lessening rate of lipid hydroperoxide photogeneration in hRPE cells preincubated with 50 μM atRal was accompanied by their light-induced recovery. Increase in metabolic activity and formation of GSH, the reduced form of glutathione, facilitated lipid hydroperoxide scavenging by antioxidant enzymes.
Conclusion
These studies support our previous conclusions (14, 26) that although A2E may be harmful at high concentrations, especially when oxidized, its cytotoxic and phototoxic effects even at the highest physiological level (20-25 μM) are much lower compared to the free form of its precursor all-trans-retinal at the same concentration and entirely negligible compared to all-trans-retinal at twice the concentration. Thus the endogenous production of A2E, which is formed of two molecules of unbound all-trans-retinal, may serve as a protective mechanism to prevent damage to the retina by the free form of retinal.
Acknowledgments
This research was supported by the Intramural Research Program of the NIH, National Institute of Environmental Health Sciences. We thank Dr. Dan-Ning Hu for providing us with the human RPE cell line and Dr. Ann Motten for help in preparation of this manuscript.
Footnotes
This invited paper is part of the Symposium-in-Print: “Phototoxicity of the Skin and Eye”, in honor of Dr Colin Chignell.
References
- 1.McBee JK, Palczewski K, Baehr W, Pepperberg DR. Confronting complexicity: the interlink of phototransduction and retinoid metabolism in vertebrate retina. Prog Retin Eye Res. 2001;20:469–529. doi: 10.1016/s1350-9462(01)00002-7. [DOI] [PubMed] [Google Scholar]
- 2.Imanishi Y, Batten ML, Piston DW, Baehr W, Palczewski K. Noninvasive two-photon imaging reveals retinyl ester storage structures in the eye. J Cell Biol. 2004;164(3):373–383. doi: 10.1083/jcb.200311079. [DOI] [PMC free article] [PubMed] [Google Scholar]
- 3.Gao X, Talalay P. Induction of phase 2 genes by sulforaphane protects retinal pigment epithelial cells against photooxidative damage. Proc Natl Acad Sci U S A. 2004;101:10446–10451. doi: 10.1073/pnas.0403886101. [DOI] [PMC free article] [PubMed] [Google Scholar]
- 4.Travis GH, Golczak M, Moise AR, Palczewski K. Diseases caused by defects in the visual cycle: retinoids as potential therapeutic agents. Annu Rev Pharmacol Toxicol. 2007;47:469–512. doi: 10.1146/annurev.pharmtox.47.120505.105225. [DOI] [PMC free article] [PubMed] [Google Scholar]
- 5.Maeda A, Maeda T, Golczak M, Chou S, Desai A, Hoppel CL, Matsuyama S, Palczewski K. Involvement of all-trans-retinal in acute light-induced retinopathy of mice. J Biol Chem. 2009;284:15173–15183. doi: 10.1074/jbc.M900322200. [DOI] [PMC free article] [PubMed] [Google Scholar]
- 6.Lai YL, Tsin AT, Lam KW, Garcia JJ. Distribution of retinoids in different compartments of the posterior segment of the rabbit eye. Brain Res Bull. 1985;15(2):143–147. doi: 10.1016/0361-9230(85)90130-3. [DOI] [PubMed] [Google Scholar]
- 7.Maeda A, Maeda T, Golczak M, Palczewski K. Retinopathy in mice induced by disrupted all-trans-retinal clearance. J Biol Chem. 2008;283:26684–26693. doi: 10.1074/jbc.M804505200. [DOI] [PMC free article] [PubMed] [Google Scholar]
- 8.Sun H, Molday RS, Nathans J. Retinal stimulates ATP hydrolysis by purified and reconstituted ABCR, the photoreceptor-specific ATP-binding cassette transporter responsible for Stargardt disease. J Biol Chem. 1999;274:8269–8281. doi: 10.1074/jbc.274.12.8269. [DOI] [PubMed] [Google Scholar]
- 9.Sun H, Nathans J. Stargardt's ABCR is localized to the disc membrane of retinal rod outer segments. Nat Genet. 1997;17:15–16. doi: 10.1038/ng0997-15. [DOI] [PubMed] [Google Scholar]
- 10.Chrispell JD, Feathers KL, Kane MA, Kim CY, Brooks M, Khanna R, Kurth I, Hubner CA, Gal A, Mears AJ, Swaroop A, Napoli JL, Sparrow JR, Thompson DA. Rdh12 activity and effects on retinoid processing in the murine retina. J Biol Chem. 2009;284:21468–21477. doi: 10.1074/jbc.M109.020966. [DOI] [PMC free article] [PubMed] [Google Scholar]
- 11.Strauss O. The retinal pigment epithelium in visual function. Physiol Rev. 2005;85:845–881. doi: 10.1152/physrev.00021.2004. [DOI] [PubMed] [Google Scholar]
- 12.LaVail MM. Kinetics of rod outer segment renewal in the developing mouse retina. J Cell Biol. 1973;58:650–661. doi: 10.1083/jcb.58.3.650. [DOI] [PMC free article] [PubMed] [Google Scholar]
- 13.Sakai N, Decatur J, Nakanishi K, Eldred GE. Ocular age pigment “A2-E”: An unprecedented pyridinium bisretinoid. J Am Chem Soc. 1996;118:1559–1560. [Google Scholar]
- 14.Roberts JE, Kukiełczak BM, Hu DN, Miller DS, Bilski P, Sik RH, Motten AG, Chignell CF. The role of A2E in prevention or enhancement of light damage in human retinal pigment epithelial cells. Photochem Photobiol. 2002;75:184–190. doi: 10.1562/0031-8655(2002)075<0184:troaip>2.0.co;2. [DOI] [PubMed] [Google Scholar]
- 15.Kim SR, Jang YP, Jockusch S, Fishkin NE, Turro NJ, Sparrow JR. The all-trans-retinal dimer series of lipofuscin pigments in retinal pigment epithelial cells in a recessive Stargardt disease model. Proc Natl Acad Sci U S A. 2007;104:19273–19278. doi: 10.1073/pnas.0708714104. [DOI] [PMC free article] [PubMed] [Google Scholar]
- 16.Sparrow JR, Parish CA, Hashimoto M, Nakanishi K. A2E, a lipofuscin fluorophore, in human retinal pigmented epithelial cells in culture. Invest Ophthalmol Vis Sci. 1999;40:2988–2995. [PubMed] [Google Scholar]
- 17.Lakkaraju A, Finnemann SC, Rodriguez-Boulan E. The lipofuscin fluorophore A2E perturbs cholesterol metabolism in retinal pigment epithelial cells. Proc Natl Acad Sci U S A. 2007;104:11026–11031. doi: 10.1073/pnas.0702504104. [DOI] [PMC free article] [PubMed] [Google Scholar]
- 18.Friedman DS, O'Colmain BJ, Munoz B, Tomany SC, McCarty C, de Jong PT, Nemesure B, Mitchell P, Kempen J. Prevalence of age-related macular degeneration in the United States. Arch Ophthalmol. 2004;122:564–572. doi: 10.1001/archopht.122.4.564. [DOI] [PubMed] [Google Scholar]
- 19.Saari JC, Garwin GG, Van Hooser JP, Palczewski K. Reduction of all-trans-retinal limits regeneration of visual pigment in mice. Vision Res. 1998;38:1325–1333. doi: 10.1016/s0042-6989(97)00198-3. [DOI] [PubMed] [Google Scholar]
- 20.Tolleson WH, Cherng SH, Xia Q, Boudreau M, Yin JJ, Wamer WG, Howard PC, Yu H, Fu PP. Photodecomposition and phototoxicity of natural retinoids. Int J Environ Res Public Health. 2005;2:147–155. doi: 10.3390/ijerph2005010147. [DOI] [PMC free article] [PubMed] [Google Scholar]
- 21.Yang M, Fong HK. Synthesis of the all-trans-retinal chromophore of retinal G protein-coupled receptor opsin in cultured pigment epithelial cells. J Biol Chem. 2002;277:3318–3324. doi: 10.1074/jbc.M108946200. [DOI] [PubMed] [Google Scholar]
- 22.Boulton M, Dayhaw-Barker P. The role of the retinal pigment epithelium: topographical variation and ageing changes. Eye (London) 2001;15:384–389. doi: 10.1038/eye.2001.141. [DOI] [PubMed] [Google Scholar]
- 23.Sparrow JR, Wu Y, Kim CY, Zhou J. Phospholipid meets all-trans-retinal: the making of RPE bisretinoids. J Lipid Res. 2009 doi: 10.1194/jlr.R000687. [DOI] [PMC free article] [PubMed] [Google Scholar]
- 24.Boulton M, Różanowska M, Różanowski B, Wess T. The photoreactivity of ocular lipofuscin. Photochem Photobiol Sci. 2004;3:759–764. doi: 10.1039/b400108g. [DOI] [PubMed] [Google Scholar]
- 25.Harper WS, Gaillard ER. Studies of all-trans-retinal as a photooxidizing agent. Photochem Photobiol. 2001;73:71–76. doi: 10.1562/0031-8655(2001)073<0071:soatra>2.0.co;2. [DOI] [PubMed] [Google Scholar]
- 26.Pawlak A, Wrona M, Różanowska M, Zaręba M, Lamb LE, Roberts JE, Simon JD, Sarna T. Comparison of the aerobic photoreactivity of A2E with its precursor retinal. Photochem Photobiol. 2003;77:253–258. doi: 10.1562/0031-8655(2003)077<0253:cotapo>2.0.co;2. [DOI] [PubMed] [Google Scholar]
- 27.Parish CA, Hashimoto M, Nakanishi K, Dillon J, Sparrow J. Isolation and one-step preparation of A2E and iso-A2E, fluorophores from human retinal pigment epithelium. Proc Natl Acad Sci U S A. 1998;95:14609–14613. doi: 10.1073/pnas.95.25.14609. [DOI] [PMC free article] [PubMed] [Google Scholar]
- 28.Dillon J, Gaillard ER, Bilski P, Chignell CF, Reszka KJ. The photochemistry of the retinoids as studied by steady-state and pulsed methods. Photobiol Photochem. 1996;63(5):680–685. doi: 10.1111/j.1751-1097.1996.tb05673.x. [DOI] [PubMed] [Google Scholar]
- 29.Kanofsky JR, Sima PD, Richter C. Singlet oxygen generation from A2E. Photochem Photobiol. 2003;77:235–242. doi: 10.1562/0031-8655(2003)077<0235:sogfa>2.0.co;2. [DOI] [PubMed] [Google Scholar]
- 30.Hu DN, Del Monte MA, Liu S, Maumenee IH. Morphology, phagocytosis, and vitamin A metabolism of cultured human retinal pigment epithelium. Birth Defects Orig Artic Ser. 1982;18:67–79. [PubMed] [Google Scholar]
- 31.Hu DN, McCormick SA, Ritch R, Pelton-Henrion K. Studies of human uveal melanocytes in vitro: Isolation, purification and cultivation of human uveal melanocytes. Invest Ophthalmol Vis Sci. 1993;34:2210–2219. [PubMed] [Google Scholar]
- 32.Inbaraj JJ, Chignell CF. Cytotoxic action of juglone and plumbagin: A mechanistic study using HaCaT keratinocytes. Chem Res Toxicol. 2004;17:55–62. doi: 10.1021/tx034132s. [DOI] [PubMed] [Google Scholar]
- 33.Gay CA, Gebicki JM. Perchloric acid enhances sensitivity and reproducibility of the ferric-xylenol orange peroxide assay. Anal Biochem. 2002;304:42–46. doi: 10.1006/abio.2001.5566. [DOI] [PubMed] [Google Scholar]
- 34.DeLong JM, Prange RK, Hodges DM, Forney CF, Bishop MC, Quilliam M. Using a modified ferrous oxidation-xylenol orange (FOX) assay for detection of lipid hydroperoxides in plant tissue. J Agric Food Chem. 2002;50:248–254. doi: 10.1021/jf0106695. [DOI] [PubMed] [Google Scholar]
- 35.Södegren E, Nourooz-Zadeh J, Berglund L, Vessby B. Re-evaluation of the ferrous oxidation in xylenol assay for measurement of plasma lipid hydroperoxides. J Biochem Biophys Methods. 1998;37:137–146. doi: 10.1016/s0165-022x(98)00025-6. [DOI] [PubMed] [Google Scholar]
- 36.Siems W, Sommerburg O, Schild L, Augustin W, Langhans CD, Wiswedel I. Beta-carotene cleavage products induce oxidative stress in vitro by impairing mitochondrial respiration. FASEB J. 2002;16:1289–1291. doi: 10.1096/fj.01-0765fje. [DOI] [PubMed] [Google Scholar]
- 37.Schutt F, Bergmann M, Holz FG, Dithmar S, Volcker HE, Kopitz J. Accumulation of A2-E in mitochondrial membranes of cultured RPE cells. Graefes Arch Clin Exp Ophthalmol. 2007;245:391–398. doi: 10.1007/s00417-006-0376-5. [DOI] [PubMed] [Google Scholar]
- 38.Bergmann M, Schutt F, Holz FG, Kopitz J. Inhibition of the ATP-driven proton pump in RPE lysosomes by the major lipofuscin fluorophore A2-E may contribute to the pathogenesis of age-related macular degeneration. FASEB J. 2004;18:562–564. doi: 10.1096/fj.03-0289fje. [DOI] [PubMed] [Google Scholar]
- 39.Vives-Bauza C, Anand M, Shirazi AK, Magrane J, Gao J, Vollmer-Snarr HR, Manfredi G, Finnemann SC. The age lipid A2E and mitochondrial dysfunction synergistically impair phagocytosis by retinal pigment epithelial cells. J Biol Chem. 2008;283:24770–24780. doi: 10.1074/jbc.M800706200. [DOI] [PMC free article] [PubMed] [Google Scholar]
- 40.Finnemann SC, Leung LW, Rodriguez-Boulan E. The lipofuscin component A2E selectively inhibits phagolysosomal degradation of photoreceptor phospholipid by the retinal pigment epithelium. Proc Natl Acad Sci U S A. 2002;99:3842–3847. doi: 10.1073/pnas.052025899. [DOI] [PMC free article] [PubMed] [Google Scholar]
- 41.Różanowski B, Różanowska MB, Boulton ME. Toxicity of all-trans retinal to the retinal pigment epithelium. Invest Ophthalmol Vis Sci. 2003;44 E-Abstract 1643. [Google Scholar]
- 42.Ostrovskii MA, I, Fedorovich B. Retinal as a photo-damage sensitizer of retinal-containing retina proteins. Biofizika. 1994;39:13–25. [PubMed] [Google Scholar]
- 43.Sun H, Nathans J. ABCR, the ATP-binding cassette transporter responsible for Stargardt macular dystrophy, is an efficient target of all-trans-retinal-mediated photooxidative damage in vitro. Implications for retinal disease. J Biol Chem. 2001;276:11766–11774. doi: 10.1074/jbc.M010152200. [DOI] [PubMed] [Google Scholar]
- 44.Różanowska MB, Edge R, Land ET, Navaratnam S, Truscott TG, Różanowski B. Free radical interactions of retinal constituents - retinaldehyde and its adducts with phosphatidylethanolamine. Invest Ophthalmol Vis Sci. 2007;48 E-Abstract 3258. [Google Scholar]
- 45.Baron MH, Coulange MJ, Coupry C, Baron D, Favrot J, Abo Aly MM. All-trans retinal photoisomerization and photooxidation from UV laser rediation. Vibrational assignment of all-trans 5,8-peroxyretinal. Photochem Photobiol. 1989;49:739–751. [Google Scholar]
- 46.Broniec A, Pawlak A, Sarna T, Wielgus A, Roberts JE, Land EJ, Truscott TG, Edge R, Navaratnam S. Spectroscopic properties and reactivity of free radical forms of A2E. Free Radic Biol Med. 2005;38:1037–1046. doi: 10.1016/j.freeradbiomed.2004.12.023. [DOI] [PubMed] [Google Scholar]
- 47.Horton JD, Shah NA, Warrington JA, Anderson NN, Park SW, Brown MS, Goldstein JL. Combined analysis of oligonucleotide microarray data from transgenic and knockout mice identifies direct SREBP target genes. Proc Natl Acad Sci U S A. 2003;100:12027–12032. doi: 10.1073/pnas.1534923100. [DOI] [PMC free article] [PubMed] [Google Scholar]
- 48.Ishibashi K, Tian J, Handa JT. Similarity of mRNA phenotypes of morphologically normal macular and peripheral retinal pigment epithelial cells in older human eyes. Invest Ophthalmol Vis Sci. 2004;45:3291–3301. doi: 10.1167/iovs.04-0168. [DOI] [PubMed] [Google Scholar]
- 49.Różanowski B, Boulton ME, Pawlak A, Różanowska MB. Vitamin C increases light–Induced toxicity of all–trans–retinal to retinal pigment epithelial cells in vitro. Invest Ophthalmol Vis Sci. 2006;47 E-Abstract 2890. [Google Scholar]


