Abstract
Most current automated segmentation methods are performed on T1- or T2-weighted MR images, relying on relative image intensity that is dependent on other MR parameters and sensitive to B1 magnetic field inhomogeneity. Here, we propose an image segmentation method based on quantitative longitudinal magnetization relaxation time (T1) of brain tissues. Considering the partial volume effect, fractional volume maps of brain tissues (white matter, gray matter, and cerebrospinal fluid) were obtained by fitting the observed signal in an inversion recovery procedure to a linear combination of three exponential functions, which represents the relaxations of each of the tissue types. A Look-Locker acquisition was employed to accelerate the acquisition process. The feasibility and efficacy of this proposed method were evaluated using simulations and experiments. The potential applications of this method in the study of neurological disease as well as normal brain development and aging are discussed.
Keywords: magnetic resonance imaging, automated segmentation, brain tissue, partial volume effect, fractional volume, fast T1 mapping
Introduction
Automated segmentation of brain tissues in magnetic resonance (MR) images has been widely used in the study of brain structure and function (Ashburner and Friston, 2000; Ashburner and Friston, 2005; Thompson et al., 1997). Various segmentation algorithms have been proposed to make binary or non-binary (fractional volume or probability) maps for different brain tissue types, such as white matter (WM), gray matter (GM) and cerebrospinal fluid (CSF). Based on the imaging modalities/contrasts used, the unsupervised segmentation methods can be classified into single-contrast and multi-contrast approaches. For segmentation algorithms based solely on a single contrast, the spin-lattice relaxation time (T1) weighted image has been popularly used due to its capability of acquiring a high-resolution image within feasible time. Since the feasibility of multi-contrast MR imaging for brain segmentation was demonstrated using spin echo and inversion recovery sequences (Vannier et al., 1985), multi-spectral or multi-contrast segmentation methods have demonstrated the advantage of providing a variety of extra information for voxel classification. However, in practice the relatively long acquisition time and additional registration between multi-contrast images have made such methods less popular.
Due to the relatively small size of macroscopic brain structures (in particular cortical foldings) with respect to the conventional voxel size in MR images, the partial volume effect (PVE) has been a main concern for accurate segmentation, particularly for methods relying on a single image intensity/contrast. Non-binary tissue segmentation maps, such as fractional volume or probability of brain tissue components have been proposed to address the PVE. However, it is challenging to generate non-binary tissue maps using single-contrast based algorithms without a priori templates because signal intensity in a voxel contains different tissue types.
Various segmentation methods analyzing the intensity distribution of T1-weighted (T1w) images have been proposed to generate non-binary tissue maps using Gaussian mixture models (Santago and Gage, 1993; Shattuck et al., 2001) and Markov random field models based on Gaussian mixture models (Held et al., 1997; Rajapakse et al., 1997; Zhang et al., 2001). The theoretical description of the abovementioned methods and others have been reviewed in detail (Bezdek et al., 1993; Clarke et al., 1995; Cuadra et al., 2005). The intrinsic weakness of those techniques is their dependence on the T1w image contrast which is related not only to T1 but also to other MR variables such as proton density and spin-spin relaxation time (T2), and the T1w image contrast can be modulated by the transmit and receive radio-frequency (RF) fields, particularly when surface/phase-array coils are used.
Brain segmentation methods using quantitative or semi-quantitative MR parameters have been proposed. Diffusion tensor imaging for example, was utilized for brain segmentation, using the apparent diffusion coefficient and fractional anisotropy to classify the tissue types (Liu et al., 2007). A quantitative T1 map obtained with a fast whole-brain T1 mapping technique was used for brain segmentation (Hetherington et al., 1996). Recently, a high-resolution (1.25mm3) magnetization transfer (MT) contrast mapping technique with RF inhomogeneity and T1 relaxation corrections was developed (Helms et al., 2008) and employed to classify the subcortical GM, resulting in improved delineation of those brain areas (Helms et al., 2009).
In this study, we present an automated brain tissue segmentation method, FRActional Signal mapping from InvErsion Recovery (FRASIER), which classifies brain tissue based on quantitative T1. FRASIER observes the signal in a dynamic inversion recovery (IR) procedure and fits the data to a linear combination of three different exponential functions, which represent the relaxations of WM, GM and CSF, respectively. Non-binary fractional signal (fs) maps are obtained from the model fitting, and the fs maps are then converted into fractional volume (fv) maps based on the density of those brain tissues. Data collection with the FRASIER method is significantly accelerated using Look-Locker (LL) acquisition (Look and Locker, 1970). In this study, the performance of fv measurement using FRASIER is evaluated by simulations and in vivo experiments.
Materials and Methods
Automated Segmentation
A fast T1 measurement method using IR LL echo-planar imaging at a steady state (IR LL-EPI SS) has been recently proposed (Shin et al., 2009a). In the current study, IR LL-EPI SS method was employed for fast T1 and fv mapping to accelerate scan time. IR LL-EPI SS observes the apparent longitudinal magnetization relaxation (T1*) instead of T1 in an IR procedure. Under this condition T1* can be expressed as a function of T1, TR and flip angle, α (1/T1*=1/T1−ln(cosα)/TR), and the relaxation of longitudinal magnetization during the IR procedure can be described as MSS|1−2exp(−t/T1*)|, where MSS is the longitudinal magnetization at a steady state.
The observed signal in a voxel during a conventional IR procedure was modeled as a linear combination of three mono-exponential functions, which represent relaxations of WM, GM, and CSF, respectively, with limited interactions between them. The signal amplitude in each voxel was normalized to the level at its steady state. Tissue segmentation was derived from fractional signals of these tissues obtained from the three-compartment model as:
| [1] |
Subscript i in the above equation represents the tissue types (WM, GM and CSF). Fractional signal, fs can be converted into fractional volume fv when the water density for each tissue type is known. Here, water densities of 0.73, 0.89, and 1.00 for WM, GM, and CSF, respectively, were used (Donahue et al., 2006), and the fractional volumes were constrained by fv,GM + fv,wm+ fv,CSF = 1. For the IR LL procedure described above, equation [1] can be modified as (Shin et al, 2009a):
| [2] |
| [3] |
Considering discrete signals S̅obs = [S(t1) … S(tN)]T observed during the LL acquisition, continuous equation [2] and equation [3] can be written in discrete matrix forms with a noise column vector ē added:
| [4] |
| [5] |
| [6] |
| [7] |
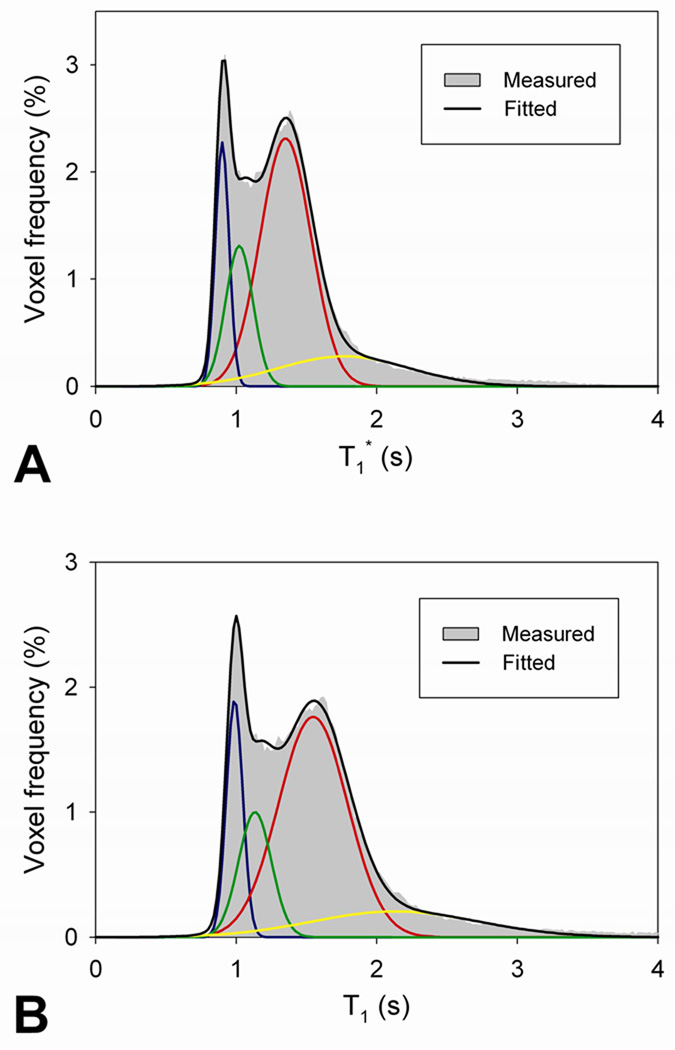
From [equations 4–7], each fs can be calculated from (X̅TX̅)−1X̅TS̅obs, based on a linear least squares estimation approach. Note that Si (tj) is a mono-exponential function with the effective relaxation time constant T1,i* and MSS,i is a function of T1,i. Therefore, T1* and T1 values in WM, GM, and CSF need to be determined prior to calculating fv. To account for individual variations in T1* and T1, those values for WM and GM were obtained individually for each subject by fitting whole brain T1* and T1 histograms (see Fig. 1). Average T1* and T1 values of WM and GM are determined as the mean values of the two highest Gaussian distributions. Note that the width or the standard deviation (SD) of the fitted T1 Gaussian distributions in WM and GM is not used in our analysis, which is usually used to determine the probability function of each tissue from the signal intensity histogram based on a Gaussian mixture model (Ruan et al., 2000; Santago and Gage, 1993). Since the volume of CSF is relatively small compared with WM and GM, T1 of CSF was not measured from the distribution, but was set to 4300 ms (Hopkins et al., 1986) and T1* of CSF was calculated using the equation, 1/T1*=1/T1−ln(cosα)/TR.
Fig. 1.
The representative T1* and T1 distributions in the whole brain. Voxel frequencies of T1* (A) and T1 (B) are distributed with a time interval of 20 ms, shown as gray shading. Four Gaussian functions are fitted to the distribution, representing WM (blue), GM (red), WM+GM (green), and GM+CSF (yellow). Black line indicates summation of the four Gaussian fitted curves.
Note that FRASIER has no presumption of brain tissue mixture, as most of the unsupervised PVE segmentation methods barely consider the mixture of WM and CSF or WM, GM, and CSF (Grabowski et al., 2000; Laidlaw et al., 1998; Lemieux et al., 2003; Ruan et al., 2000; Shattuck et al., 2001).
Simulations
The accuracy and precision of the proposed fv measurement technique were demonstrated using Monte-Carlo computer simulations (n=104). Three different fv values were chosen from pseudo-random distribution between 0 and 1, and normalized by their sum. The signal recovery in the LL acquisition was simulated based on the randomly chosen mixture model with the identical imaging parameters used in the in vivo MR experiment (see below). For simplicity, the water density and steady-state signal of each tissue were set to one in the simulations. Different noise levels were added to the simulated data. Signal-to-noise ratio (SNR) was calculated from the simulated signal intensity at a steady state divided by the SD of the added noise.
The accuracy and precision of fv in each tissue type i were determined by the mean and SD of the difference between the calculated fv (cfv) and the simulated fv over n (=104) repetitions at each SNR level: Accuracy
| [8] |
| [9] |
To demonstrate the accuracy and precision of the fv measurement in empirical settings, the modified ICBM Probabilistic Tissue Atlas (http://www.loni.ucla.edu/Atlases/) built in SPM5 was used as a brain template. The signal recovery in the LL acquisition was simulated on each voxel within the brain and normally distributed noise was added at an SNR of 70, which was similar to the measured SNR in the IR LL-EPI SS image of GM at a steady state. Fractional volume maps of WM, GM and CSF were calculated on the simulated data in a representative single slice.
MR Imaging Experiments
Eleven healthy subjects (8 females, ages = 27 ± 6 years) were scanned using the segmented IR LL-EPI SS sequence on a Siemens 3T Allegra scanner (Siemens Medical Solutions, Erlangen, Germany). Written informed consent was obtained from participants prior to the experiments in accordance with the protocol approved by the Institutional Review Board of the National Institute on Drug Abuse. Thirty-five 4-mm thick slices without interslice gap parallel to the anterior commissure – posterior commissure (AC-PC) were prescribed to cover the whole brain, acquired in an interleave fashion. The following MR imaging protocols were used: FOV = 220 mm2, non-selective IR, TR/TE = 400/5.3 ms, α = 16°, matrix = 128×128, bandwidth = 1056Hz/voxel, 5 lines acquisition in k-space per excitation, time of duration (TD) per IR = 10 s, providing 25 time points during the IR and total scanning time = 4 min 32 s. The voxel dimensions were 1.7×1.7×4.0 mm3. For fat saturation, “1-2-1” binominal water-only excitation pulses were used to minimize the unwanted magnetization transfer effects, which are unavoidable when using frequency-selective fat saturation pulses (Shin et al., 2009b). Additionally, two of the participants were scanned using segmented EPI sequences with and without magnetization transfer (MT) preparation pulses following the segmented IR LL-EPI SS scanning. Isotropic (1mm3) T1w images (MPRAGE) were acquired at the end of the experiment for detailed anatomical information.
Evaluation of Fractional Volumes in Subcortical Regions
To evaluate the fractional volumes in subcortical regions, masks for putamen, caudate and thalamus were generated from the 0.5-probability threshold Harvard-Oxford subcortical structural atlas that defines brain regions based on standard anatomical boundaries (Kennedy et al., 1998; Makris et al., 1999). The fractional volume maps of each subject were first linearly coregistered into each set of high resolution T1w MPRAGE images. Then, the fractional volume maps were coregistered to the Montreal Neurological Institute (MNI) space, using the transformation matrix from each subject’s T1w MPRAGE images to the MNI space. Finally, the masks for putamen, caudate and thalamus were coregistered with each subject’s fractional volume maps, using the inverse of transformation matrix from each subject’s fractional volume maps to MNI space.
Validation using down-sampled fractional volume mapping
FRASIER assumes that the observed signal in a voxel during an IR procedure was modeled as a linear combination of three mono-exponential functions, representing relaxations of WM GM and CSF, respectively. We validated the FRASIER method indirectly by comparing fractional volumes calculated before and after image down-sampling. First we down-sampled the two dimensional IR LL-EPI SS images from 128×128 into 64×64 and calculated fv maps in the down-sampled voxels. Second, fv maps obtained from the original IR LL-EPI SS images (128 ×128) were down-sampled into 64×64 matrix size by averaging adjunct 2×2 voxels. A comparison of these fv maps would examine the accuracy of fractional volume measurement using FRASIER in the presence of different degrees of PVE
Reproducibility of FRASIER in two successive scans
Additionally, two healthy subjects were scanned twice using the IR-LLEPI SS sequence to evaluate the reproducibility of FRASIER. A voxel-wise SD map of fv,GM and a voxel-wise normalized SD map of T1 were calculated. To evaluate the reliability of FRASIER, f v,GM were measured in subcortical regions defined as described in the Evaluation of Fractional Volumes in Subcortical Regions section, and compared between the two scans.
Results
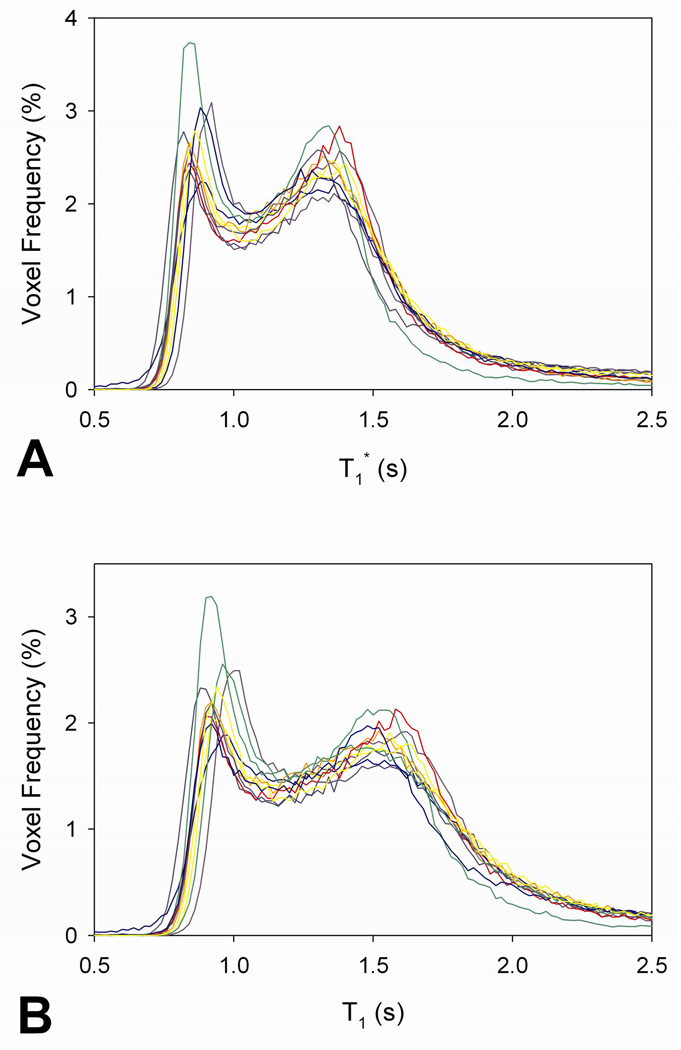
Figure 1 shows the representative whole-brain T1* and T1 histograms and individual measurements of T1* and T1 in WM and GM. The two lowest Gaussian distributions in the histograms were likely derived from voxels with partial volume between WM and GM (green) and between GM and CSF (yellow). Individual whole-brain T1* and T1 histograms over the 11 subjects are shown in Fig. 2. From the individual T1 histograms, average T1 values in WM and GM were measured to be 925 ± 28 ms and 1531 ± 43 ms, respectively, a finding that is in good agreement with previous reports (Ethofer et al., 2003; Oros-Peusquens et al., 2008).
Fig. 2.
The T1* and T1 distributions in the whole brain over the 11 subjects. Using Gaussian fitting shown in Fig. 2, average T1 values in WM and GM are 925 ± 28 ms and 1531 ± 43 ms, respectively.
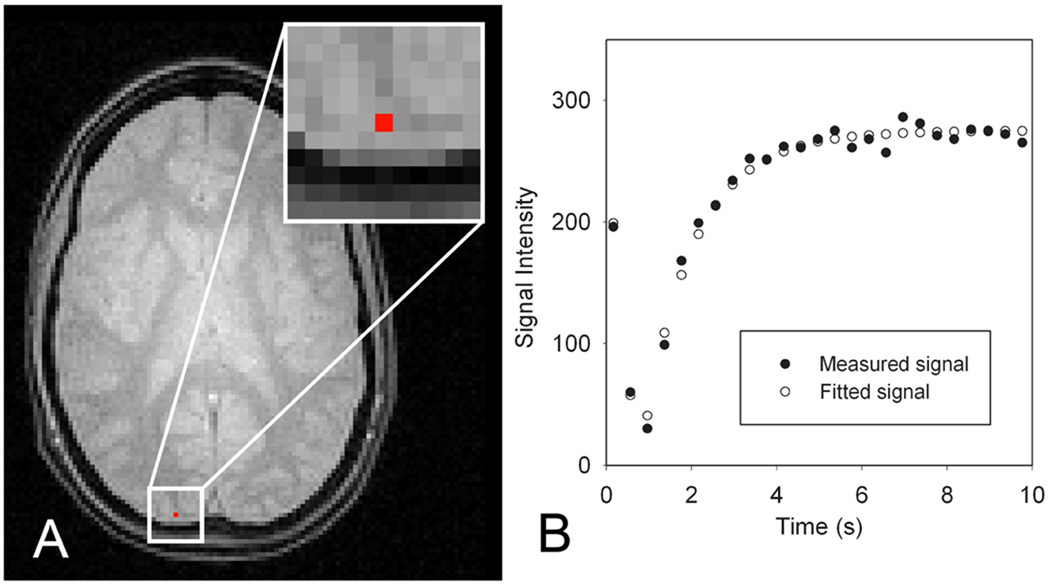
Figure 3 demonstrates the fitting accuracy of FRASIER in a representative voxel under the current MR imaging protocol. Fractional volume in a representative voxel (1.7×1.7×4.0 mm3), shown as a red square dot in Fig. 3A, was measured as 0.37 for WM and 0.63 for GM, respectively, and r2 was calculated as 0.9889.
Fig. 3.
An illustration of a fitting result using FRASIER. Figure 3A is an LL-EPI image at steady state (the 25th time point). Figure 3B demonstrates the measured signals (black dots) from a red colored voxel in Fig 3A and the fitted curve (white dots). From the chosen voxel, fractional volumes of WM and GM were measured as 0.37 and 0.63, respectively, and r2 was calculated as 0.9889.
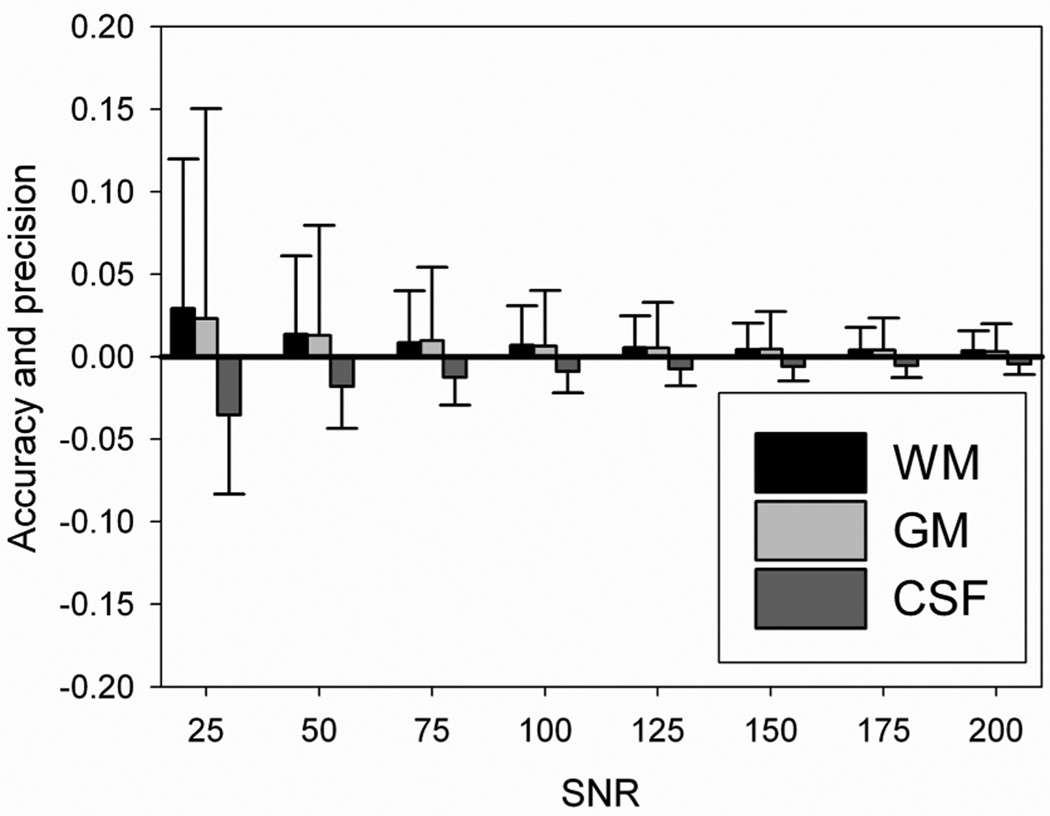
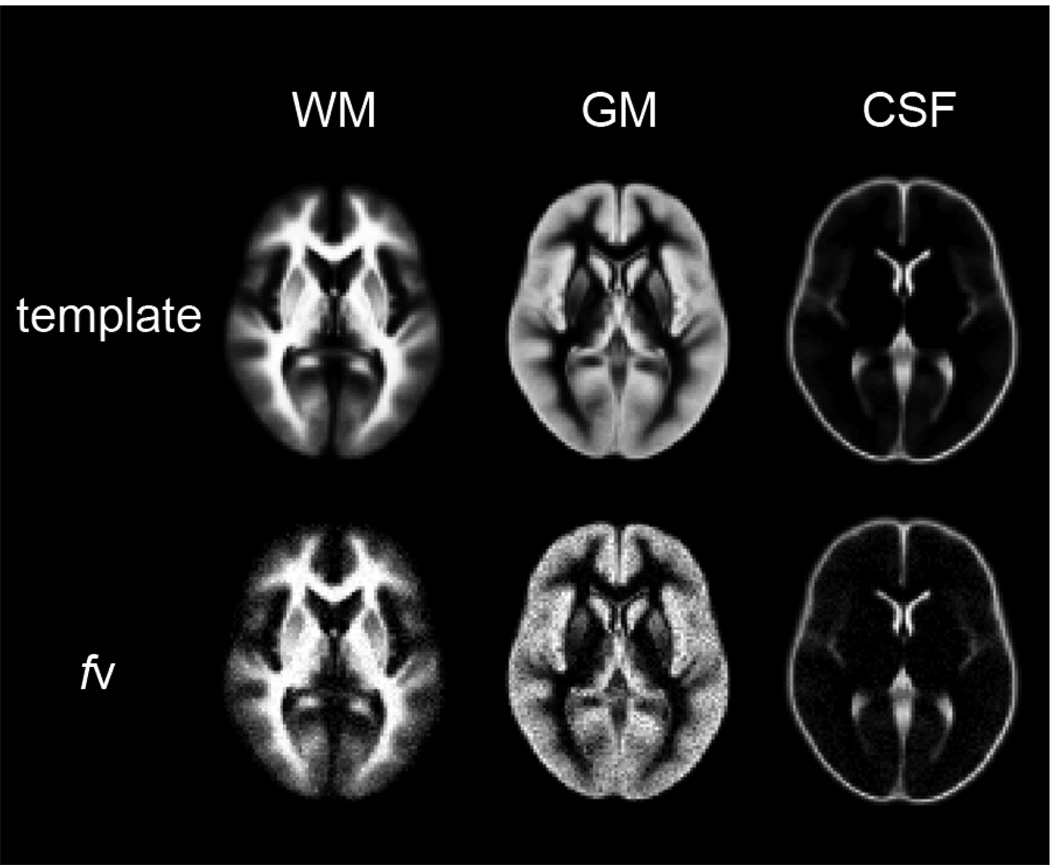
A simulation was performed using the measured average T1* and T1 values (T1* = 849 and 1339 ms in WM and GM, respectively. The accuracy and the precision of the FRASIER method are shown in Fig. 4. Note that SNR in the IR LL-EPI SS was empirically measured to be approximately 70, and therefore the accuracy and the precision of the FRASIER method from the experimental data were expected to be 0.8±3.2%, 0.9±4.5%, −1.3±1.7% in WM, GM, and CSF, respectively. More realistic fv maps are shown in Fig. 5 in comparison with the original template.
Fig. 4.
The accuracy and precision of the fractional volume (fv) measurements. The accuracy (bar) and the precision (error bar) of fv measurement in WM, GW and CSF are calculated in the simulation, as a function of signal-to-noise (SNR).
Fig. 5.
The fractional volume maps from simulated data based on a brain template with added noise (SNR=70).
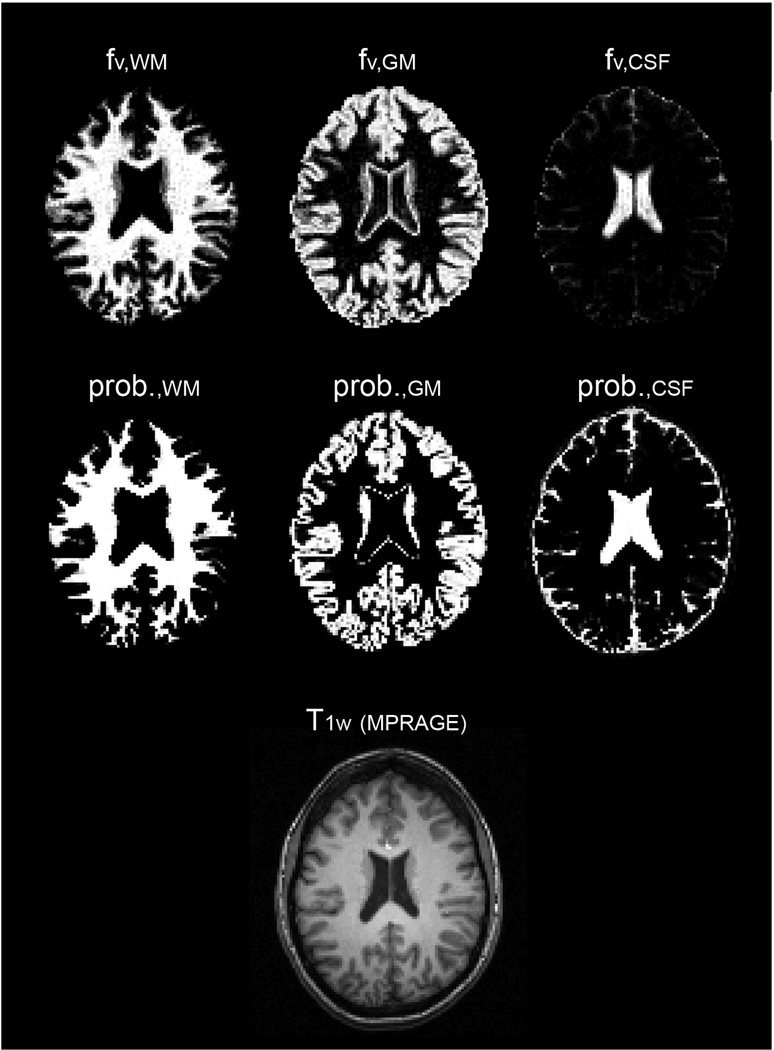
Figure 6 shows nine slices (out of 35) from T1 and fv maps from a representative subject using the FRASIER method. Distribution of WM, GM and CSF in the brain correspond well with the known brain structures. Figure 7 demonstrates the fv maps from FRASIER and the probability maps from SPM of the 6th slice in Fig. 6. Both fv and probability maps classify the periventricular voxels as a considerable volume fraction of GM. Two distinguishable points of the difference between the fv and probability maps are observed. First, FRASIER depicts septum pellucidum (the boundary between the left and right lateral ventricles) as GM, but SPM does not. Second, caudate nucleus was classified as pure GM in the probability maps, but fv maps determined that caudate nucleus was a mixture of WM and GM.
Fig. 6.
Representative T1 and fractional volume (fv) maps from a single healthy subject. Nine out of thirty-five slices of T1 and fv maps of WM, GM and CSF are shown, scaled from 0 (black) to 3.5 s (white) for T1 maps and 0 to 1 for fv maps.
Fig. 7.
The comparison of fv maps using FRASIER (top row) and probability maps using SPM (middle row). Images were selected in the identical slice location from the 6th slice in Fig. 6. A high-resolution (1mm3) T1 weighted image corresponding the slice location is shown as a reference (bottom).
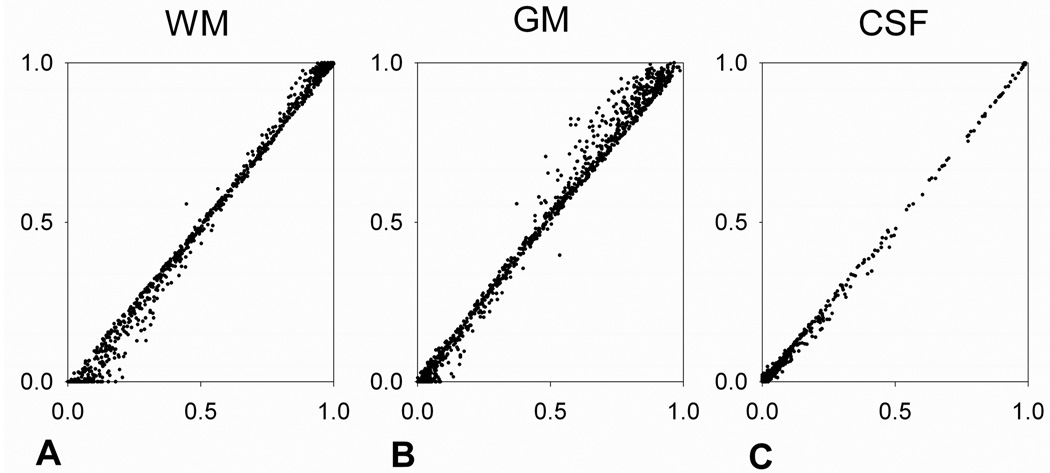
Figure 8 demonstrates a voxel-wise comparison of fractional volumes before and after the down-sampling in WM, GM and CSF of the 6th slice in Fig. 6. The degree of correlation (r2) between the fractional volumes before and after the down-sampling in the representative single slice was 0.9875, 0.9859 and 0.9935 in WM, GM and CSF, respectively. This result is consistent in the whole brain of this single subject (r2=0.9786, 0.9710 and 0.9872 in WM, GM and CSF, respectively) and over 11 subjects (r2=0.9844±0.0097, 0.9780±0.016 and 0.9906±0.0049 in WM, GM and CSF, respectively).
Fig. 8.
Comparison of fractional volumes before (y axes) and after (x axes) the down-sampling of the 6th slice in Fig. 6. Voxel-wise fractional volumes of WM, GM and CSF in the single slice are compared and demonstrated in Fig. 8A, B and C, respectively.
Figure 9 demonstrates the partial volume of WM and GM in a subcortical region including basal ganglia and thalamus from one subject. Enlarged T1w and MTR images show that the signal intensities in the putamen, caudate nucleus, and thalamus are between “typical” WM and GM, suggesting partial WM/GM compositions in these areas, shown in Fig. 7. From the 11 subjects, the apparent T1 was measured as 1238±26 ms in the putamen, 1334±76 ms in the caudate nucleus and 1145±57 ms in the thalamus, while T1 was 1542 ms in cortical GM. The fv maps provide quantitative measures of the WM/GM fractions. From the 11 subjects, GM fv was 0.52±0.05 in the putamen, 0.66±0.06 in caudate nucleus, and 0.41±0.08 in the thalamus, in accord with previous studies (Tamagaki et al., 2005).
Fig. 9.
Representative T1-weighted (T1w) and magnetization transfer ratio (MTR) images, as well as the corresponding fractional volume (fv) maps. The enlarged T1w image (B) and MTR image (C) are from the slice (A) containing the basal ganglia and thalamus. The corresponding fv maps are presented at the bottom (D: WM, E: GM, and F: CSF). Putamen (p), thalamus (th), and caudate nucleus (cn) are labeled on the T1w images (B).
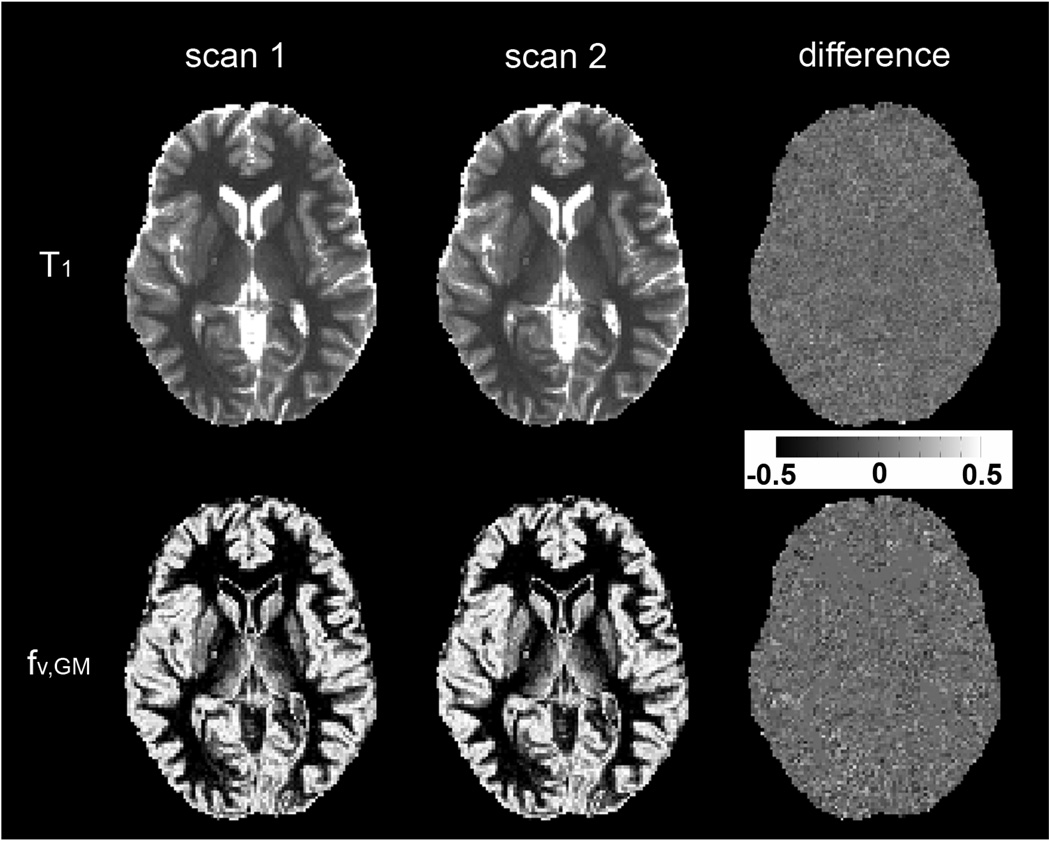
Figure 10 shows representative single slice (out of 35) of T1 and fv,GM maps from the two successive scans using the IR LL-EPI SS sequence and FRASIER analysis. In the whole brain of the two subjects, average normalized voxel-wise SDs of T1 were 6.4 % and 7.2 %, respectively, and average voxel-wise SDs of fv,GM were 8.1 % and 9.4%, respectively. Table 1 shows the measured T1 and fv,GM values in sub-cortical ROIs from the two scans.
Fig. 10.
Representative T1 and fv,GM maps from two successive scans, and difference maps between the two scans. T1 maps were scaled from 0 to 3.5 s, and fv,GM maps from 0 to 1. For the convenience of display, the difference map of T1 was calculated after normalization (2×(T1scan1 − T1scan2) / (T1scan1 + T1scan2)), and the difference map of fv,GM maps was calculated without normalization (fv,GMscan1 − fv,GMscan2). Both difference maps were scaled from −0.5 to 0.5, as indicated in gray scale bar.
Tab. 1.
T1 and fv,GM in putamen (PT), caudate nucleus (CN) and thalamus (TH) from the scan and re-scan.
| subject 1 | subject 2 | ||||||
|---|---|---|---|---|---|---|---|
| PT | CN | TH | PT | CN | TH | ||
| T1 (ms) | scan1 | 1193±107 | 1233±136 | 1118±121 | 1311±111 | 1401±85 | 1196± 136 |
| scan2 | 1198±112 | 1225±143 | 1118±121 | 1320±103 | 1401±80 | 1203±138 | |
| fv,GM (%) | scan1 | 51±19 | 62±24 | 33±22 | 63±17 | 75±12 | 42±22 |
| scan2 | 52±20 | 62±25 | 33±22 | 65±16 | 76±12 | 43±22 | |
Discussion
The PVE is one of the main difficulties related to brain tissue segmentation of MR images. High-resolution MR imaging, such as 1mm3 isotropic T1w imaging, has been widely used to minimize PVE in segmentation. In this study, we propose a new fv measurement technique by investigating the multi-exponential patterns of the longitudinal magnetization relaxation. FRASIER utilizes the well-understood T1 relaxation in an IR procedure to segment brain tissues. However, the current FRASIER protocol provides a spatial resolution of 1.7×1.7×4.0 mm3, due to the acquisition of multiple time points in the IR procedure. To overcome this limited spatial resolution in FRASIER, the current method targets the accurate fractional volume measurement of relatively large voxels as a solution to the PVE, instead of pursuing a high-resolution approach to minimize PVE. As such, high accuracy and precision of fv measurements are essential for the FRASIER method. The simulation results (Fig. 4) indicate that higher SNR provides an improved fv measurement. Therefore, further increase of SNR with improved RF coils and optimized imaging parameters would be desirable for FRASIER. The use of multi-channel RF coils significantly improves SNR while the uniformity of the RF field is usually degraded. Since the fv measurement is not sensitive to both transmit and receive RF field non-uniformity, FRASIER would particularly benefit from multi-channel RF coils. Similarly, FRASIER would also be useful at high field strengths, where SNR is high but RF homogeneity could be poor due to dielectric effects.
The classification of WM and GM is conventionally based on appearance. GM consists of a preponderance of neural cell bodies and dendrites, appearing pinkish-gray after a fresh cut. WM consists mainly of axons, surrounded by a myelin sheath, and appears pinkish-white. The classification of brain tissue as WM or GM is not absolute, particularly in the subcortical regions. For example, the basal ganglia, including putamen, caudate nucleus, and globus pallidus is predominantly composed of GM. However, the basal ganglia connects to various other brain regions through fiber projections, and therefore contains significant myelinated axons. The FRASIER method calculates the fractional volume of the brain tissues in a voxel based on the T1’s of WM, GM, and CSF, among which the T1’s of WM and GM are determined from the peak values of the two highest Gaussian distributions of the individual whole-brain T1 histogram (Fig. 1). It is therefore important that those T1s obtained from the histogram represent typical WM and GM in the current study. In other words, we have assumed that there exist representative T1 values of WM and GM in our segmentation method. This assumption has also been used for unsupervised tissue segmentation methods to account for the partial volume effects. In fact, many unsupervised segmentation methods using signal intensity histograms in the brain have the same presumption of representative or average signal contrasts of brain tissue types in T1w images (Grabowski et al., 2000; Laidlaw et al., 1998; Lemieux et al., 2003; Ruan et al., 2000; Santago and Gage, 1993; Shattuck et al., 2001). Previous studies considered the intrinsic variation of T1 or T1w in a brain tissue by setting low and high thresholds of the contrast for a typical brain tissue type, in which a voxel is determined as a single component, and out of which a voxel is determined as a mixture of two components by fuzzy classifiers (Herndon et al., 1996; Herndon et al., 1998). However, these thresholds need to be pre-determined by the supervision of experts. For our data, the voxels fitted to in the GM Gaussian function in Fig. 1 are distributed primarily in the cortical GM, whereas the voxels in the WM Gaussian function are distributed mainly in the regions with thick WM bundles. Therefore, the subcortical GM regions, which have lower T1 than the cortical GM, were determined to be a mixture of WM and GM in the FRASIER method. It should be noted that the FRASIER method does not account for extenuating factors, such as excessive iron deposition, which reduces the T1 of these regions. To assess the potential influence on the accuracy of the fractional volume measurement due to the assumption of a single representative T1 for each tissue, a simulation analysis was performed. Assuming there was a 10% variation in the representative T1 of GM with T1’s of WM and CSF fixed, the error in the fractional volume estimation for pure GM was approximately 6.5%.
The proposed FRASIER method accelerated by LL acquisition needs pre-determination of T1* for each tissue (see the equation [6]). There are two approaches to determine T1* values of WM and GM. One is to calculate T1* from T1 using 1/T1* =1/T1+ln(cos(α))/TR, and therefore the T1’s of WM and GM need to be determined first. The other approach, used in the current study, is to measure T1* directly from the whole brain histogram. This approach is expected to minimize T1* or T1 variations of WM and GM over subjects. Furthermore, the current MR protocol used for FRASIER was optimized to minimize the bias on the determination of T1* due to local flip angle inhomogeneity (Shin et al., 2009a). For those reasons, we demonstrated the FRASIER technique by measuring individual T1* of WM and GM from the whole brain histogram. However, alternative strategies might be used for patient populations. For subjects with neurological disorders, it would be recommended to determine T1’s of WM and GM from a healthy control group or from the patients’ individual brains excluding the lesions. To assess the possible bias of volume fractions introduced by inter-subject T1 variations, we simulated the MR signal in an IR procedure in pure GM with T1 varying from 1447 to 1615 ms, representing 1.96 times of the measured SD of the T1 in GM (Mean = 1531 ms and SD = 85.7 ms across the 11 subjects). Assuming that individual T1’s of GM follow a Gaussian distribution, 95% of the subjects would have T1’s in this range. When the mean T1 (1513 ms) was used as the typical GM T1 in the FRASIER modeling, fractional volume of pure GM was estimated to be approximately 92.7% in the T1 range of 1447 and 1615ms (a 7.3% error). This simulation suggests that using an average T1 from a group (instead of individual T1’s) in FRASIER results in an acceptable estimation of the fraction volumes.
The measured voxel-wise SD of fv,GM in the whole brain was 8.8% from the two subjects, while it was estimated to be 4.5% from the simulation. This discrepancy might be explained by head motion and physiological factors between and/or during the two scans (total 9 mins). Note that this SD or precision was demonstrated in a voxel-wise fashion without any spatial smoothing and normalization, which is commonly employed in pre- and/or post-image processing in most segmentation procedures. When the reproducibility was tested from the measured fv,GM in the sub-cortical GM area, the average standard error of the mean was 0.5% over 3 regions and 2 subjects (see Tab. 1.).
The measurement of volume changes in specific brain regions has been widely implemented to investigate the degeneration of brain tissues related to Alzheimer’s disease (de Jong et al., 2008), multiple sclerosis (Ge et al., 2007), and aging (Greenberg et al., 2008). These volume changes might accompany alterations in tissue composition, which should be directly characterized by the proposed FRASIER technique. Traditional automated segmentation methods relying on an atlas composed from healthy subjects might present difficulties in the accurate analysis of data taken from a population of patients possessing substantial anatomical variations caused by neurological disorders. In such cases, FRASIER could be a valuable tool for quantifying T1 and fv changes in specific brain regions. Similarly, FRASIER might be more suitable for age-dependent studies such as neuronal development in children and aging in seniors, because no age-specific atlas would be needed.
Conclusion
We have developed a new segmentation approach, FRASIER, which uses quantitative T1s (or T1*s) in brain tissues to obtain fractional signal mapping. The FRASIER method can be applied to any IR procedure, and can be accelerated using LL acquisition. In the present study, the FRASIER method provided whole brain T1 and fv maps within 4.5 min. Experimental data demonstrated that the GM, WM, and CSF of the brain were effectively segmented using FRASIER. This segmentation method would provide an improved ability to study patient populations with severe brain deformations and healthy subjects during development and aging.
Acknowledgements
This work was supported by the Intramural Research Program of the National Institute on Drug Abuse (NIDA), National Institutes of Health. The authors would like to thank Dr. Thomas Ross and Dr. Annabelle Belcher of the NIDA for his helpful discussions and suggestions, and Dr. Leon Axel for suggesting the validation of FRASIER using the down-sampling approach.
Footnotes
Publisher's Disclaimer: This is a PDF file of an unedited manuscript that has been accepted for publication. As a service to our customers we are providing this early version of the manuscript. The manuscript will undergo copyediting, typesetting, and review of the resulting proof before it is published in its final citable form. Please note that during the production process errors may be discovered which could affect the content, and all legal disclaimers that apply to the journal pertain.
Reference List
- Ashburner J, Friston KJ. Voxel-based morphometry--the methods. Neuroimage. 2000;11:805–821. doi: 10.1006/nimg.2000.0582. [DOI] [PubMed] [Google Scholar]
- Ashburner J, Friston KJ. Unified segmentation. Neuroimage. 2005;26:839–851. doi: 10.1016/j.neuroimage.2005.02.018. [DOI] [PubMed] [Google Scholar]
- Bezdek JC, Hall LO, Clarke LP. Review of MR image segmentation techniques using pattern recognition. Med.Phys. 1993;20:1033–1048. doi: 10.1118/1.597000. [DOI] [PubMed] [Google Scholar]
- Clarke LP, Velthuizen RP, Camacho MA, Heine JJ, Vaidyanathan M, Hall LO, Thatcher RW, Silbiger ML. MRI segmentation: methods and applications. Magn Reson.Imaging. 1995;13:343–368. doi: 10.1016/0730-725x(94)00124-l. [DOI] [PubMed] [Google Scholar]
- Cuadra MB, Cammoun L, Butz T, Cuisenaire O, Thiran JP. Comparison and validation of tissue modelization and statistical classification methods in T1-weighted MR brain images. IEEE Trans.Med.Imaging. 2005;24:1548–1565. doi: 10.1109/TMI.2005.857652. [DOI] [PubMed] [Google Scholar]
- de Jong LW, van der HK, Veer IM, Houwing JJ, Westendorp RG, Bollen EL, de Bruin PW, Middelkoop HA, van Buchem MA, van der GJ. Strongly reduced volumes of putamen and thalamus in Alzheimer's disease: an MRI study. Brain. 2008;131:3277–3285. doi: 10.1093/brain/awn278. [DOI] [PMC free article] [PubMed] [Google Scholar]
- Donahue MJ, Lu H, Jones CK, Edden RA, Pekar JJ, van Zijl PC. Theoretical and experimental investigation of the VASO contrast mechanism. Magn Reson.Med. 2006;56:1261–1273. doi: 10.1002/mrm.21072. [DOI] [PubMed] [Google Scholar]
- Ethofer T, Mader I, Seeger U, Helms G, Erb M, Grodd W, Ludolph A, Klose U. Comparison of longitudinal metabolite relaxation times in different regions of the human brain at 1.5 and 3 Tesla. Magn Reson.Med. 2003;50:1296–1301. doi: 10.1002/mrm.10640. [DOI] [PubMed] [Google Scholar]
- Ge Y, Jensen JH, Lu H, Helpern JA, Miles L, Inglese M, Babb JS, Herbert J, Grossman RI. Quantitative assessment of iron accumulation in the deep gray matter of multiple sclerosis by magnetic field correlation imaging. AJNR Am.J Neuroradiol. 2007;28:1639–1644. doi: 10.3174/ajnr.A0646. [DOI] [PMC free article] [PubMed] [Google Scholar]
- Grabowski TJ, Frank RJ, Szumski NR, Brown CK, Damasio H. Validation of partial tissue segmentation of single-channel magnetic resonance images of the brain. Neuroimage. 2000;12:640–656. doi: 10.1006/nimg.2000.0649. [DOI] [PubMed] [Google Scholar]
- Greenberg DL, Messer DF, Payne ME, Macfall JR, Provenzale JM, Steffens DC, Krishnan RR. Aging, gender, and the elderly adult brain: an examination of analytical strategies. Neurobiol.Aging. 2008;29:290–302. doi: 10.1016/j.neurobiolaging.2006.09.016. [DOI] [PMC free article] [PubMed] [Google Scholar]
- Held K, Rota KE, Krause BJ, Wells WM, III, Kikinis R, Muller-Gartner HW. Markov random field segmentation of brain MR images. IEEE Trans.Med.Imaging. 1997;16:878–886. doi: 10.1109/42.650883. [DOI] [PubMed] [Google Scholar]
- Helms G, Dathe H, Kallenberg K, Dechent P. High-resolution maps of magnetization transfer with inherent correction for RF inhomogeneity and T1 relaxation obtained from 3D FLASH MRI. Magn Reson.Med. 2008;60:1396–1407. doi: 10.1002/mrm.21732. [DOI] [PubMed] [Google Scholar]
- Helms G, Draganski B, Frackowiak R, Ashburner J, Weiskopf N. Improved segmentation of deep brain grey matter structures using magnetization transfer (MT) parameter maps. Neuroimage. 2009;47:194–198. doi: 10.1016/j.neuroimage.2009.03.053. [DOI] [PMC free article] [PubMed] [Google Scholar]
- Herndon RC, Lancaster JL, Giedd JN, Fox PT. Quantification of white matter and gray matter volumes from three-dimensional magnetic resonance volume studies using fuzzy classifiers. J Magn Reson.Imaging. 1998;8:1097–1105. doi: 10.1002/jmri.1880080515. [DOI] [PubMed] [Google Scholar]
- Herndon RC, Lancaster JL, Toga AW, Fox PT. Quantification of white matter and gray matter volumes from T1 parametric images using fuzzy classifiers. J Magn Reson.Imaging. 1996;6:425–435. doi: 10.1002/jmri.1880060303. [DOI] [PubMed] [Google Scholar]
- Hetherington HP, Pan JW, Mason GF, Adams D, Vaughn MJ, Twieg DB, Pohost GM. Quantitative 1H spectroscopic imaging of human brain at 4.1 T using image segmentation. Magn Reson.Med. 1996;36:21–29. doi: 10.1002/mrm.1910360106. [DOI] [PubMed] [Google Scholar]
- Hopkins AL, Yeung HN, Bratton CB. Multiple field strength in vivo T1 and T2 for cerebrospinal fluid protons. Magn Reson.Med. 1986;3:303–311. doi: 10.1002/mrm.1910030214. [DOI] [PubMed] [Google Scholar]
- Kennedy DN, Lange N, Makris N, Bates J, Meyer J, Caviness VS., Jr Gyri of the human neocortex: an MRI-based analysis of volume and variance. Cereb.Cortex. 1998;8:372–384. doi: 10.1093/cercor/8.4.372. [DOI] [PubMed] [Google Scholar]
- Laidlaw DH, Fleischer KW, Barr AH. Partial-volume Bayesian classification of material mixtures in MR volume data using voxel histograms. IEEE Trans.Med.Imaging. 1998;17:74–86. doi: 10.1109/42.668696. [DOI] [PubMed] [Google Scholar]
- Lemieux L, Hammers A, Mackinnon T, Liu RS. Automatic segmentation of the brain and intracranial cerebrospinal fluid in T1-weighted volume MRI scans of the head, and its application to serial cerebral and intracranial volumetry. Magn Reson.Med. 2003;49:872–884. doi: 10.1002/mrm.10436. [DOI] [PubMed] [Google Scholar]
- Liu T, Li H, Wong K, Tarokh A, Guo L, Wong ST. Brain tissue segmentation based on DTI data. Neuroimage. 2007;38:114–123. doi: 10.1016/j.neuroimage.2007.07.002. [DOI] [PMC free article] [PubMed] [Google Scholar]
- Look DC, Locker DR. Time saving in measurement of NMR and EPR relaxation times. REV SCI INSTRUM. 1970;41:250–251. [Google Scholar]
- Makris N, Meyer JW, Bates JF, Yeterian EH, Kennedy DN, Caviness VS. MRI-Based topographic parcellation of human cerebral white matter and nuclei II. Rationale and applications with systematics of cerebral connectivity. Neuroimage. 1999;9:18–45. doi: 10.1006/nimg.1998.0384. [DOI] [PubMed] [Google Scholar]
- Oros-Peusquens AM, Laurila M, Shah NJ. Magnetic field dependence of the distribution of NMR relaxation times in the living human brain. MAGMA. 2008;21:131–147. doi: 10.1007/s10334-008-0107-5. [DOI] [PubMed] [Google Scholar]
- Rajapakse JC, Giedd JN, Rapoport JL. Statistical approach to segmentation of single-channel cerebral MR images. IEEE Trans.Med.Imaging. 1997;16:176–186. doi: 10.1109/42.563663. [DOI] [PubMed] [Google Scholar]
- Ruan S, Jaggi C, Xue J, Fadili J, Bloyet D. Brain tissue classification of magnetic resonance images using partial volume modeling. IEEE Trans.Med.Imaging. 2000;19:1179–1187. doi: 10.1109/42.897810. [DOI] [PubMed] [Google Scholar]
- Santago P, Gage HD. Quantification of MR brain images by mixture density and partial volume modeling. IEEE Trans.Med.Imaging. 1993;12:566–574. doi: 10.1109/42.241885. [DOI] [PubMed] [Google Scholar]
- Shattuck DW, Sandor-Leahy SR, Schaper KA, Rottenberg DA, Leahy RM. Magnetic resonance image tissue classification using a partial volume model. Neuroimage. 2001;13:856–876. doi: 10.1006/nimg.2000.0730. [DOI] [PubMed] [Google Scholar]
- Shin W, Gu H, Yang Y. Fast high-resolution T(1) mapping using inversion-recovery look-locker echo-planar imaging at steady state: Optimization for accuracy and reliability. Magn Reson.Med. 2009a;61:899–906. doi: 10.1002/mrm.21836. [DOI] [PMC free article] [PubMed] [Google Scholar]
- Shin W, Gu H, Yang Y. Incidental magnetization transfer contrast by fat saturation preparation pulses in multislice Look-Locker echo planar imaging. Magn Reson.Med. 2009b;62:520–526. doi: 10.1002/mrm.22034. [DOI] [PMC free article] [PubMed] [Google Scholar]
- Tamagaki C, Sedvall GC, Jonsson EG, Okugawa G, Hall H, Pauli S, Agartz I. Altered white matter/gray matter proportions in the striatum of patients with schizophrenia: a volumetric MRI study. Am.J Psychiatry. 2005;162:2315–2321. doi: 10.1176/appi.ajp.162.12.2315. [DOI] [PubMed] [Google Scholar]
- Thompson PM, MacDonald D, Mega MS, Holmes CJ, Evans AC, Toga AW. Detection and mapping of abnormal brain structure with a probabilistic atlas of cortical surfaces. J Comput.Assist.Tomogr. 1997;21:567–581. doi: 10.1097/00004728-199707000-00008. [DOI] [PubMed] [Google Scholar]
- Vannier MW, Butterfield RL, Jordan D, Murphy WA, Levitt RG, Gado M. Multispectral analysis of magnetic resonance images. Radiology. 1985;154:221–224. doi: 10.1148/radiology.154.1.3964938. [DOI] [PubMed] [Google Scholar]
- Zhang Y, Brady M, Smith S. Segmentation of brain MR images through a hidden Markov random field model and the expectation-maximization algorithm. IEEE Trans.Med.Imaging. 2001;20:45–57. doi: 10.1109/42.906424. [DOI] [PubMed] [Google Scholar]


