

Abstract
Background. Although MYH9 is strongly associated with biopsy-proven idiopathic and HIV-associated focal segmental glomerulosclerosis (FSGS) and clinically diagnosed ‘hypertension-associated’ end-stage renal disease (ESRD) in African Americans, its role in type 2 diabetes mellitus (T2DM)-associated ESRD is unclear.
Methods. To assess whether MYH9 was associated with T2DM-ESRD, 751 African Americans with T2DM-ESRD, 227 with T2DM lacking nephropathy and 925 non-diabetic non-nephropathy controls were genotyped for 14 MYH9 SNPs. Association analyses used SNPGWA and Dandelion.
Results. Comparing T2DM-ESRD cases with non-diabetic controls, single SNP associations were detected with 8 of 14 SNPs, gender- and admixture-adjusted P-values 0.047–0.005 [recessive model, odds ratio (OR) range 1.30–1.55]. The previously associated MYH9 E1 and L1 haplotypes were associated with T2DM-ESRD (E1: OR 1.27, 95% CI 1.04–1.56, P = 0.021 recessive and L1: OR 1.43, 95% CI 1.09–1.87, P = 0.009 dominant). Contrasting the 751 T2DM-ESRD cases with 227 T2DM non-nephropathy controls revealed that E1 haplotype SNPs rs4821480, rs2032487 and rs4821481 were associated with kidney failure (OR 1.38–1.40 recessive, all P < 0.048). Among E1 and L1 risk homozygotes, respectively, mean (SD) diabetes duration prior to renal replacement therapy was 16.6 (9.7) and 16.4 (10.0) years, and 65% had diabetic retinopathy.
Conclusions. Genetic dissection of T2DM-associated ESRD reveals that MYH9 underlies a portion of this clinically diagnosed disorder in African Americans. It is likely that a subset of African Americans with T2DM and coincident nephropathy have primary MYH9-related kidney disease (e.g. FSGS or global glomerulosclerosis), although renal biopsy studies need to be performed.
Keywords: African American, diabetic nephropathy, kidney, MYH9, type 2 diabetes mellitus
Introduction
Familial aggregation of diabetic nephropathy (DN) supports a genetic contribution to disease pathogenesis [1,2]. The clinical parameters felt to be diagnostic of DN in patients with type 2 diabetes mellitus (T2DM) may capture significant numbers of patients with non-diabetic aetiologies of chronic kidney disease (CKD) [3,4]. Association analyses utilizing large numbers of cases and controls may allow for genetic dissection of this complex disorder.
Recent reports reveal that the MYH9 gene underlies several common and complex kidney diseases in African Americans, including biopsy-proven idiopathic and human immunodeficiency virus (HIV)-associated focal segmental glomerulosclerosis (FSGS) and clinically diagnosed ‘hypertension-associated end-stage renal disease’ (ESRD) [5–7]. These disparate kidney diseases often cluster in African American families, with family members having ESRD attributed to T2DM [8–10]. It remains possible that MYH9 polymorphisms underlie CKD in a subset of T2DM-ESRD cases, particularly in multiplex-affected families.
Initial analyses of MYH9 and DN-associated ESRD in 703 African Americans from the Family Investigation of Nephropathy and Diabetes (FIND) did not detect association. However, a subset (n = 284) of the Wake Forest T2DM-ESRD cases demonstrated positive odds ratios for an association within an underpowered analysis [5,6]. Therefore, we performed a MYH9 association analysis using a larger sample of 751 African Americans with clinically diagnosed T2DM-ESRD born in the southeastern U.S. and recruited at Wake Forest, 925 non-diabetic and non-nephropathy African American control subjects and 227 African Americans with T2DM lacking nephropathy, in order to increase power for detecting disease association.
Research design and methods
Participants
Self-described African Americans born in North Carolina, South Carolina, Georgia, Virginia or Tennessee formed the study populations. DN cases were unrelated, prevalent dialysis patients with DN listed as the cause of ESRD on the CMS 2728 form. After identification at dialysis clinics, follow-up chart reviews were performed by a single investigator (BIF). Type 2 diabetes was diagnosed in those treated with oral agents and/or insulin, in the absence of insulin only treatment for more than the first year after diagnosis. DN was confirmed if a chart review revealed a diagnosis by renal biopsy or the clinical criteria of T2DM duration ≥5 years prior to dialysis with diabetic retinopathy and/or proteinuria >500 mg/24 h or urine dipstick protein >30 mg/dl, in the absence of other causes of ESRD. Nearly 25% of individuals who were coded with DN on their CMS 2728 form were excluded, typically due to short durations of T2DM prior to ESRD. Unrelated, non-diabetic African Americans born in these states and recruited from Wake Forest medicine clinics or community screening events served as non-diabetic controls. Non-diabetic controls denied a personal or family history (in first degree relatives) of diabetes, kidney disease or ESRD. Most of the non-diabetic controls lacked renal function and blood glucose measurements, although we have collected this information in recent years and only 0.5% (1/200) had non-fasting blood glucose >150 mg/dl (152 mg/dl) and 2% (4/200) had serum creatinine concentrations ≥1.5 mg/dl (maximum 1.85 mg/dl).
A second association analysis was performed in a T2DM non-nephropathy (hyper-normal) control group recruited from the same geographic region. Hyper-normal controls consisted of 227 African Americans with T2DM lacking evidence of nephropathy. These controls had a serum creatinine concentration <1.5 mg/dl (men) or <1.3 mg/dl (women), urine albumin:creatinine ratio <30 mg/g and minimum 10-year diabetes duration. The study was approved by the Institutional Review Board at the Wake Forest University School of Medicine and met criteria outlined in the Declaration of Helsinki. All participants provided written informed consent.
SNP selection and genotyping
Fourteen SNPs in MYH9 were chosen for genotyping (Table 2), based on strong evidence of an association with kidney disease in prior studies [5] and subsequent detailed evaluation of the MYH9 gene region and haplotypes (data not shown). The MYH9 E1 risk haplotype (rs4821480, rs2032487, rs4821481 and rs3752462) and L1 risk haplotype (rs7078, rs12107, rs735853 and rs5756129) [7], previously associated with H-ESRD, were evaluated. SNP genotyping was performed on a Sequenom Mass Array Genotyping System (Sequenom, San Diego, CA, USA).
Table 2.
MYH9 single SNP associations T2DM-ESRD versus non-T2DM controls, gender adjusted
| Unadjusted for admixture | After admixture adjustment | ||||||||
|---|---|---|---|---|---|---|---|---|---|
| Risk | Risk allele frequency | HWE | Recessive test | Recessive test | |||||
| Marker | Allele | Cases | Controls | Cases | Controls | OR | P-value | OR | P-value |
| rs7078 | A | 0.855 | 0.850 | 0.46 | 0.70 | 1.06 | 0.6084 | 1.04 | 0.7235 |
| rs12107 | G | 0.910 | 0.885 | 1 | 0.11 | 1.37 | 0.0125 | 1.36 | 0.0161 |
| rs735853 | C | 0.918 | 0.890 | 0.05 | 0.02 | 1.37 | 0.0174 | 1.31 | 0.0465 |
| rs5756129 | T | 0.808 | 0.788 | 0.29 | 0.37 | 1.15 | 0.1770 | 1.14 | 0.1956 |
| rs5756130 | C | 0.882 | 0.879 | 0.21 | 0.75 | 1.05 | 0.6749 | 1.06 | 0.6188 |
| rs4821480 | G | 0.667 | 0.604 | 0.32 | 0.24 | 1.38 | 0.0015 | 1.33 | 0.0056 |
| rs2032487 | C | 0.674 | 0.616 | 0.28 | 0.29 | 1.35 | 0.0026 | 1.30 | 0.0100 |
| rs4821481 | C | 0.667 | 0.604 | 0.32 | 0.27 | 1.38 | 0.0013 | 1.33 | 0.0050 |
| rs3752462 | T | 0.756 | 0.737 | 0.11 | 0.23 | 1.13 | 0.2327 | 1.09 | 0.4002 |
| rs5756152 | A | 0.308 | 0.250 | 0.67 | 0.93 | 1.60 | 0.0103 | 1.55 | 0.0182 |
| rs1557539 | G | 0.975 | 0.980 | 1 | 1 | 0.81 | 0.3716 | 0.82 | 0.4005 |
| rs1005570 | A | 0.469 | 0.435 | 0.27 | 0.46 | 1.35 | 0.0143 | 1.33 | 0.0222 |
| rs16996674 | T | 0.277 | 0.234 | 0.78 | 0.78 | 1.52 | 0.0371 | 1.46 | 0.0608 |
| rs16996677 | A | 0.313 | 0.268 | 0.55 | 0.55 | 1.60 | 0.0086 | 1.54 | 0.0160 |
Seventy di-allelic ancestry informative markers (AIMs) were genotyped to provide individual admixture proportion estimates used to control for population substructure in the association tests. The African American cases and control DNA samples were genotyped using either Illumina Inc.'s Custom Genotyping Services (San Diego) or using the Sequenom MassARRAY (San Diego). Thirty-nine unrelated European American controls were recruited, as described for the African American controls, and DNA was obtained from 44 Yoruban Nigerians (YRI) from the National Institute of General Medicine Sciences (NIGMS) Human Variation Collection (Coriell Repositories, Camden, NJ, USA).
Statistical analyses
Each SNP was tested for departures from Hardy–Weinberg equilibrium (HWE) expectations via a chi square goodness of fit test [11]. Linkage disequilibrium was estimated using the classic D′ and r2 statistics as implemented in d-prime (http://www.phs.wfubmc.edu/public_bios/sec_gene/ downloads.cfm) and Haploview 3.32 [12]. All tests for association are adjusted for gender and admixture proportions. The individual admixture proportions were estimated via the expectation maximization (EM) algorithm implemented in the software FRAPPE [13]. To test for an association between each SNP and non-diabetic ESRD, we computed the overall genotypic test of association and the three a priori genetic models (dominant, additive and recessive). We tested for departures from additivity and computed the allelic and two- and three-marker haplotypes. These tests were computed using SNPGWA and Dandelion (http://www.phs.wfubmc.edu/public_bios/sec_gene/downloads.cfm); both programs use the EM algorithm for haplotype estimation. Both large sample test distribution and permutation methods were used to estimate statistical significance.
Results
DNA from 751 African Americans with T2DM-ESRD and 925 non-diabetic non-nephropathy controls were genotyped for 14 MYH9 SNPs. Of the cases, 62% were female and had developed diabetes at a mean of 39.3 years and initiated dialysis at 58.7 years (Table 1). Frequentist estimation of individual ancestry proportion (FRAPPE) was used to calculate the proportion of African ancestry in cases and controls [14]. The 70 AIMs revealed mean African ancestry proportions of 0.79 (SD = 0.10) in non-diabetic controls and 0.80 (SD = 0.11) in diabetic ESRD cases.
Table 1.
Demographic characteristics of African American T2DM-ESRD cases, T2DM non-nephropathy and non-diabetic controls
| T2DM-ESRD cases N = 751 | Non-DM controls N = 925 | T2DM non-nephropathy controls N = 227 | |
|---|---|---|---|
| Sex (% female) | 62 | 57 | 63 |
| Age at recruitment (years) | 61.8 (62) ± 10.0 | 49.5 (49) ± 11.7 | 59.3 (59) ± 10.9 |
| Age at ESRD diagnosis (years) | 58.7 (58) ± 9.9 | – | – |
| Age at DM diagnosis (years) | 39.3 (38) ± 11.2 | N/A | 41.4 (41) ± 11.4 |
| BMI at recruitment (kg/m2) | 29.7 (28.8) ± 7.1 | 29.8 (29.0) ± 7.0 | 32.6 (31) ± 7.5 |
| Duration of ESRD (years) | 3.0 (2) ± 3.4 | – | – |
| Duration of DM (years) | 22.5 (21) ± 9.4 | – | 17.8 (15) ± 7.7 |
| DM duration before ESRD (years) | 19.3 (18) ± 8.9 | – | – |
| Retinopathy (%) | 71 | – | N/A |
| Serum creatinine (mg/dl) | – | N/A | 0.95 (0.9) ± 0.20 |
| Urine albumin:creatinine (mg/g) | N/A | N/A | 5.2 (0.3) ± 7.5 |
| Fasting blood sugar (mg/dl)a | N/A | – | 149.0 (129) ± 69.6 |
| HbA1c (%)a | N/A | – | 8.5 (8) ± 2.3 |
aBased on the subset of individuals with this data available; results mean (median) ± SD; N/A not available.
The 14 SNPs genotyped spanned 49.3 kb of MYH9, encompassing the majority of the coding region (see [7] for gene structure and SNP linkage disequilibrium plot). Genotyping success rates for the MYH9 SNPs were 95.5–99.5% in cases and controls. A concordance rate of 99.8% was observed in 484 duplicate samples that were genotyped for quality control purposes. Genotyping success rates for the AIMs varied between 93.1 and 98.5%.
Table 2 summarizes allele frequencies and results of the single SNP genotypic association analysis for the diabetic ESRD cases versus non-T2DM controls. The gender and admixture-adjusted analysis revealed single SNP associations with diabetic ESRD. Consistent with prior reports, these associations were stronger under the recessive model, with 8 of 14 SNPs showing a significant effect at the 0.05 level. These associations were comparably significant without adjustment for admixture (Table 2).
Table 3 contains results of a priori MYH9 E1 and L1 haplotype associations in diabetic ESRD versus non-T2DM controls. This analysis allowed for comparison with results previously reported in FSGS, HIVAN and hypertension-associated ESRD [5,7]. The gender- and ancestry-adjusted P-value for the E1 risk haplotype (3224) determined using a weighted logistic regression analysis in diabetic ESRD cases versus controls was 0.02 [recessive, odds ratio (OR) 1.27, 95% CI 1.04–1.56]. The L1 haplotype block (1324) consisting of rs7078, rs12107, rs735853 and rs5756129 revealed P = 0.009 (dominant, OR 1.43, 95% CI 1.09–1.87). Age adjustment could not be performed due to missing age in many of the non-T2DM controls.
Table 3.
Logistic regression results T2DM-ESRD versus non-T2DM controls—MYH9 haplotypes, gender adjusted
| Haplotype frequency | No admixture adjustment | Admixture adjustment | |||||||
|---|---|---|---|---|---|---|---|---|---|
| Haplotype | Model | Case | Control | P-value | OR | 95% CI | P-value | OR | 95% CI |
| E1 haplotype consisting of SNPs: rs4821480—rs2032487—rs4821481—rs3752462 | |||||||||
| 3224 | Dominant | 0.63 | 0.57 | 0.0388 | 1.31 | (1.01, 1.70) | 0.0856 | 1.26 | (0.97, 1.64) |
| Additive | 0.0031 | 1.23 | (1.07, 1.41) | 0.0126 | 1.19 | (1.04, 1.37) | |||
| Recessive | 0.0063 | 1.32 | (1.08, 1.61) | 0.0213 | 1.27 | (1.04, 1.56) | |||
| 4442 | Dominant | 0.20 | 0.23 | 0.0183 | 0.83 | (0.68, 1.01) | 0.1532 | 0.86 | (0.71, 1.06) |
| Additive | 0.0498 | 0.85 | (0.72, 1.00) | 0.1356 | 0.88 | (0.75, 1.04) | |||
| Recessive | 0.2196 | 0.76 | (0.49, 1.18) | 0.3977 | 0.83 | (0.53, 1.28) | |||
| 4444 | Dominant | 0.13 | 0.16 | 0.0090 | 0.75 | (0.60, 0.93) | 0.0141 | 0.76 | (0.61, 0.95) |
| Additive | 0.0104 | 0.77 | (0.64, 0.94) | 0.0162 | 0.79 | (0.65, 0.96) | |||
| Recessive | 0.3950 | 0.75 | (0.38, 1.46) | 0.4295 | 0.76 | (0.39, 1.50) | |||
| L1 haplotype consisting of SNPs: rs7078—rs12107—rs735853—rs5756129 | |||||||||
| 1324 | Dominant | 0.63 | 0.57 | 0.0034 | 1.49 | (1.14, 1.94) | 0.0089 | 1.43 | (1.09, 1.87) |
| Additive | 0.0015 | 1.25 | (1.09, 1.44) | 0.0056 | 1.22 | (1.06, 1.40) | |||
| Recessive | 0.0176 | 1.28 | (1.04, 1.56) | 0.0453 | 1.23 | (1.00, 1.51) | |||
| 1334 | Dominant | 0.08 | 0.10 | 0.0394 | 0.76 | (0.59, 0.99) | 0.1006 | 0.80 | (0.61, 1.04) |
| Additive | 0.0315 | 0.77 | (0.61, 0.98) | 0.0898 | 0.81 | (0.64, 1.03) | |||
| Recessive | 0.2483 | 0.61 | (0.26, 1.42) | 0.4058 | 0.70 | (0.30, 1.64) | |||
A second association analysis contrasted these SNPs in the 751 T2DM-ESRD cases with 227 T2DM hyper-normal non-nephropathy controls (Table 4). This analysis attempted to determine whether the evidence of association was with T2DM per se or kidney disease. The age-, gender- and ancestry-adjusted analysis revealed that the single SNPs rs4821480, rs2032487 and rs4821481 were associated with T2DM-ESRD (OR 1.38–1.40 recessive; all P < 0.048). The E1 haplotype also trended towards significant differences between diabetic ESRD cases and diabetic hyper-normal controls after adjustment for age, gender and ancestry (OR 1.28 recessive, P = 0.13) (Table 5).
Table 4.
MYH9 single SNP associations T2DM-ESRD cases versus T2DM non-nephropathy controls, age and gender adjusted
| Unadjusted for admixture | After admixture adjustment | ||||||||
|---|---|---|---|---|---|---|---|---|---|
| Risk | Risk allele frequency | HWE | Recessive test | Recessive test | |||||
| Marker | Allele | Cases | Controls | Cases | Controls | OR | P-value | OR | P-value |
| rs7078 | A | 0.856 | 0.827 | 0.54 | 1.00 | 1.32 | 0.0951 | 1.30 | 0.1213 |
| rs12107 | G | 0.909 | 0.889 | 1 | 0.48 | 1.33 | 0.1384 | 1.32 | 0.1565 |
| rs735853 | C | 0.917 | 0.903 | 0.08 | 0.70 | 1.22 | 0.3314 | 1.08 | 0.7101 |
| rs5756129 | T | 0.806 | 0.818 | 0.28 | 0.26 | 0.91 | 0.5509 | 0.91 | 0.5494 |
| rs5756130 | C | 0.881 | 0.887 | 0.21 | 0.49 | 0.94 | 0.7426 | 0.97 | 0.8570 |
| rs4821480 | G | 0.665 | 0.601 | 0.36 | 0.58 | 1.50 | 0.0113 | 1.40 | 0.0381 |
| rs2032487 | C | 0.672 | 0.606 | 0.36 | 0.78 | 1.49 | 0.0122 | 1.38 | 0.0449 |
| rs4821481 | C | 0.665 | 0.603 | 0.36 | 0.67 | 1.47 | 0.0150 | 1.38 | 0.0477 |
| rs3752462 | T | 0.757 | 0.758 | 0.09 | 0.03 | 1.15 | 0.3692 | 1.07 | 0.6533 |
| rs5756152 | A | 0.313 | 0.286 | 0.67 | 0.52 | 1.13 | 0.6392 | 1.04 | 0.8886 |
| rs1557539 | G | 0.975 | 0.984 | 1 | 1 | 0.62 | 0.2651 | 0.63 | 0.2764 |
| rs1005570 | A | 0.472 | 0.455 | 0.29 | 0.41 | 1.29 | 0.1924 | 1.23 | 0.2799 |
| rs16996674 | T | 0.280 | 0.271 | 0.78 | 0.61 | 1.29 | 0.4174 | 1.18 | 0.6037 |
| rs16996677 | A | 0.313 | 0.309 | 0.67 | 1.00 | 1.08 | 0.7747 | 0.99 | 0.9803 |
Table 5.
Logistic regression results T2DM ESRD versus T2DM non-nephropathy controls—MYH9 haplotypes, age and gender adjusted
| Haplotype frequency | No admixture adjustment | Admixture adjustment | |||||||
|---|---|---|---|---|---|---|---|---|---|
| Haplotype | Model | Case | Control | P-value | OR | 95% CI | P-value | OR | 95% CI |
| E1 haplotype consisting of SNPs: rs4821480— rs2032487—rs4821481—rs3752462 | |||||||||
| 3224 | Dominant | 0.63 | 0.58 | 0.6619 | 1.10 | (0.73, 1.65) | 0.9083 | 0.98 | (0.64, 1.48) |
| Additive | 0.1081 | 1.19 | (0.96, 1.48) | 0.3213 | 1.12 | (0.90, 1.39) | |||
| Recessive | 0.0479 | 1.38 | (1.00, 1.89) | 0.1308 | 1.28 | (0.93, 1.77) | |||
| 4442 | Dominant | 0.20 | 0.22 | 0.0991 | 0.77 | (0.57, 1.05) | 0.2606 | 0.84 | (0.61, 1.14) |
| Additive | 0.4091 | 0.90 | (0.69, 1.16) | 0.8426 | 0.97 | (0.74, 1.27) | |||
| Recessive | 0.1076 | 2.20 | (0.84, 5.72) | 0.0428 | 2.74 | (1.03, 7.26) | |||
| 4444 | Dominant | 0.13 | 0.18 | 0.0504 | 0.72 | (0.51, 1.00) | 0.0799 | 0.74 | (0.53, 1.04) |
| Additive | 0.0232 | 0.72 | (0.54, 0.96) | 0.0425 | 0.74 | (0.56, 0.99) | |||
| Recessive | 0.0702 | 0.45 | (0.19, 1.07) | 0.1083 | 0.49 | (0.20, 1.17) | |||
| L1 haplotype consisting of SNPs: rs7078—rs12107—rs735853—rs5756129 | |||||||||
| 1324 | Dominant | 0.63 | 0.59 | 0.2865 | 1.25 | (0.83, 1.89) | 0.4693 | 1.17 | (0.77, 1.77) |
| Additive | 0.1681 | 1.17 | (0.94, 1.45) | 0.3361 | 1.12 | (0.89, 1.39) | |||
| Recessive | 0.2390 | 1.21 | (0.88, 1.66) | 0.4055 | 1.15 | (0.83, 1.57) | |||
| 1334 | Dominant | 0.80 | 0.90 | 0.7211 | 0.93 | (0.61, 1.40) | 0.8550 | 1.04 | (0.68, 1.59) |
| Additive | 0.9353 | 0.98 | (0.67, 1.44) | 0.6249 | 1.10 | (0.75, 1.63) | |||
| Recessive | 0.3516 | 2.63 | (0.34, 20.03) | 0.2460 | 3.36 | (0.43, 25.99) | |||
Discussion
These analyses demonstrate that MYH9 gene polymorphisms are associated with clinically diagnosed T2DM-associated ESRD in African Americans. The excess risk of hypertension-associated ESRD, FSGS and HIV-associated nephropathy (HIVAN) in African Americans appears to be partly due to a lower frequency of MYH9 risk alleles in European Americans (4%), compared to 60% in African Americans [5,6] However, MYH9 exhibits stronger evidence of an association with FSGS, HIVAN and non-diabetic ESRD, relative to diabetic ESRD as described herein. We can only speculate on reasons for the lack of the MYH9 association in 703 African Americans with diabetic ESRD ascertained in the FIND study [6]. Controls in FIND appear to be similar to ours without kidney disease or diabetes. There was no overlap between participants in the FIND and Kopp et al. reports, although Wake Forest recruited large numbers of different African American subjects in the FIND. Wake Forest cases and controls in this report were born in the southeastern U.S. and are potentially a more homogeneous sample. We accepted urinalyses revealing >30 mg/dl albuminuria on medical record review as evidence of significant proteinuria, but could not always quantitate proteinuria as was more often performed in FIND participants. Our initial report containing 284 of these cases [5] was clearly underpowered; however, the OR for the associated SNPs and the E1 haplotype were similar in this and the original report. Association in the current study could have resulted from MYH9 causing susceptibility to T2DM. An analysis comparing the 751 T2DM-ESRD cases with 227 additional African Americans with T2DM lacking nephropathy revealed that three SNPs in the strongly associated E1 haplotype were associated with diabetic ESRD. The role of MYH9 in regulation of the podocyte cytoskeleton and prior associations with several non-diabetic aetiologies of ESRD also make an association with ESRD far more likely. The MYH9 association in this report, coupled with those in the FSGS, HIVAN and hypertension-associated ESRD, supports a role for MYH9 in familial aggregation of ESRD in African Americans throughout the United States [15].
Diabetes was hypothesized to be the cause of ESRD in these cases based on widely accepted clinical criteria (similar diagnostic criteria were applied in the FIND) [16]. It is likely that a subset of these cases had occult primary FSGS causing ESRD, with coincident type 2 diabetes. MYH9 associations with DN cannot be proven without renal biopsy material [3]. In an attempt to confirm the diagnosis of DN, we carefully reviewed medical records in 26 diabetic ESRD cases receiving medical care at Wake Forest Baptist Medical Center and inheriting four MYH9 risk haplotypes (two each at E1 and L1). This subset analysis was performed since we had access to local medical records over extended periods of evaluation; thus we felt we could more easily determine if the phenotypes in these cases were atypical for DN. The mean (SD) age of diabetes onset in these selected cases was 40 (11) years, age at ESRD 58 (8) years and diabetes duration prior to ESRD 19 (9) years. Sixteen cases received insulin, and 18/26 had documented diabetic retinopathy. Ophthalmologic reports were not available in the remaining eight cases, although these eight subjects had a mean age at ESRD of 59 (7) years, with pre-dialysis diabetes duration 15 (6) years. A dipstick urine protein was available in 22 of 26 cases (19 cases ≥300 mg/dl and 3 cases ≥100 mg/ dl). Hence, these cases were clinically indistinguishable from classic DN. One patient with bilaterally enlarged and hyperechogenic kidneys on renal ultrasound and severe proliferative diabetic retinopathy post-laser photocoagulation had undergone renal biopsy. The sample contained 17 glomeruli with diffuse diabetic glomerulosclerosis and an early nodular component on light microscopy (electron and immunofluorescence microscopy not performed). All glomeruli were enlarged with the uniform thickening of their basement membranes and pronounced mesangial sclerosis and accentuation of tuft lobulation signifying classic diabetic glomerulosclerosis.
The recent demonstration that MYH9 gene polymorphisms commonly cause FSGS in African Americans makes this the most common inherited cause of FSGS. The MYH9 gene product is a mechano-enzyme localized to the podocyte foot process and responsible for movement of actin filaments. Proteins comprising the filtration slit barrier actively regulate actin dynamics in order to maintain normal cell structure [17]. Prior to these reports, MYH9 was associated with rare autosomal dominant forms of macrothrombocytopenia, often with variable degrees of sensorineural deafness, cataracts, neutrophil inclusions and glomerular disease [18,19].
African Americans with non-specific and incompletely characterized causes of ESRD, typically attributed to hypertension and diabetes, are thought to be a heterogeneous group. The MYH9 association with hypertension- and diabetes-associated ESRD in African Americans reveals a unifying major genetic aetiology for these syndromes [20]. African Americans develop ESRD attributed to diabetes mellitus four times more often than European Americans [21], although MYH9 associations are clearly weaker in diabetic, relative to non-diabetic, forms of ESRD. Phenotype information in African Americans labelled as having diabetes-associated ESRD is often poor, typically resulting from late referral and lack of kidney biopsies [22]. The difficulties in classifying type 2 diabetic ESRD, coupled with strong familial aggregation, were reasons for searching for causative genes [23]. Regardless of the actual underlying histology, this association analysis demonstrates that African Americans who appear to have type 2 diabetes-associated ESRD on clinical grounds may have MYH9-associated disease. Evaluation of renal biopsies in diabetic subjects with early stages of nephropathy will be necessary to clarify whether the disease is MYH9-associated FSGS or classic DN. Towards this end, we performed an analysis estimating the contribution that an odds ratio of 1.27 for the MYH9 E1 haplotype would have to the burden of T2DM-ESRD in African Americans. The calculation is based on the OR calculated from two contingency tables: one for MYH9 E1/E1 versus FSGS, one for the same factor versus T2DM-ESRD. Under the hypothesis that diabetic ESRD contains a fraction of cryptic ‘MYH9-related disease’, we may consider the effect of MHY9 using a 2 × 2 table:
Here X and Y are respectively the number of control and disease subjects in the study, f is the normal control frequency of the MYH9 E1/E1, P is the fraction of T2DM-ESRD that is ‘cryptic MYH9 disease’ and d is the frequency of MYH9 among subjects with MYH9 kidney disease. From the table, we may calculate the odds ratio, r, for MYH9 E1/E1 for diabetic kidney disease:
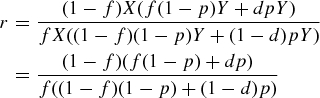 |
If we were looking at MYH9 kidney disease itself (i.e. FSGS), P would be 1. Letting the odds ratio for this be R, we get  . From the Kopp et al. and the current study, we have values for r, R and f; using these we solve for d and then for P, the quantity sought [5]. From Table 3 in this paper, we set f = 0.36 and R = 4.7. For the calculated OR (95% CI) for MYH9 in T2DM-ESRD = 1.27 (1.04–1.56), we obtain for P, the hypothesized fraction of MYH9-associated T2DM ESRD, 16% (95% CI 2.5–29%). The results were consistent with ∼16% of African American T2DM-ESRD cases from the southeastern USA having MYH9-associated kidney disease. Coincidentally, this is also the approximate percentage of diabetic subjects with ESRD who are postulated to have non-diabetic forms of ESRD [3,4] and raises the possibility that MYH9 may explain a significant proportion of non-DN present in African Americans with clinically diagnosed DN.
In conclusion, several SNPs and two haplotypes in MYH9 are significantly associated with clinically diagnosed type 2 diabetes-associated ESRD in African Americans. The MYH9 association with disparate kidney diseases, including HIVAN, FSGS, hypertension-associated ESRD and diabetes-associated ESRD likely account for the familial aggregation of disparate kidney diseases in African American families. It remains unclear whether MYH9 is associated with the classic histologic changes attributed to DN (e.g. diffuse thickening of the glomerular basement membranes, mesangial expansion and/or nodular glomerulosclerosis) or with diseases in the FSGS-global glomerulosclerosis spectrum in African Americans who have long-standing diabetes mellitus and proteinuria. Future studies in subjects with biopsy-proven kidney disease are urgently needed to answer this question.
Acknowledgments
This work was supported in part by NIH grants RO1 DK 070941 (BIF) and RO1 DK53591 (DWB), and the NIDDK and NCI Intramural Research Programs. The authors are indebted to the local nephrology community, including all physicians and their patients who participated, as well as to our study coordinators Joyce Byers, Carrie Smith, Mitzie Spainhour, Cassandra Bethea and Sharon Warren. This project has been funded in whole or in part with federal funds from the National Cancer Institute, National Institutes of Health, under contract N01-CO-12400 and HHSN261200800001E. The content of this publication does not necessarily reflect the views or policies of the Department of Health and Human Services, nor does mention of trade names, commercial products or organizations imply endorsement by the U.S. Government. This Research was supported in part by the Intramural Research Programs of the NIH, National Cancer Institute, Center for Cancer Research.
Conflict of interest statement. None declared.
References
- 1.Ng DP, Krolewski AS. Molecular genetic approaches for studying the etiology of diabetic nephropathy. Curr Mol Med. 2005;5:509–525. doi: 10.2174/1566524054553504. [DOI] [PubMed] [Google Scholar]
- 2.Freedman BI, Bostrom M, Daeihagh PD, et al. Genetic factors in diabetic nephropathy. Clin J Am Soc Nephrol. 2007;2:1306–1316. doi: 10.2215/CJN.02560607. [DOI] [PubMed] [Google Scholar]
- 3.Pham TT, Sim JJ, Kujubu DA, et al. Prevalence of nondiabetic renal disease in diabetic patients. Am J Nephrol. 2007;27:322–328. doi: 10.1159/000102598. [DOI] [PubMed] [Google Scholar]
- 4.Cordonnier D. Glomerular involvement in type II diabetes—is it all diabetic glomerulosclerosis? Nephrol Dial Transplant. 1996;11:936–938. doi: 10.1093/oxfordjournals.ndt.a027504. [DOI] [PubMed] [Google Scholar]
- 5.Kopp JB, Smith MW, Nelson GW, et al. MYH9 is a major-effect risk gene for focal segmental glomerulosclerosis. Nat Genet. 2008;40:1175–1184. doi: 10.1038/ng.226. [DOI] [PMC free article] [PubMed] [Google Scholar]
- 6.Kao WH, Klag MJ, Meoni LA, et al. MYH9 is associated with nondiabetic end-stage renal disease in African Americans. Nat Genet. 2008;40:1185–1192. doi: 10.1038/ng.232. [DOI] [PMC free article] [PubMed] [Google Scholar]
- 7.Freedman BI, Hicks PJ, Bostrom MA, et al. Polymorphims in the non-muscle myosin heavy chain 9 gene (MYH9) are strongly associated with end-stage renal disease historically attributed to hypertension in African Americans. Kidney Int. 2009;75:736–745. doi: 10.1038/ki.2008.701. [DOI] [PMC free article] [PubMed] [Google Scholar]
- 8.Freedman BI, Spray BJ, Tuttle AB, et al. The familial risk of end-stage renal disease in African Americans. Am J Kidney Dis. 1993;21:387–393. doi: 10.1016/s0272-6386(12)80266-6. [DOI] [PubMed] [Google Scholar]
- 9.Freedman BI, Tuttle AB, Spray BJ. Familial predisposition to nephropathy in African-Americans with non-insulin-dependent diabetes mellitus. Am J Kidney Dis. 1995;25:710–713. doi: 10.1016/0272-6386(95)90546-4. [DOI] [PubMed] [Google Scholar]
- 10.Freedman BI, Iskandar SS, Appel RG. The link between hypertension and nephrosclerosis. Am J Kidney Dis. 1995;25:207–221. doi: 10.1016/0272-6386(95)90001-2. [DOI] [PubMed] [Google Scholar]
- 11.Wigginton JE, Cutler DJ, Abecasis GR. A note on exact tests of Hardy–Weinberg equilibrium. Am J Hum Genet. 2005;76:887–893. doi: 10.1086/429864. [DOI] [PMC free article] [PubMed] [Google Scholar]
- 12.Barrett JC, Fry B, Maller J, et al. Haploview: analysis and visualization of LD and haplotype maps. Bioinformatics. 2005;21:263–265. doi: 10.1093/bioinformatics/bth457. [DOI] [PubMed] [Google Scholar]
- 13.Tang H, Peng J, Wang P, et al. Estimation of individual admixture: analytical and study design considerations. Genet Epidemiol. 2005;28:289–301. doi: 10.1002/gepi.20064. [DOI] [PubMed] [Google Scholar]
- 14.Keene KL, Mychaleckyj JC, Smith SG, et al. Association of the distal region of the ectonucleotide pyrophosphatase/phosphodiesterase 1 gene with type 2 diabetes in an African-American population enriched for nephropathy. Diabetes. 2008;57:1057–1062. doi: 10.2337/db07-0886. [DOI] [PubMed] [Google Scholar]
- 15.Satko SG, Sedor JR, Iyengar SK, et al. Familial clustering of chronic kidney disease. Semin Dial. 2007;20:229–236. doi: 10.1111/j.1525-139X.2007.00282.x. [DOI] [PubMed] [Google Scholar]
- 16.Knowler WC, Coresh J, Elston RC, et al. The Family Investigation of Nephrology and Diabetes (FIND): design and methods. J Diabetes Complications. 2005;19:1–9. doi: 10.1016/j.jdiacomp.2003.12.007. [DOI] [PubMed] [Google Scholar]
- 17.Faul C, Asanuma K, Yanagida-Asanuma E, et al. Actin up: regulation of podocyte structure and function by components of the actin cytoskeleton. Trends Cell Biol. 2007;17:428–437. doi: 10.1016/j.tcb.2007.06.006. [DOI] [PubMed] [Google Scholar]
- 18.Seri M, Cusano R, Gangarossa S, et al. Mutations in MYH9 result in the May–Hegglin anomaly, and Fechtner and Sebastian syndromes. The May–Hegglin/Fechtner Syndrome Consortium. Nat Genet. 2000;26:103–105. doi: 10.1038/79063. [DOI] [PubMed] [Google Scholar]
- 19.Seri M, Savino M, Bordo D, et al. Epstein syndrome: another renal disorder with mutations in the nonmuscle myosin heavy chain 9 gene. Hum Genet. 2002;110:182–186. doi: 10.1007/s00439-001-0659-1. [DOI] [PubMed] [Google Scholar]
- 20.Freedman BI, Sedor JR. Hypertension-associated kidney disease: perhaps no more. J Am Soc Nephrol. 2008;19:2047–2051. doi: 10.1681/ASN.2008060621. [DOI] [PubMed] [Google Scholar]
- 21.U.S. Renal Data System. USRDS 2007 Annual Data Report. Atlas of End-Stage Renal Disease in the United States, National Institutes of Health, National Institute of Diabetes and Digestive and Kidney Diseases, Bethesda, MD. 2007.
- 22.Crook ED, Harris J, Oliver B, et al. Endstage renal disease owing to diabetic nephropathy in Mississippi: an examination of factors influencing renal survival in a population prone to late referral. J Investig Med. 2001;49:284–291. doi: 10.2310/6650.2001.33974. [DOI] [PubMed] [Google Scholar]
- 23.Freedman BI, Bowden DW, Rich SS, et al. Genetic initiation of hypertensive and diabetic nephropathy. Am J Hypertens. 1998;11:251–257. doi: 10.1016/s0895-7061(97)00481-0. [DOI] [PubMed] [Google Scholar]