Abstract
Introduction
This prospective observational study evaluated changes in the 3-dimensional position and remodeling of the mandibular rami, condyles, and chin at splint removal and 1 year after mandibular advancement surgery.
Methods
Presurgery, splint removal (4–6 weeks postsurgery), and 1-year postsurgery cone-beam computed tomography scans of 27 subjects were used. Superimposition on the cranial base was used to assess positional or remodeling changes in the anatomic regions of interest. Surface distance displacements were visually displayed and quantified by 3-dimensional color maps. A 1-sample t test was used to assess the average postsurgical changes of each region of interest. The level of significance was set at 0.05.
Results
After antero-inferior chin displacement with surgery (mean, 6.81 ± 3.2 mm at splint removal), the average 1-year post-surgery displacement was not statistically significant (P = 0.44). Postsurgical adaptations greater than 2 mm were observed in 48% of the patients: 16% with an additional anterior-inferior displacement of the chin of 2 to 4 mm, and 4% with ≥4 mm; 20% had postero-superior movement of 2 to 4 mm, and 8% had postero-superior movement of ≥4 mm. The condyles tended to move, on average, ≤2 mm supero-posteriorly with surgery, and this small positional displacement was maintained 1 year postsurgery (right condyle, P = 0.58; left, P = 0.88). The rami exhibited outward (lateral) movements with surgery, with greater displacement of the inferior part of the rami (≥2 mm in 65% of the subjects). This torque of the ramus with surgery was stable 1 year postsurgery.
Conclusions
Three-dimensional assessment of skeletal changes with mandibular advancement surgery shows that nearly half of the patients have >2 mm change in chin position from splint removal to the 1-year follow-up, with approximately equal chances of anterior and posterior movement. Torque of the rami usually occurs with mandibular advancement surgery.
Although mandibular advancement surgery is considered a highly stable procedure,1,2 some clinical concerns have been raised regarding condylar changes that can lead to sagittal relapse and anterior bite opening.3–5 Assessment of surgical treatment outcomes with 3-dimensional (3D) cone-beam computed tomography (CBCT) images and superimposition tools6 allowed the identification and quantification of bone displacement and remodeling that can help to explain the interactions between dental, skeletal, and soft-tissue components that underpin the response to treatment.7,8
Previous studies used 3D virtual model superimposition techniques to assess postsurgical outcomes and stability in Class III patients; however, postsurgical outcomes of Class II correction have not been evaluated with this methodology.7,9–12 The purpose of this study was to evaluate the 3D changes in the position and remodeling of the mandibular rami, condyles, and chin at splint removal and 1 year after mandibular advancement surgery.
MATERIAL AND METHODS
Twenty-seven patients (9 men, 18 women; mean age, 30.04 ± 13.08 years; range, 17.2–48.1 years) who had surgery at Memorial Hospital at the University of North Carolina (UNC) by a surgeon and resident assistant from the Department of Oral and Maxillofacial Surgery were recruited for this prospective observational study. The protocol was approved by the Biomedical Institutional Review Board, and informed consent was obtained from all subjects. All patients had normal or horizontal facial patterns and skeletal Class II discrepancies with greater than 5 mm overjet that were severe enough to warrant orthognathic surgery. All patients underwent orthodontic treatment and had mandibular advancement surgery with bilateral sagittal split osteotomy. Nine participants also had genioplasty as an adjunctive procedure. Patients with anterior open bite, cleft lip or palate, or skeletal disharmonies from trauma or degenerative conditions such as rheumatoid arthritis were excluded.
CBCT scans were taken before surgery, at splint removal (4–6 weeks postsurgery), and 1 year postsurgery (after orthodontic treatment) with the NewTom 3G (Aperio Services, Sarasota, Fla). The imaging protocol involved a 36-second head CBCT scanning with a 12-in field of view. All CBCT scans were acquired with the patient biting on a thin wax bite to maintain centric occlusion. Two patients had at least 1 scan taken with the NewTom 9000 (Aperio Services), which has a 9-in field of view. Therefore, the field of view did not include the chin in the NewTom 9000 scans. The 3D models were constructed from CBCT images with a voxel dimension of 0.5 × 0.5 × 0.5 mm. Image segmentation of the anatomic structures of interest and the 3D graphic rendering were done by using the ITK-SNAP open-source software.13
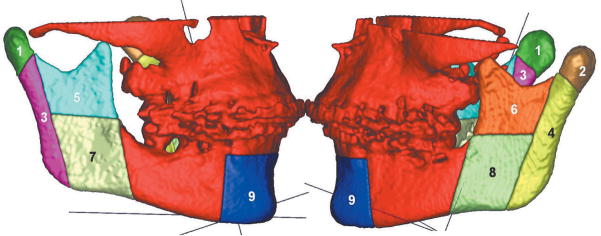
The presurgery and postsurgery models were registered with the cranial base as a reference, because this structure is not altered by surgery. A fully automated voxel-wise rigid registration method was performed with IMAGINE free software (developed by the National Institutes of Health and modified at UNC).7 The software compares 2 images by using the intensity of gray scale for each voxel of the presurgical cranial base (Fig 1). Virtual models of the condyles (right and left), posterior rami (right and left), superior rami (right and left), inferior rami (right and left), and chin were relocated with the cranial base (Fig 2).
Fig 1.
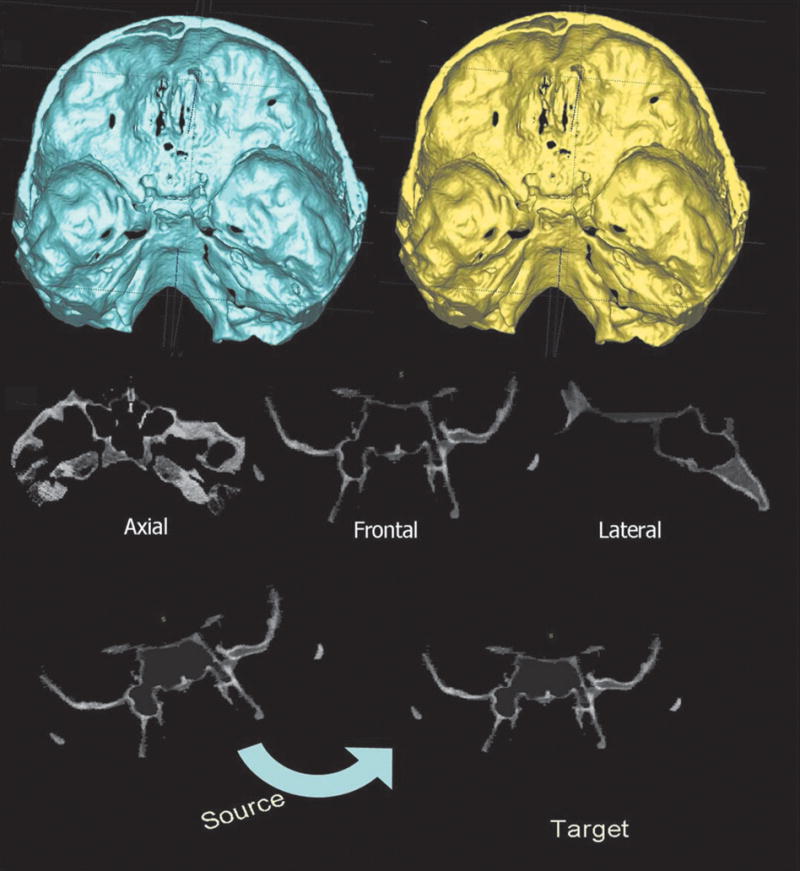
Registration, with a fully automated voxel-wise method, of 2 CBCT-generated 3D virtual models by using the presurgery (or splint removal) cranial base surface as a reference (target) for the postsurgery cranial base (source). The virtual models of the maxilla and mandible were relocated with the postsurgery cranial base.
Fig 2.
Anatomic regions of interest: 1, right condyle; 2, left condyle; 3, right posterior ramus; 4, left posterior ramus; 5, right superior ramus; 6, left superior ramus; 7, right inferior ramus; 8, left inferior ramus; and 9, chin.
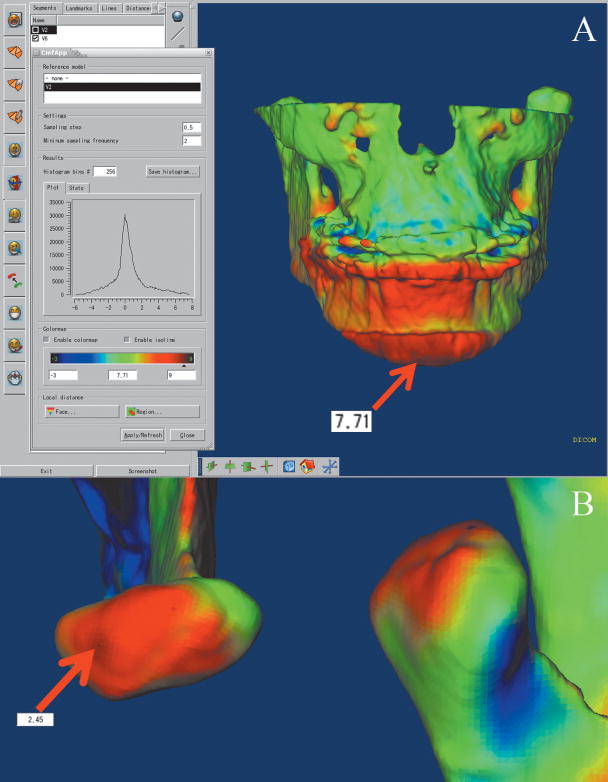
The use of multiple software for all image analysis procedures required exchanging 3D data among software and interchangeable file formats. After the registration step, all reoriented virtual models, originally saved in an open source image file format (.gipl format), were converted to a 3D interchange file format (.iv format). The software Vol2Surf (publicly available software) was used for this file format conversion, allowing the quantitative evaluation of the greatest surface displacement by the CMF software (Maurice Müller Institute, Bern, Switzerland).14 The CMF tool calculates thousands of color-coded point-to-point comparisons (surface distances in millimeters) between the 3D models, so that the difference between 2 surfaces at any location can be quantified.15 For quantitative assessment of the changes between the 3D surface models, the isoline tool was used. It allows the user to define a surface-distance value that is then expressed as a contour line (isoline) that corresponds to regions having a surface distance equal to or greater than the defined value. The isoline tool was used to quantitatively measure the greatest displacements between points in the 3D surface models for 9 anatomic regions of interest (Figs 2 and 3). Positive values indicated anterior-inferior displacement of the chin, and negative values posterior-superior displacement. For the condyles, positive values represent posterior-superior displacement, and negative values anterior-inferior displacement. For the posterior borders of the rami, positive values indicate posterior displacements, and negative values anterior displacements. The lateral portion of the mandibular rami was divided into 2 parts (superior and inferior) to aid in identifying complex torque or medial or lateral movement of this region. Positive values represent lateral displacement of the rami, and negative values medial displacement. Displacements of the inferior and superior regions of the ramus in opposite directions or with different magnitudes indicate torque movement of this structure.
Fig 3.
The isoline tool of the CMF application allows the identification of the greatest displacement of a specific anatomic region. The isolines connect areas or points with similar characteristics and can be adjusted to measure specific areas of the color maps. A, Example of 7.71-mm chin advancement (presurgery to splint removal, immediate surgical outcome); B, condyle displacement after surgery measured with the isoline tool showing a 2.45-mm posterior-superior displacement of a right condyle.
The largest displacements at each anatomic region of interest were computed for presurgery to splint removal (immediate surgical outcome), presurgery to 1 year postsurgery (1-year postsurgical outcome), and splint removal to 1 year postsurgery (postsplint removal change).
Statistical analysis
The greatest displacement for each region of 10 randomly selected superimpositions was measured twice, at a 2-week interval, and agreement between the replicates was assessed by using intraclass correlations (ICC).
For each anatomic region, a 1-sample t test was used to test the null hypothesis that the average postsplint removal change was 0. The level of significance was set at 0.05. The percentages of patients who experienced positive or negative displacements greater than 2 mm in each region were also calculated.
RESULTS
Agreement between repeated measures was excellent for all anatomic regions: chin (ICC = 0.98), condyles (ICC = 0.92), posterior borders (ICC = 0.97), superior rami (ICC = 0.97), and inferior rami (ICC = 0.95).
Qualitative visual analysis of the displacements and the remodeling process of the condyles indicated a general trend of posterior-superior displacement of the condyles with surgery, and a tendency for posterior condylar surface flattening adaptation (bone remodeling) at the 1-year follow-up. Examples of variability in adaptations to surgical displacements are shown in Figures 4 and 5. In both subjects, the condyles were displaced postero-superiorly with surgery. In Figure 4, a marked change in condylar morphology with posterior surface remodeling is evident. In Figure 5, the postero-superior condylar displacement with surgery was not maintained at the 1-year follow-up, but the condylar morphology remained the same.
Fig 4.
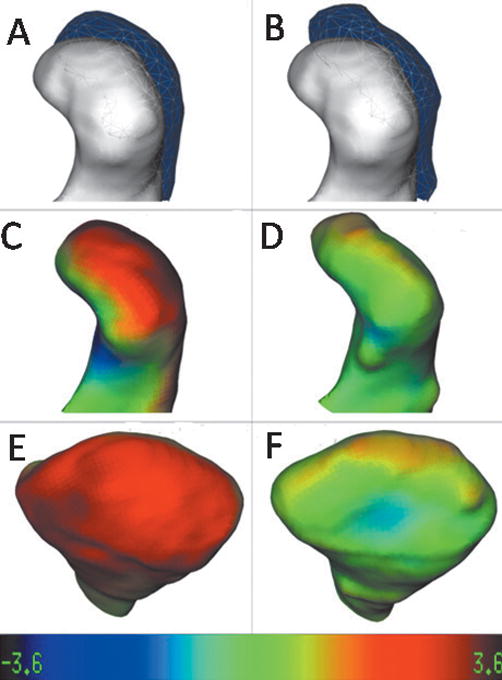
Left condyle of a patient that was displaced with surgery and showed a stable position with bone remodeling at the 1-year follow-up. A and B, Lateral view of mesh-transparency visualizations of condylar position and morphology: A, superimposed models presurgery (white) and at splint removal (semitransparent mesh; B, superimposed models presurgery (white) and at 1 year postsurgery (semitransparent mesh). Note the stability of the condylar position at 1 year postsurgery in B compared with splint removal in A, but the postero-superior surface of the condyle was flattened in B. C–F, Surface distance color maps visualization: C, lateral view and E, posterior view of condylar models at splint removal displaying the surface distances between presurgery to splint removal; D, lateral view and F, posterior view of condylar models at the 1-year follow-up displaying the surface distances between splint removal and the 1-year follow-up. Note, in more detail in these views, how the postero-superior surface of the condyle was flattened when we compare the models in C and E with the D and F views. Color map ranges between −3.6 mm (dark blue) and +3.6 mm (dark red).
Fig 5.
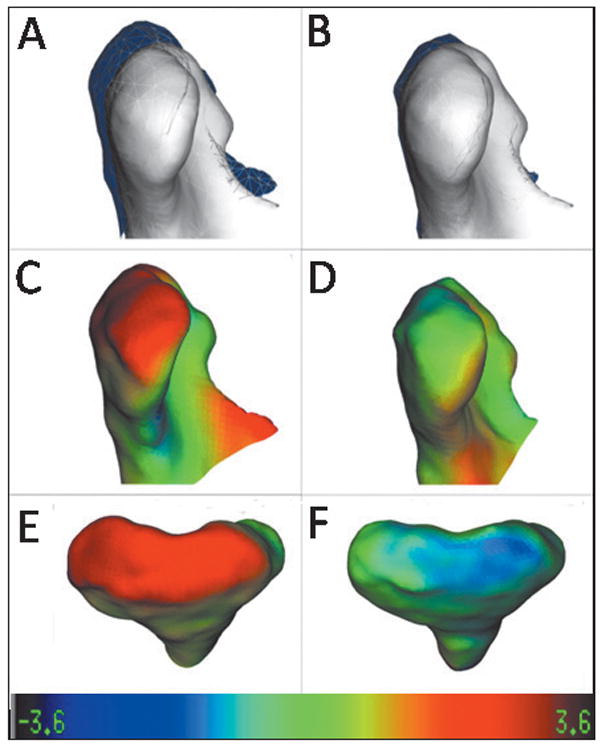
Another example of postsurgical adaptations to condylar displacement with surgery. In this subject, the right condyle was displaced postero-superiorly with surgery; this displacement decreased at the 1-year follow-up, mainly by real positional displacement, since the condyles have not shown marked contour changes. A and B, Lateral view of mesh-transparency visualizations of condylar position and morphology: A, superimposed models presurgery (white) and at splint removal (semitransparent mesh); B, superimposed models presurgery (white) and 1 year postsurgery (semi-transparent mesh). Note the change in the condylar position 1 year postsurgery in B compared with splint removal in A. C–F, Surface distance color map visualizations: C, lateral view, and E, posterior view of condylar models at splint removal displaying the surface distances between presurgery to splint removal; D, lateral view, and F, posterior view of condylar models at the 1-year follow-up, displaying surface distances between splint removal and the 1-year follow-up that were smaller and in the opposite direction of the models in C and E. Color map ranges between −3.6 mm (dark blue) and +3.6 mm (dark red).
The qualitative evaluation of the ramus displacements showed that, in general, these structures had torque after the bilateral sagittal split osteotomy. Torque is usually expressed with a lateral movement greater in the inferior portion than in the superior portion of the ramus. Even though the patients in this sample were considered clinically symmetrical, the torque of the rami was generally asymmetrical (Figs 6 and 7).
Fig 6.
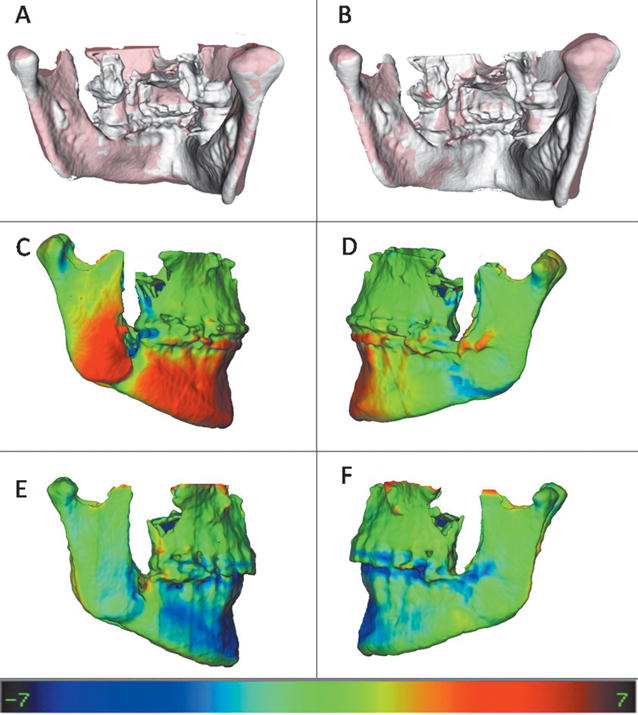
Example of a patient who had asymmetrical torque of the mandible with surgery; this torque remained stable at the 1-year follow-up, but the chin advancement relapsed slightly. A and B, Semi-transparency visualizations of lateral displacements of the inferior portion of the rami with surgery: A, presurgery is shown (white), and splint-removal model is semitransparent (red) and maintained after 1 year; B, presurgery is shown (white), and 1-year follow-up is semitransparent (red). The torque change was greater on the right side than on the left. C and D, Color maps of the splint-removal model showing the surface distances between presurgery and splint removal. These maps show that the inferior portion of the right side moved laterally (C) much more than the left side (D) with surgery, with marked chin advancement of 7 mm. E and F, Color maps of the 1-year follow-up model showing the surface distances between splint removal and the 1-year follow-up. These maps show that postsurgical adaptations in the ramus were almost zero (green), but some relapse occurred in the chin advancement (blue). Color map ranges between −7.0 mm (dark blue) and +7.0 mm (dark red).
Fig 7.
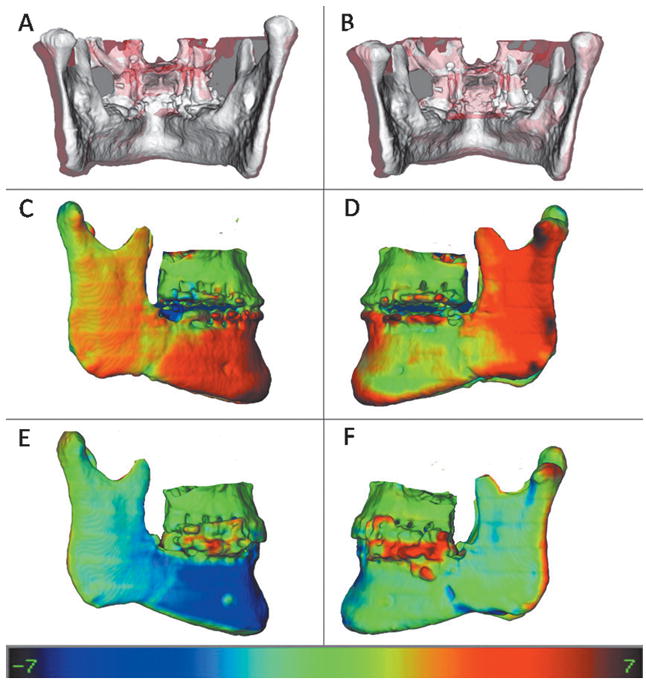
Example of a patient who had lateral displacement of the rami with surgery on both sides: A, Presurgery is shown in white, and splint removal is shown in semitransparent red; B, presurgery shown in white and 1-year follow-up model is shown in semitransparent red. C and D, right and left views, respectively, of the splint-removal model, displaying the color maps of the surface distances between presurgery and splint removal. E and F, right and left views, respectively, of the 1-year follow-up model, with color maps of the surface distances between splint removal and the 1-year follow-up. The rami movement was maintained at the 1-year follow-up on the left side (F) and relapsed medially on the right (E). Also, note some relapse of chin advancement (blue). Color map ranges between −7.0 mm (dark blue) and +7.0 mm (dark red).
Color map observation in the posterior borders of the rami showed small changes on average, with displacements occurring as often to the posterior as to the anterior.
The chin was advanced anteriorly in all subjects, and the lower border of the mandible showed only small inferior displacement. Figures 6 through 8 show examples of individual variations in the stability of chin advancement postsurgically.
Fig 8.
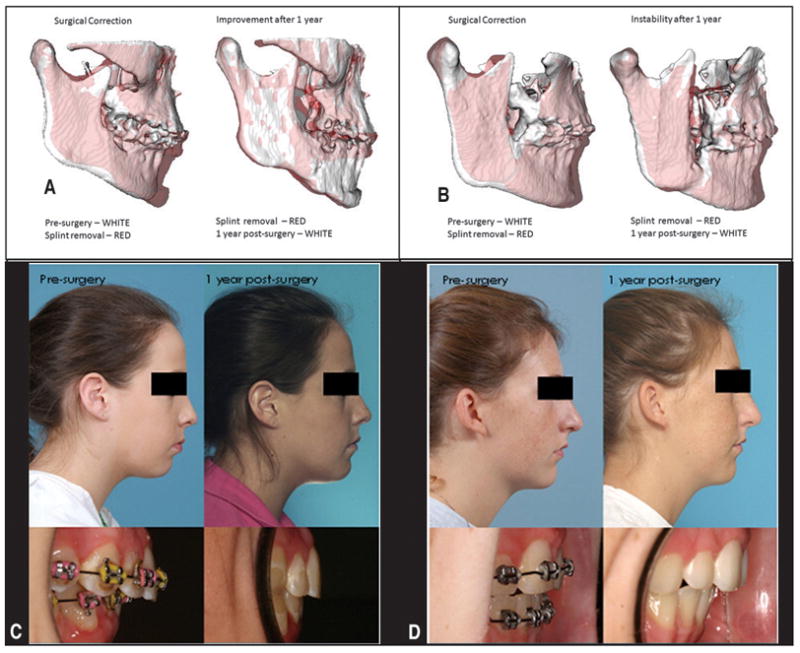
A and C, Patient showing improvement of mandibular advancement between splint removal and the 1-year follow-up (note mandibular counterclockwise rotation in the splint-removal to the 1-year postsurgery semitransparencies in A). B and D, Postsurgical adaptations in another patient (B shows the backward displacement of the chin between splint removal and 1 year postsurgery, compromising the surgical outcome).
The mean mandibular advancements measured as surfaces distances in the chin region relative to the cranial base were 6.8 ± 3.2 mm at splint removal and 6.4 ± 3.4 mm at 1 year postsurgery. Interpretation of the mean behavior of the chin in this sample should take into account that 9 of the 27 subjects had genioplasty. The average postsurgical change at the 1-year follow-up was not statistically significant for the chin (P = 0.44) (Tables I and II). The variability in postsurgical surface displacements is illustrated in Figures 8 and 9.
Table I.
Descriptive statistics for the greatest displacement at each anatomic region from presurgery to splint removal and presurgery to 1 year postsurgery
| Region | n | Presurgery to splint removal | Presurgery to 1 year postsurgery |
|---|---|---|---|
| Mean ± SD (mm) | Mean ± SD (mm) | ||
| Chin | 25 | 6.81 ± 3.20 | 6.36 ± 3.41 |
| Inferior ramus (right) | 27 | 2.34 ± 2.35 | 2.10 ± 2.15 |
| Inferior ramus (left) | 27 | 2.97 ± 2.71 | 2.76 ± 2.80 |
| Superior ramus (right) | 27 | 0.62 ± 1.94 | 0.45 ± 2.08 |
| Superior ramus (left) | 27 | 1.57 ± 1.92 | 1.33 ± 2.05 |
| Posterior ramus (right) | 27 | − 0.09 ± 1.84 | − 0.03 ± 1.69 |
| Posterior ramus (left) | 27 | 0.08 ± 2.32 | 0.17 ± 2.55 |
| Condyle (right) | 27 | 0.81 ± 1.40 | 0.85 ± 1.59 |
| Condyle (left) | 27 | 0.98 ± 1.46 | 1.15 ± 1.54 |
Table II.
One-sample t test for the postsplint-removal changes (postsplint removal to 1 year)
| Region | Mean of difference | 95% CI of mean | SD | P value | |
|---|---|---|---|---|---|
| Chin | − 0.40 | − 1.43 | 0.64 | 2.50 | 0.44 |
| Inferior ramus (right) | − 0.46 | − 1.07 | 0.16 | 1.55 | 0.14 |
| Inferior ramus (left) | − 0.26 | − 0.98 | 0.46 | 1.82 | 0.46 |
| Superior ramus (right) | − 0.31 | − 0.83 | 0.20 | 1.31 | 0.22 |
| Superior ramus (left) | − 0.13 | − 0.66 | 0.41 | 1.35 | 0.63 |
| Posterior ramus (right) | 0.53 | 0.05 | 1.00 | 1.20 | 0.03* |
| Posterior ramus (left) | 0.18 | − 0.49 | 0.85 | 1.70 | 0.58 |
| Condyle (right) | 0.16 | − 0.44 | 0.77 | 1.53 | 0.58 |
| Condyle (left) | 0.05 | − 0.58 | 0.67 | 1.58 | 0.88 |
P <0.05 statistically significant.
Fig 9.
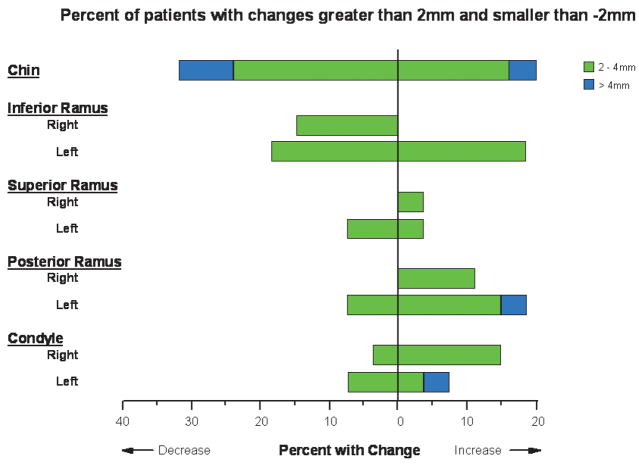
Percentages of patients with changes (between splint removal and 1-year follow-up) >2 mm and <−2 mm for the 9 anatomic regions of interest. Patients with displacements between −2 and 2 mm are not represented. Note that positive or negative values of displacements represent different directional movements depending on the specific region of interest.
Between splint removal and 1 year postsurgery, the chin position was displaced 2 to 4 mm farther forward in 16% of the patients and more than 4 mm in 4% of the patients. Postero-superior movement of the chin (2–4 mm) occurred in 20% of the patients and backward displacement of the chin greater than 4 mm in 8%.
The inferior rami regions tended to be laterally displaced during surgery, probably because of the osteotomy cut in this region (Figs 6 and 7). The inferior rami had mean displacements of 2.34 ± 2.35 mm on the right side and 2.97 ± 2.71 mm on the left side with surgery. The rami exhibited outward (lateral) movements with surgery, with greater displacements of the inferior part of the rami (≥2 mm in 65%). This torque of the ramus with surgery was stable 1 year postsurgery (right, P = 0.14; left, P = 0.46). For the inferior portions of the rami, 11 patients (20%) had more than a 2-mm change between splint removal and 1-year postsurgery (Fig 9).
The only region that showed statistically significant changes in the postsurgical period (splint removal to the 1-year follow-up) was the posterior border of the right ramus. The mean displacement of this region was 0.59 mm, which is quite close to the spatial resolution of the 3D virtual models used in this study (0.50 mm). This finding might have no clinical significance (Table II).
In this study, relatively small condylar displacements occurred with surgery (left, 0.98 ± 1.46 mm; right, 0.81 ± 1.40 mm) and between splint removal and the 1-year follow-up (left, 0.05 ± 1.53 mm; right, 0.16 ± 1.58 mm). These small displacements were often unilateral. Four patients had a posterior-superior displacement of both condyles with surgery >2 mm that was maintained 1 year postsurgery. One patient had >2 mm antero-inferior condylar displacements with surgery and showed >2 mm posterior-superior displacement on both sides after splint removal. For the rest of the patients who had greater than 2-mm displacement between splint removal and the 1-year follow-up (Fig 9), the displacement was unilateral. Condylar remodeling after removal of the splint was minimal.
DISCUSSION
Three-dimensional assessment of surgical outcomes requires a choice of stable reference landmarks or structures for registration and superimposition. In conventional cephalometrics, the cranial base often is used for superimpositions because it shows minimal changes after neural growth is completed. Although landmark location in 2 dimensions is hampered by identification of hard and soft tissues on x-rays because of the superimposition of several structures, locating 3D landmarks on complex curving structures is significantly more difficult. As Bookstein et al16 and Bookstein17 noted, there are no suitable operational definitions for craniofacial landmarks in the 3 planes of space (coronal, sagittal, and axial). In the context of facial changes, superimposition should not rely on landmark identification or best-fit techniques on structures that might have changed between acquisitions. For this reason, we used superimposition on the whole surface of the cranial base.
The major strength of the superimposition method used in this study is that registration does not depend on the precision of the 3D surface models. The cranial base models are only used to mask anatomic structures that change with growth and treatment. The registration procedure actually compares voxel by voxel the gray level of the CBCT images, containing only the cranial base, and calculates the rotation and translation parameters between the changes at the 2 times.
For assessment of mandibular advancement, superimposition on the cranial base in this study describes displacements relative to the cranial base and maxilla, since our sample consisted of nongrowing subjects and single-jaw procedures.7,8,18–21 For assessment of surgical outcomes of 2-jaw surgery, the information from regional superimpositions to assess relative displacement of mandibular and maxillary skeletal and dental components can differ from the conclusions from cranial-base superimposition.18,20, 22–24 The color maps indicate changes that could be observed only with 3D data, which allow observations and measurements that are not the same as those evaluated in 2-dimensional (2D) cephalometric studies. Although the quantitative measurements in this study (3D maximum surface distance displacements) can be compared with what we know from previous 2D studies (eg, projection of the chin horizontally and vertically), assessment of bilateral data (side-specific adaptations) and specific regional locations of surface changes are unique to 3D assessments.
Although a 3D analysis gives additional information compared with traditional cephalometric methods, quantification of the 3D morphologic changes poses methodologic challenges. In this study, to measure distances between the bone surfaces at 2 times, the closest surface point method was used. Current methods that calculate surface distances, including the methods of commercially available software (Geomagic Studio, Geomagic U.S. Corp, Research Triangle Park, NC; Vultus, 3dMD, Atlanta, Ga), calculate the closest points between 2 surfaces that were displaced with surgery. However, the closest points might not be homologous in both surfaces. Quantification of surface distances by using closest points does not quantify vectorial magnitudes of 3D displacements. For this reason, when we compare short-term (presurgery to splint removal) and long-term displacements (presurgery to 1 year), quantification with isolines provides absolute positive or negative values of displacements and aids assessment of the direction of displacement. For example, positive values at the chin indicate anterior-inferior displacement, but it is not possible to determine the vector of how anterior and how inferior the displacement is. Studies in progress are focusing on determining surface point correspondence. This method (shape correspondence), being developed at the University of North Carolina, quantifies vectorial displacements and, in the future, will improve directional evaluation.
It has been advocated that precise repositioning of the condyles during surgery would ensure stability of the surgical results and reduce the chance of post-surgical temporomandibular joint problems.4 The extent of condylar change that is compatible with normal function postsurgically is still unknown. No temporomandibular joint symptoms were reported by any patient in this sample 1 year after surgery. The condyles rotated transversally with mandibular advancement as the proximal and distal surgical segments were repositioned with surgery. These findings corroborate those of studies that used submentovertex radiography25,26 and cross-sectional slices with computed tomography.4,27,30 Changes in all planes have been described, with reported variability in condylar orientation changes (1° to 18°) and changes in intercondylar distance (−5 to +4 mm).4,25–30 The literature supports our findings that small condylar rotations do not appear to have a functional compromise, and rotation apparently tends to reduce with time because of the remodeling process.1,4,25–32
The hierarchy of stability for current orthognathic surgical procedures has been determined based on lateral cephalograms from the UNC dentofacial program database.1,2,33 Those assessments indicate that mandibular advancement up to about 10 mm is highly stable in patients with a normal or short face, with approximately 10% of the patients having clinically detectable post-treatment changes (2 mm or more) at 1 year postsurgery. In this study, by using the 3D surface distance quantification, 48% of the patients had postsplint-removal changes in chin position greater than a 2-mm displacement of the chin (20% of these patients had farther forward and downward movement, and 28% had backward and upward movement). The postsurgical adaptations reported in this study are most likely greater than those from 2D cephalometric studies, since previous studies reported 2D linear measurements at specific landmarks, whereas 3D assessments describe maximum 3D changes along the whole bony surfaces of each region of interest. Our results are only at the 1-year surgical follow-up (completion of orthodontic treatment), and long-term skeletal and dental adaptations still need to be assessed.
CONCLUSIONS
Three-dimensional assessment of skeletal changes with mandibular advancement surgery shows considerable individual variability in the stability of the correction at 1 year postsurgery. Nearly half of the patients had >2 mm change in chin position from splint removal to the 1-year follow-up, with approximately equal chances of anterior and posterior movement.
Torque of the rami usually occurs with mandibular advancement surgery.
Acknowledgments
We thank William R. Proffit for editorial assistance and Debora Price for assistance with the figures.
Supported by National Institute for Dental and Craniofacial Research (NIDCR) DE017727, DE018962, DE005215, and CAPES 3827-05-4.
Footnotes
The authors report no commercial, proprietary, or financial interest in the products or companies described in this article.
References
- 1.Bailey LJ, Cevidanes LH, Proffit WR. Stability and predictability of orthognathic surgery. Am J Orthod Dentofacial Orthop. 2004;126:273–7. doi: 10.1016/S0889540604005207. [DOI] [PMC free article] [PubMed] [Google Scholar]
- 2.Proffit WR, Turvey TA, Phillips C. Orthognathic surgery: a hierarchy of stability. Int J Adult Orthod Orthognath Surg. 1996;11:191–204. [PubMed] [Google Scholar]
- 3.De Clercq CA, Neyt LF, Mommaerts MY, Abeloos JV, De Mot BM. Condylar resorption in orthognathic surgery: a retrospective study. Int J Adult Orthod Orthognath Surg. 1994;9:233–40. [PubMed] [Google Scholar]
- 4.Harris MD, Van Sickels JE, Alder M. Factors influencing condylar position after the bilateral sagittal split osteotomy fixed with bicortical screws. J Oral Maxillofac Surg. 1999;57:650–5. doi: 10.1016/s0278-2391(99)90422-6. [DOI] [PubMed] [Google Scholar]
- 5.Becktor JP, Rebellato J, Becktor KB, Isaksson S, Vickers PD, Keller EE. Transverse displacement of the proximal segment after bilateral sagittal osteotomy. J Oral Maxillofac Surg. 2002;60:395–403. doi: 10.1053/joms.2002.31227. [DOI] [PubMed] [Google Scholar]
- 6.Baster M, Rosas A, O’Higgins P. Craniofacial levels and the morphological maturation of the human skull. J Anat. 2006;209:637–54. doi: 10.1111/j.1469-7580.2006.00644.x. [DOI] [PMC free article] [PubMed] [Google Scholar]
- 7.Cevidanes LH, Bailey LJ, Tucker GR, Jr, Styner MA, Mol A, Phillips CL, et al. Superimpositon of 3D cone-beam CT models of orthognathic surgery patients. Dentomaxillofac Radiol. 2005;34:369–75. doi: 10.1259/dmfr/17102411. [DOI] [PMC free article] [PubMed] [Google Scholar]
- 8.Cevidanes LH, Franco AA, Gerig G, Proffit WR, Slice DE, Enlow DH, et al. Assessment of mandibular growth and response to orthopedic treatment with 3-dimensional magnetic resonance images. Am J Orthod Dentofacial Orthop. 2005;128:16–26. doi: 10.1016/j.ajodo.2004.03.032. [DOI] [PubMed] [Google Scholar]
- 9.Cevidanes L, Bailey LJ, Tucker SF, Styner MA, Mol A, Phillips CL, et al. Three-dimensional cone-beam computed tomography for assessment of mandibular changes after orthognathic surgery. Am J Orthod Dentofacial Orthop. 2007;131:44–50. doi: 10.1016/j.ajodo.2005.03.029. [DOI] [PMC free article] [PubMed] [Google Scholar]
- 10.Cevidanes L, Oliveira A, Phillips C, Motta A, Styner M, Tyndall D. Three dimensional short-term mandibular displacements following Class III surgery [abstract 1827] J Dent Res. 2007;(Spec Iss A) [Google Scholar]
- 11.Grauer D, Cevidanes LHS, Phillips C, Mol A, Styner M, Proffit W. Assessment of maxillary surgery outcomes one year post-surgery [abstract 0813] J Dent Res. 2006;(Spec Iss A) [Google Scholar]
- 12.Lee B, Cevidanes LHS, Phillips C, Mol A, Styner M, Proffit W. 3D assessment of mandibular changes one year after orthognathic surgery [abstract 1610] J Dent Res. 2006;(Spec Iss A) [Google Scholar]
- 13.Yushkevich PA, Piven J, Hazlett HC, Smith RG, Ho S, Gee JC, et al. User guided 3D active contour segmentation of anatomical structures: significantly improved efficiency and reliability. Neuroimage. 2006;31:1116–28. doi: 10.1016/j.neuroimage.2006.01.015. [DOI] [PubMed] [Google Scholar]
- 14.Chapuis J, Schramm A, Pappas I, Hallermann W, Schwenzer-Zimmerer K, Langlotz F, et al. A new system for computer-aided preoperative planning and intraoperative navigation during corrective jaw surgery. IEEE Trans Inf Technol Biomed. 2007;11:274–87. doi: 10.1109/titb.2006.884372. [DOI] [PubMed] [Google Scholar]
- 15.Gerig G, Jomier M, Chakos M. In: Niessen W, Viergever M, editors. Valmet: A new validation tool for assessing and improving 3D object segmentation; MICCAI 2001: Proceedings of the International Society and Conference Series on Medical Image Computing and Computer-Assisted Intervention; 14–17 Oct 2001; Utrecht, Netherlands. Berlin: Springer; 2001. pp. 516–28. [Google Scholar]
- 16.Bookstein FL, Schafer K, Prossinger H, Seidler H, Fielder M, Stringer C, et al. Comparing frontal cranial profiles in archaic and modern homo by morphometric analysis. Anat Rec. 1999;257:217–24. doi: 10.1002/(SICI)1097-0185(19991215)257:6<217::AID-AR7>3.0.CO;2-W. [DOI] [PubMed] [Google Scholar]
- 17.Bookstein FL. Morphometric tools for landmark data. 1. Cambridge, Mass: Cambridge University Press; 1991. p. 435. [Google Scholar]
- 18.Baumrind S, Ben-Bassat Y, Bravo LA, Curry S, Korn EL. Partitioning the components of maxillary tooth displacement by the comparison of data from three cephalometric superimpositions. Angle Orthod. 1996;66:111–24. doi: 10.1043/0003-3219(1996)066<0111:PTCOMT>2.3.CO;2. [DOI] [PubMed] [Google Scholar]
- 19.Efstratiadis S, Baumrind S, Shofer F, Jacobsson-Hunt U, Laster L, Ghafari J. Evaluation of Class II treatment by cephalometric regional superimpositions versus conventional measurements. Am J Orthod Dentofacial Orthop. 2005;128:607–18. doi: 10.1016/j.ajodo.2004.06.036. [DOI] [PubMed] [Google Scholar]
- 20.Ghafari J, Baumrind S, Efstratiadis SS. Misinterpreting growth and treatment outcome from serial cephalographs. Clin Orthod Res. 1998;1:102–6. doi: 10.1111/ocr.1998.1.2.102. [DOI] [PubMed] [Google Scholar]
- 21.Cevidanes LH, Styner MA, Proffit WR. Image analysis and superimposition of 3-dimensional cone-beam computed tomography models. Am J Orthod Dentofacial Orthop. 2006;129:611–8. doi: 10.1016/j.ajodo.2005.12.008. [DOI] [PMC free article] [PubMed] [Google Scholar]
- 22.Bjork A, Skieller V. Normal and abnormal growth of the mandible. A systhesis of longitudinal cephalometric implant studies over a period of 25 years. Eur J Orthod. 1983;5:1–46. doi: 10.1093/ejo/5.1.1. [DOI] [PubMed] [Google Scholar]
- 23.Halazonetis DJ. Computer-assisted cephalometric analysis. Am J Orthod Dentofacial Orthop. 1994;105:517–21. doi: 10.1016/S0889-5406(06)80049-1. [DOI] [PubMed] [Google Scholar]
- 24.Johnston LE., Jr Balancing the books on orthodontic treatment: an integrated analysis of change. Br J Orthod. 1996;23:93–102. doi: 10.1179/bjo.23.2.93. [DOI] [PubMed] [Google Scholar]
- 25.Will LA, Joondeph DR, Hohl TH, West RA. Condylar position following mandibular advancement: its relationship to relapse. J Oral Maxillofac Surg. 1984;42:578–88. doi: 10.1016/0278-2391(84)90088-0. [DOI] [PubMed] [Google Scholar]
- 26.Hackney FL, Van Sickels JE, Nummikoski PV. Condylar displacement and temporomandibular joint dysfunction following bilateral sagittal split osteotomy and rigid fixation. J Oral Maxillofac Surg. 1989;47:223–7. doi: 10.1016/0278-2391(89)90221-8. [DOI] [PubMed] [Google Scholar]
- 27.Alder ME, Deahl ST, Matteson SR, Van Sickels JE, Tiner BD, Rugh JD. Short-term changes of condylar position after sagittal split osteotomy for mandibular advancement. Oral Surg Oral Med Oral Pathol Oral Radiol Endod. 1999;87:159–65. doi: 10.1016/s1079-2104(99)70266-0. [DOI] [PubMed] [Google Scholar]
- 28.Spitzer WJ, Steinhauser EW. Condylar position following ramus osteotomy and functional osteosynthesis: a clinical function analytic and computer tomographic study. Int J Oral Maxillofac Surg. 1987;16:257–61. doi: 10.1016/s0901-5027(87)80144-3. [DOI] [PubMed] [Google Scholar]
- 29.Schultes G, Gaggl A, Karcher H. Changes in the dimensions of milled mandibular models after mandibular sagittal split osteotomies. Br J Oral Maxillofac Surg. 1998;36:196–201. doi: 10.1016/s0266-4356(98)90497-1. [DOI] [PubMed] [Google Scholar]
- 30.Stroster TG, Pangrazio-Kulbersh V. Assessment of condylar position following bilateral sagittal split ramus osteotomy with wire fixation or rigid fixation. Int J Adult Orthod Orthognath Surg. 1994;9:55–63. [PubMed] [Google Scholar]
- 31.Proffit WR, Bailey LJ, Phillips C, Turvey TA. Long-term stability of surgical open-bite correction by Le Fort I osteotomy. Angle Orthod. 2000;70:112–7. doi: 10.1043/0003-3219(2000)070<0112:LTSOSO>2.0.CO;2. [DOI] [PubMed] [Google Scholar]
- 32.Ellis E., III Condylar positioning devices for orthognathic surgery: are they necessary? J Oral Maxillofac Surg. 1994;52:536–52. doi: 10.1016/0278-2391(94)90085-x. [DOI] [PubMed] [Google Scholar]
- 33.Proffit WR, Turvey TA, Phillips C. The hierarchy of stability and predictability in orthognathic surgery with rigid fixation: an update and extension. Head Face Med. 2007;3:21. doi: 10.1186/1746-160X-3-21. [DOI] [PMC free article] [PubMed] [Google Scholar]


