

Abstract
The present study examined the morphological development of the otolith vestibular receptors in quail. Here we describe epithelial growth, hair cell density, stereocilia polarization, and afferent nerve innervation during development. The otolith maculae epithelial areas increased exponentially throughout embryonic development reaching asymptotic values near post-hatch day P7. Increases in hair cell density were dependent upon macular location; striolar hair cells developed first followed by hair cells in extrastriola regions. Stereocilia polarization was initiated early, with defining reversal zones forming at E8. Less than half of all immature hair cells observed had non-polarized internal kinocilia with the remaining exhibiting planar polarity. Immunohistochemistry and neural tracing techniques were employed to examine the shape and location of the striolar regions. Initial innervation of the maculae was by small fibers with terminal growth cones at E6, followed by collateral branches with apparent bouton terminals at E8. Calyceal terminal formation began at E10, however no mature calyces were observed until E12, when all fibers appeared to be dimorphs. Calyx afferents innervating only type I hair cells did not develop until E14. Finally, the topographic organization of afferent macular innervation in the adult quail utricle was quantified. Calyx and dimorph afferents were primarily confined to the striolar regions, while bouton fibers were located in the extrastriola and type II band. Calyx fibers were the least complex, followed by dimorph units. Bouton fibers had large innervation fields, with arborous branches and many terminal boutons.
Keywords: Vestibular, motion detection, spatial orientation, gravity perception
INTRODUCTION
The vestibular otolith receptors have evolved to detect linear motion and head position with respect to gravity. These are essential functions, about which all coordinated and reflexive movements, as well as spatial orientation and navigation through space depend. However, little is known about otolith system development. Most studies have focused upon either stereocilia (Denman-Johnson and Forge 1999, Kido et al. 1993; Mbiene et al. 1984), otoconia formation (Blasiole et al. 2006; Dickman et al. 2004; Hughes et al. 2004; Kido et al. 1993), or the molecular genetics underlying macular formation and hair cell fate (Bever et al. 2003; Sienknecht and Fekete 2008; Oh et al. 1996; Shen et al. 2008). Here, we performed a comprehensive morphological examination of otolith receptor formation and maturation into adulthood. These studies were conducted in quail, a non-altricial species, where a rapid embryogenesis (16 days incubation) of a functional vestibular system must occur so that upon hatching, regulation of posture, gaze, and spatial orientation is intact.
Otolith receptors in amniotes contain two types of hair cells and three afferent types with distinct morphological innervation patterns. Type I hair cells are innervated by an enclosing calyceal terminal while type II hair cells are innervated by bouton terminals (Wersäll, 1956). The different hair cell types are not heterogeneous throughout the maculae, but instead exhibit regional distributions that have been characterized in mammals (Desai et al., 2005; Fernandez et al., 1990; Lysakowski and Goldberg, 2008), amphibians (Baird and Schuff 1994), reptiles (Xue and Peterson 2006; Severinsen et al., 2003) and birds (Jørgensen and Anderson 1973; Rosenhall 1970; Si et al., 2003; Zakir et al., 2003). In birds, a type I hair cell rich zone lies within a unique area, termed the “striola” (Werner, 1933), which also differs in receptor cell density and otoconia formation (Jörgensen and Andersen, 1973; Rosenhall, 1970; Si et al., 2003; Zakir et al., 2003). Outside the striola, lies the extrastriola, which is populated primarily by type II hair cells in birds. Currently, little information exists regarding how the two cell types become regionally distributed during development.
Each hair cell contains a bundle of stereocilia and a lone kinocilium. The eccentric position of the kinocilium defines a morphological polarization (Wersäll, 1956; Wersäll et al., 1965) that also determines the cellular response amplitude and spatial tuning (Hudspeth and Corey 1977; Shotwell et al. 1981). Across the epithelium, hair cell polarizations are topographically organized, with an imaginary line running through the epithelium about which stereocilia are oppositely directed (Jörgensen and Andersen, 1973; Rosenhall, 1970; Si et al., 2003; Zakir et al., 2003). The mechanisms responsible for morphological polarization (also termed planar cell polarity) have been well studied, particularly in auditory hair cells (Dabdoub and Kelley, 2005; Davies et al., 2005; Denman-Johnson and Forge, 1999). However, questions remain as to how the broader organization of the topographic map in the otolith organs is developed.
The primary afferents that innervate the otolith receptors have been known to differ in their morphology since early anatomists first described them over a century ago (Retzius, 1884; Cajal, 1908; 1909; Lorente de Nó, 1926). Macular innervation has been thoroughly examined only in chinchillas and pigeons, where three fiber classes were identified (Fernández et al., 1990; Si et al., 2003; Zakir et al., 2003). Calyx afferents contain only calyceal terminals to innervate type I hair cells. Bouton afferents contain en passant and boutons terminaux to innervate only type II hair cells. Dimorph afferents innervate both type I and II hair cells, with calyceal and bouton terminals. These three afferent types also exhibit specific regional distributions. In pigeons, calyx and dimorph afferents are exclusive to the striola region in the utricular macula but are spread wider into the extrastriola epithelium in the saccule (Si et al., 2003; Zakir et al., 2003). In contrast, bouton afferents are exclusively located in the extrastriola regions and a unique band of type II cells that flanks the reversal line of the utricle. Less is known regarding the development of macular afferent innervation. Fink and Morest (1977) reported that bouton afferents develop in chicks before calyceal bearing afferents, but their study did not address the formation of regional differences in macular innervation.
The present study sought to provide insights regarding otolith receptor formation throughout development in quail. Here, we focused on hair cell distribution, stereocilia polarization, and afferent nerve innervation of the otolith maculae. Combined with our earlier work on otoconia (Dickman et al., 2004), we sought to provide further understanding of the morphological organization of these receptors.
METHODS
Animals
All experiments were conducted in Japanese quail (Coturnix japonica). Otolith organ tissues were collected and analyzed at ten time points during embryonic development (E6-15; hatch on day 16), as well as at three post-hatch (P) developmental times including P1, P7 and adult (8 weeks post-hatch). Newborn and adult quail were either sacrificed with CO2 (SEM, immunohistochemistry) or perfused through the heart with aldehyde fixatives (neural tracers), while embryonic quail were sacrificed with cold narcosis. The head was bisected, the brain removed, and the utricle and saccule otolith organs dissected free from the temporal bone. The experimental protocols were approved by the Institutional Animal Care and Usage Committee at Washington University and conformed to guidelines established by the National Institutes of Health regarding animal use.
Macular growth curves
Fresh tissue whole mounts of utricles and saccules were placed in 9:1 glycerol:PBS on a glass slide and coverslipped. The peripheral margins of the utricular and saccular sensory epithelia were traced using video microscopy and the planimeter feature in the anatomical reconstruction program (Neurolucida, MBF Biosciences, Williston VT).
Scanning Electron Microscopy
Receptor tissues used for scanning electron microscopy (SEM) were placed into 0.1M cacodylate buffered saline (CBS). The otoconia and otolith membrane were removed, and the maculae placed into in a 3% glutaraldehyde, 2% paraformaldehyde fixative solution in CBS for 16 hours at 4°C. Tissues were rinsed, then dehydrated in a graded series of acetones and dried in 100% tetramethylsilane. The sublimated tissue was mounted on aluminum studs, coated with palladium, and viewed with a Hitachi 2600 SEM microscope at 20kV (for details, see Huss and Dickman, 2003).
Hair cell planar polarity and density
SEM micrographs of the otolith maculae were used to obtain a set of serial images across the central macular epithelia (lateral to medial – utricle; superior to inferior – saccule). Images for E6-E10 maculae were taken at 9000×, while images of E12-adult maculae were taken at 5000x. The micrographs for each macula were reconstructed as a montage and the planar polarity for each hair cell in the view was measured. For better visualization of stereocilia bundles (see Fig. 3B), some maculae were sonicated to shear the bundles from the apical surface of the cell (Corwin, 1977). Each cell’s polarization was determined by drawing a vector from the shortest stereocilia to the kinocilium (Denman-Johnson and Forge, 1999). The vector angle was measured using a compass rosette overlaid on the receptor epithelium (see Fig. 3A). In the utricular macula, the anterior pole was designated as 0°, the medial edge direction was designated as 90°, and the lateral edge as 270°. For saccular maculae, the superior edge was set at 90°, the inferior edge was oriented to 270°. Normalized distances were measured with the lateral edge (utricles) or superior edge (saccules) of the epithelium = 0μm. In addition, the polarization of cells across the entire macular surface was mapped. First, SEM images (5000x) were serially obtained across the epithelial surface. Arrows were drawn on the surface outline indicating the planar polarity of cells within each of the immediate high magnification views, until the entire epithelium was mapped.
Figure 3.

The SEM montages were also used to count the number of immature hair cells across the sensory epithelium. Hair cells were classified as immature when: 1) stereocilia length was shorter or equal to the supporting cell microvilli, 2) lack of, or small, area free of microvilli around the stereocilia bundle on the apical surface of the hair cell and 3) stereocilia length being equal to the kinocilium length. The location of the kinocilia within the immature hair cell bundles were designated as either internal or external. Internal kinocilia appeared within the stereocilia bundle (centered or eccentric), while external kinocilia appeared at the outer edge of the bundle.
In order to measure hair cell density, stereocilia bundles were counted from SEM images (×1200) taken at two different macular locations, including the striolar and extrastriolar regions (central epithelium from anterior – posterior). For all maculae, the counting frame regions were 2,500μm2. Age dependent shrinkage factors were applied to adjust the actual surface area counted.
Immunohistochemistry
Tissues used for whole mount immunohistochemistry were placed in 4% paraformaldehyde in 0.1M phosphate buffered saline (PBS). Some maculae were sectioned, others prepared for whole mount imaging. For sectioning, tissues were cryoprotected in 30% sucrose, embedded in OCT medium, and frozen in isopentane. Sections (10μm) were cut, mounted on slides, and stored at −80 °C. Next, endogenous peroxidases were blocked for 30 minutes in 1% hydrogen peroxide in 90% methanol. Whole mount utricles and saccules were permeabilized in 2% Triton X-100 in PBS for 2 hours. Tissue sections and whole endorgans were then blocked with 1% BSA, 0.2% Triton X-100 and 2% normal goat serum in PBS. Afferent nerve endings were labeled with a mouse monoclonal antibody against class III β-tubulin (Tuj1, Covance, Denver, PA; Lee et al., 1990). Type I hair cells were labeled with a polyclonal antibody raised against purified chicken brain tenascin (Chemicon, Temecula, CA; AB19013). Tenascin immunoreactivity was eliminated by cross-reaction with purified tenascin-C (Chemicon, CC115). All primary antibodies were used at a dilution of 1:1000. When the final chromagen was DAB, the tissue was incubated in ABC solution (Vector Elite ABC kit) and reacted in DAB solution (see below).
Apoptosis
Utricles and saccules were dissected and fixed as described above. Endogenous peroxidases were blocked for 30 minutes in 1% hydrogen peroxide in 90% methanol. Tissues were permeabilized in 2% Triton X-100 in PBS. Apoptotic cells were labeled with the TUNEL method using the In Situ Cell Death Detection Kit (Roche, Branford CT). The tissue was incubated in the terminal deoxynucleotidyl transferase enzyme solution for 16 hours, then rinsed. Non-specific tissue sites were blocked with 1% BSA, 1% Triton X-100 and 2% normal sheep serum in PBS. The tissue was then incubated in peroxidase linked anti-fluorescein antibody for 16 hours at 4°C. DAB labeling was carried out as described above. The endorgans were mounted on glass slides, coverslipped and viewed on a Nikon E-600 light microscope. Darkly stained hair cell nuclei were counted across the entire sensory epithelium, at a focal plane near the apical epithelial surface in at least four endorgans per age group. Only hair cell nuclei are located in the upper levels of the epithelium (Desai et al., 2005; Rüsch et al., 1998; Si et al., 2003), with support cell nuclei restricted to a thin layer deep in the epithelium adjacent to the stroma.
Retrograde neural tracers
Two different neural tracing methods were utilized. For embryos and P1 quails, horseradish peroxidase (HRP) was applied to the cut vestibular nerve just medial to Scarpa’s ganglion and a pellet of recrystallized HRP (Sigma, Type VI) was applied to the nerve end. Next, a small opening was made in the cartilaginous temporal bone near the utricle to expose the vestibular sensory tissue to medium. The half head was incubated in oxygenated Medium 199 (Invitrogen) for 4 hours at 20°C to allow for HRP transport. The maculae were then fixed in 2.5% glutaraldehyde and permeabilized in 2% triton X-100 in 0.1M Tris buffer, for 16 hours at 4°C. Endogenous peroxidases were blocked with 1% hydrogen peroxide in 90% methanol. Next, the HRP enzyme was visualized using 0.5mg/ml DAB, 0.05% hydrogen peroxide and 0.005% nickel cobalt in PBS. The tissue was dehydrated in a graded series of ethanols, cleared in propylene oxide and embedded in Durcupan (EM Sciences, Hatfield PA). Sections were cut (10μm), mounted on slides, stained with Richardson’s solution (1960), and coverslipped.
For adult tissues, better morphological detail was achieved with the use of biotinylated dextran amine (BDA, 10K MW, Molecular Probes, Invitrogen, Carlsbad CA) as a neural tracer. Four adult quail were anesthetized with isoflurane and BDA was ionophoretically injected into the vestibular nuclei. After a seven day survival period, the animals were euthanized and an intralabyrinthine perfusion of 3% glutaraldehyde, 2% paraformaldehyde and 1% acrolein in CBS was performed. The maculae were dissected free, the otoconia and otolith membrane were removed. Endogenous peroxidases were blocked as described previously and the tissue was incubated in 10μg/ml of avidin-HRP (Vector Labs, Burlingame CA) in 0.3% Triton X-100 in PBS. The reaction was initiated using DAB as described above. The tissues were then dehydrated, embedded in Durcupan and serially sectioned at 10μm.
Afferent reconstruction
Afferent reconstructions were performed on fibers innervating the four adult utricular macula that had been labeled with BDA. Detailed methodology for afferent reconstructions can be found in our previous studies (Si et al., 2003; Zakir et al., 2003). Briefly, all utricular reconstructed terminal morphologies were taken from serial sections (10μm) through the macula (animals with efferent somas labeled were excluded). For each section, a contour of the epithelial surface was drawn using video microscopy (Nikon E600, 60x oil) and a 3D image analysis reconstruction program. Next, a 3D map of the epithelial surface was plotted using the traced contours. Each reconstructed afferent was characterized as to terminal type and the measured locations within the epithelium were noted. For each traced afferent, a number of morphological parameters were quantified, including: axon diameter, number of fiber branches, branch order, total fiber length, fiber volume, innervation area, number of type I hair cells/calyceal terminal, calyceal volume, and number of bouton terminals/fiber (for details, see: Si et al, 2003; Zakir et al., 2003).
Statistical analyses
All statistical comparisons were performed using analyses of variance (ANOVA) with commercial software (Statistica; Statsoft, Tulsa OK). All post hoc comparisons were made using the Sheffé follow-up test. Proportional relationships were investigated using Pearson product-moment correlations.
RESULTS
Growth of the sensory epithelium
The total areas of the utricular and saccular receptor epithelia were measured (n = 3 - 16 maculae) for each developmental day from E6–E15, P0 (hatch), and for post-hatch days P1 (24 hours post-hatch), P7, and P48 (adult). Initially, both the utricular and saccular maculae increased in area at about the same rate during early embryonic development, as shown in Figure 1A. Little growth occurred between days E6 and E7, however both maculae doubled in size between E7 and E8. Continued grow was observed at an accelerated rate through hatching at E16. During embryogenesis, there were a few days where no growth occurred, such as E12 and E14. Different growth rates were observed for the two otolith organs, with an overall larger receptor epithelium growing faster for the utricle as compared to the saccule. After hatching, the saccular macula underwent almost no growth, while the utricular macula continued to increase in size until reaching asymptotic levels by P7. The rates of growth for both the utricular and saccular maculae followed a sigmoidal function (Fig. 1A), with significantly different slopes (1.8 – utricle; 1.3 - saccule). By adulthood, the mean utricular area of 96.8 × 104μm2 (±8 × 104μm2, n = 9) was nearly double that of the saccule (45.0 × 104μm2 ±2.7 × 104μm2, n=10) (F(1,17) = 391.2, p<0.001).
Figure 1.

Hair cell density
Stereocilia bundles were quantified from counting frames taken at similar locations across the receptor epithelium (see Methods). Four utricular and four saccular maculae were each examined at E6 - E15, P7 and P42 (adult) developmental days. As shown in Figure 1B, initially the mean hair cell densities in the striolar regions of both maculae exhibited significantly faster maturation rates as compared to extrastriolar regions (Utricle - E6: F(1,4) 7.9, p<0.05; E8: F(1,6) = 39.2, p<0.001; and E10: F(1,6) = 37.2, p<0.001; Saccule - E6 (F(1,6) = 353.6, p<0.001), E8 (F(1,6) = 41.1, p<0.001) and E10 (F(1,6) = 6.8, p<0.05). Later in development, hair cell density actually decreased from E8 to E10; likely due to the rapid growth in size of the epithelium (Fig. 1A). From E12 until adulthood, the extrastriolar regions exhibited increased hair cell densities that remained fairly constant during post-hatch development (Fig. 1B).
These differences in regional density can be attributed to two factors. First, the macula forms initially around the striolar region and expands outward, with increased growth through the extrastriola region as the epithelia matures. Second, in adult quail, type I hair cells are primarily located in the striolar region and these hair cells have a much larger apical size than type II hair cells. Type II hair cells are located throughout the macula, but are the only hair cell type found in the extrastriola region.
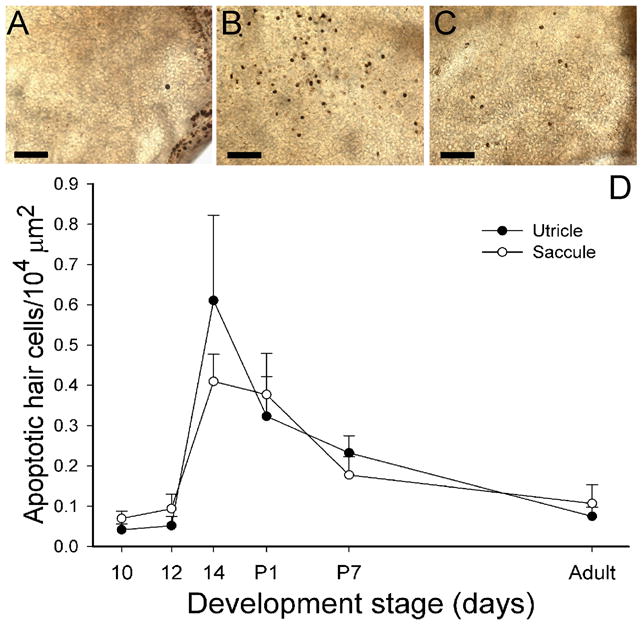
Programmed cell death
Often in neural development, cellular proliferation is accompanied by programmed cell death. The number of apoptotic cells (dark stain) was counted across the entire utricular and saccular maculae at different developmental stages (normalized for epithelial size), as illustrated in Figure 2. Few apoptotic cells were observed during early embryogenesis (Fig. 2A, D). However at E14 (Fig. 2B, D) a significant increase in programmed cell death was observed for both the utricle (F(1,16) = 14.2, p<0.01) and saccule (F(1, 10) = 20.0, p<0.01). Thereafter, the density of apoptotic hair cells decreased steadily through adulthood (Fig. 2C, D). Apoptotic cells were more concentrated in the striolar regions of the maculae and appeared coincident with the development of type I hair cells (see below).
Figure 2.
Hair cell planar polarity
In order to examine the formation of stereocilia planar polarity, the morphological polarizations of hair cells were quantified at different developmental stages. As shown in Figure 3A for one E8 utricle, a 50μm wide counting frame was first indexed across the central macular surface (dorsal to ventral – saccule; medial to lateral – utricle). Next, orientation vectors were drawn for each hair cell (Fig. 3B, adult utricle) within the counting frame and vector angles measured (Fig. 3A). Angles from all hair cells in the counting frames from two maculae each from E6 - E8, E10, E12, E15, P7 and adult developmental days were determined, then plotted as a function of normalized distance, as shown in Figure 4. To quantify these formation patterns, linear regression analyses were performed for cell orientations with normalized distance values between 0.3 and 0.8 (central macula), with the variance being used as a measure of polarity maturation.
Figure 4.

In early development, stereocilia bundles in the otolith maculae exhibited substantial variation in morphological polarization. For example, at E6 orientation angles were widely distributed (regression r2 values of 0.15), with neighboring cells having polarities that could differ by as much as 180 degrees (Fig. 4A, E). Most utricular hair cells located in the lateral portion of the macula (distance values near 0.0) were initially oriented toward the anterior (0o, or 360o) to lateral (270o) edges of the macula. An incremental change in bundle orientation from anterior to lateral to posterior (Fig 4A) (increase in normalized distance) was observed for cells located in the lateral-to-medial dimension of the utricular macula. Further, at E6 a few cells in the lateral utricular macula had reversed their orientation to be directed toward the medial edge (90° angles), thus marking the initiation of the reversal zone. Similar orientations were observed for the E6 saccular macula (Fig. 4E). By E7 however, hair cells were beginning to orient themselves in a pattern that approximated that of the adult (regression variance of r2 = 0.49; Fig. 4B). As shown in Figures 3C & E, a reversal line of opposing hair cell polarity ran along the lateral and anterior edges of the adult utricular macula. However, on the medial edge, hair cells were directed in an anti-parallel organization. This pattern was reflected in the polarization angle plots of Figure 4D, where the opposing reversal line was observed at a normalized distance of 0.2 and the anti-parallel zone at a distance of 0.9. By E8, the utricular polarizations were equal to that of the adult. In the saccular macula, the maturation was delayed compared to the utricle. First, in the adult saccule, a single C-shaped reversal line was observed, as shown in Figures 3D & F. The saccular counting frame bisected the reversal line at normalized distances of approximately 0.25 and 0.8 in the adult (Fig. 4H). At E7 (Fig. 4F), saccular hair cells in these zones were beginning to exhibit bundle orientations more similar to the mature patterns, with even less variation observed at E8 (r2 = 0.90). By E10 (r2 = 0.92), the polarization angles for utricular hair cells were not different from that observed in the adult (r2 = 0.94, Fig. 4D). In the saccular macula, a final mature pattern (r2 = 0.94; Fig. 4H) was not complete until E12 (r2 = 0.93).
Stereocilia bundle orientations were also used to determine the topographic polarization distribution in the adult quail maculae. As shown in Figures 3E and F, a complex pattern of hair cell planar polarities was observed. In the lateral and anterior utricular macula, orientation vectors were inwardly directed toward an opposing reversal line (dotted, Fig. 3C, E). However, in the medial extrastriolar region, orientation vectors were directed in an anti-parallel fashion along a second reversal line (dashed lines, Fig. 3C, E). In the saccular macula, opposing reversals were directed away from the reversal line throughout the epithelium, except for a small area in the inferior portion of the saccule where cells exhibited obtuse angles (Fig. 3D, F). In addition, in the striolar regions of both maculae, hair cells exhibited bundles with numerous short stereocilia (Fig. 3G), while in the extrastriolar regions bundles contained fewer, but longer, stereocilia (Fig. 3H).
Striola formation
Vertebrate maculae have a specialized region termed the striola. Recently, Moravec and Peterson (2004) observed that type I hair cells in turtles could be distinguished by their stereocilia bundles, having significantly more numerous and shorter cilia than type II hair cells. Although quantitative analyses of stereocilia formation and confirmation of cell type were outside the scope of the present investigation, we none-the-less applied a similar metric to adult quail in an attempt to differentiate type I and type II hair cell location across the macular surfaces. Surprisingly, a fairly distinct border between zones containing putative type I hair cells (short stereocilia, Fig. 3G) and zones containing only putative type II hair cells (long stereocilia, Fig. 3H) was observed. As shown in Figures 3C and 3D, the striolar regions (solid white lines) were regionally restricted and could be characterized as the primary zones that contained putative type I cells. Mixed in with these type I hair cells, were cells with longer and fewer stereocilia (putative type II cells), although much less numerous. In contrast, extrastriola regions contained only putative type II hair cells. These demarcations were next applied to embryonic maculae in order to determine at what point in development the striolar regions becomes defined. We observed that the first striolar margins formed at E10. The stereocilia bundles of most hair cells in E10 and younger embryos appeared similar to those of putative type II cells and varied little across the sensory epithelia, including areas that would later develop into the striolar region. As described in more detail below, it appears that before E10 – E12, no mature type I hair cell phenotype is present in the maculae. However, after E12, type I hair cells developed to populate the striolar regions and the regional differences in stereocilia bundle morphology became more defined.
Stereocilia bundle formation
As shown in Figure 5 (E8 utricle), immature hair cells could be identified by unique stereocilia bundle characteristics. These included a short kinocilium, short stereocilia of nearly equal length, and the lack of a clear zone free of support cell microvilli around the hair cell bundle. In addition, the location of the kinocilium within the bundle varied and could be either internal (Fig. 5A, B) or external (Fig. 5C) to the other stereocilia. Fig. 5A shows an immature hair cell with a kinocilium located at the center of the stereocilia bundle. Denman-Johnson and Forge (1999) described similar bundle morphologies as “enfant cells” in embryonic mice. Fig. 5B shows another immature hair cell type with its kinocilium located asymmetrically, but still within, the stereocilia bundle. Still other immature hair cells exhibited external kinocilia eccentric to the stereocilia bundle, as is universally true for mature hair cells. All three immature cells (Fig. 5A, B, C) had equivalent diameter bundles (~1μm), suggesting that they were of a similar level of development. Although a quantitative analysis was not performed, as a comparison mature hair cells across the epithelium generally exhibited apical diameters ranging between 4 - 9μm. It was observed that neighboring cells in the receptor epithelium were often at different stages of development. As shown in Fig. 5D, immature (arrow), intermediate (lower center) and mature (upper right) stereocilia formations were all observed in close proximity.
Figure 5.

These immature bundle characteristics were used to quantify cell maturation throughout development. In E5 quail, the sensory epithelia were thickly covered with microvilli and a few small, poorly defined stereocilia bundles were observed (data not shown). However, at E6, distinct stereocilia bundles could be identified, with most of the utricular (88%) and all of the saccular (100%) hair cells exhibiting immature stereocilia bundles. Of these (n = 400), slightly less than half (45%, n = 167) had internal kinocilia while the rest exhibited external kinocilia (Figure 5F). By E7, the number of immature hair cells had declined to approximately half of the total population (n=335) and to less than 20% (total n = 1144) by E8 (Fig. 5E). Of these immature bundles, nearly one third had internal kinocilia while the remaining ones were external. As embryonic development continued from E10 - hatching, most cells had mature bundle configurations. Only 6 - 12% out of 1382 cells counted were immature, with fewer kinocilia being internal (Fig. 5E-F). By adulthood, less than 1% of all observable hair bundles (n = 1432) were considered to be immature. The maturation of hair cells followed an exponential time course for both maculae (Fig. 5E). Consequently, as the number of immature hair cells decreased, the percentage of cells with external kinocilia increased (Fig. 5F). In terms of epithelial location, during early embryogenesis most immature bundles were found in the future striolar region (normalized distance 0.2 – 0.5), as shown for the utricular macula in Figure 5F. This region corresponds to that exhibiting the largest increase in cell proliferation (Fig 1B). By E10 however, most immature bundles were located in the extrastriolar regions of both maculae (Fig. 5G).
Afferent innervation during development
In order to examine the development of afferent innervations and cellular differentiation, neural tracers and immunohistochemistry markers were utilized. Macular afferents were examined in at least four animals for each developmental time point between E6 – E15, P7 and adult. In addition to neural tracers, nerve fibers and calyx afferent terminals were labeled with an antibody against class III β-tubulin (Tuj1). Tuj1 is a neuron specific marker that has been well characterized for visualization properties in vestibular tissue (Perry et al., 2003; Molea et al., 1999). As shown in Figure 6, afferent innervation of the vestibular sensory epithelia began early, coincident with the receptor hair cell differentiation. At E6, a number of small nerve fibers had penetrated the receptor epithelium (Fig. 6A – C). Most of these early developing fibers were characterized by either elongated (Fig. 6A) or elliptical (Fig. 6B) growth cones that coursed toward the apical epithelial surface with few branch points or arborizations. These growing fibers appeared to be targeting differentiated receptor cells at the apical portions of the epithelium. By E8, nerve fibers demonstrated terminal swellings on or near developing hair cells (Fig. 6D-E) with more numerous arborizations (Fig. 6F). At E10, cup-shaped proto-calyceal terminals were first observed to be forming around the basolateral area of some hair cells (Fig. 6G-I). By E12, calyceal terminals were observed that encapsulated many presumptive type I hair cells, while others continued to form (Fig. 6J-L). Most of these fibers contained both calyceal terminals and additional branches with bouton terminals or growth cones, indicative of dimorph type afferents. In whole mount preparations viewed from the apical surface, the striolar region was identifiable from large clusters of calyceal terminals. These calyces were formed into discrete structures surrounding one or several presumptive type I hair cells (Fig. 6L). At E14, a number of mature calyceal terminals were observed, with endings that fully enveloped hair cells up to their apical surface (Fig. 6M - N). Many of these calyceal terminals enveloped multiple type I hair cells and had no observable branch fibers. Thus, at this point in development, true calyx fibers were first observed in abundance. In addition, at E14, the 4 - 6 cell wide type II band, devoid of type I cells, had formed and encompassed the reversal line in the striola (Fig. 6O).
Figure 6.

Type I hair cell and striolar localization in adult maculae
It is known that calyceal terminals exclusively localize type I hair cells in the adult vestibular sensory epithelium. However their absence during development does not preclude type I cell formation (Rüsch et al., 1998). Thus, a more specific type I hair cell marker was also sought. Based upon previous reports that suggested that the extracellular matrix glycoprotein tenascin could be exclusively expressed in type I hair cells (Swartz and Santi, 1999; Warchol and Speck, 2007), we used a tenascin antibody in an attempt to identify the formation of type I hair cells in embryonic and adult maculae. First, the localization of tenascin in type I hair cells was examined in adult quail maculae by double labeling with both β-tubulin (green) and tenascin (red) antibodies, as shown in Figure 7 of an adult utricle. β-tubulin was expressed throughout the calyceal terminal and in portions of the afferent fibers (Fig. 7A). Tenascin, in contrast, was expressed in the outer portion of the type I hair cell membrane, forming distinct rings when viewed from the surface at different focal planes (Fig. 7B). When merged (Fig. 7C), the tenascin expression was confined within the larger calyceal structures, suggesting again that tenascin is located in hair cell specific proteins and not in the innervating calyceal terminal. In Figure 7D - F, a single image from the lateral region of a sectioned P7 utricle has been double labeled. Here, calyceal terminals were clearly labeled with β-tubulin, while the tenascin expression was observed in the hair cell outer membrane, the basement membrane, and punctate label in innervating afferent fibers of the sensory epithelium (Fig. 7E). We next examined tenascin expression in embryonic maculae and found that labeling of any sort (except the basement membrane) was extremely weak in early embryos (E6 – E8). In later stage embryonic maculae (E10 – E12), tenascin could only be found in punctate formations in hair cells. However, by E14, tenascin expression was observed to be similar to that shown for P7 and adult maculae.
Figure 7.

Afferent innervation patterns in adult maculae
As shown in Figure 8, three distinct fiber types including calyx (Fig. 8A), dimorph (Fig. 8B), and bouton (Fig. 8C) innervation patterns were all observed in quail. From the traced fibers, 3D anatomical reconstructions for 69 individual afferent fibers (20 calyx, 23 dimorph, and 26 bouton) were performed (Fig. 8D-F). The locations of all afferents that were quantified through anatomical reconstructions are shown in Figure 8G, where a regional topography of afferent types was observed. Calyx afferents were confined to the striolar region, as were most of the dimorph afferents. A very few dimorph fibers were also located in the extrastriola (one reconstructed, several others noted but not reconstructed). All bouton afferents were either located in the extrastriola, or in the narrow type II band that flanked the reversal line. Bouton afferents innervating the type II band did not exhibit branching patterns that crossed the reversal line, so that only hair cells of similar morphological polarity were innervated.
Figure 8.

Morphometric parameters from the three different classes of afferents were compared, with mean values and ranges listed in Table 1. For calyx afferents, a single large parent axon (average diameter of 3.0μm (SD±0.7) entered the neuroepithelium, then generally ended with a single calyceal terminal that innervated several hair cells. Although the number of hair cells ranged between 1 -8, most calyceal terminals contained 3 - 5 type I hair cells, with a mean value of 4.2 (SD±1.8). Correspondingly, the calyceal terminals for calyx afferents were large, occupying an average 294.9μm2 (SD±122.9) of area in the striolar epithelium. By comparison, the calyx fibers exhibited the simplest arborization patterns of all afferents (Table 1).
Table 1.
Morphometrics and statistical comparisons for adult utricular afferents
| Comparison | Calyx | Mean - Range | Bouton | Main Effect | Scheffé Post Hoc | ||
|---|---|---|---|---|---|---|---|
| Dimorph | Value | Cal vs Dim | Cal vs Bout | Dim vs Bout | |||
| Axon diameter | 3.0 (0.7) | 2.4 (0.6) | 2.0 (0.5) | F(2, 66)=16.1 | p<0.005 | p<0.001 | p=0.08 |
| 1.8 – 4.0 | 1.0 – 3.2 | 0.8 – 2.9 | |||||
| Branches | 1.2 (0.4) | 14.7 (9.7) | 29.2 (15.9) | F (2,66)=35.5 | p <0.001 | p <0.001 | P <0.001 |
| 1 – 2 | 3 – 41 | 5 – 63 | |||||
| Branch order | 1.3 (0.4) | 5.3 (1.9) | 7.3 (2.7) | F (2,66)=53.1 | p <0.001 | p <0.001 | p <0.005 |
| 1 – 2 | 2 – 10 | 3 – 12 | |||||
| Fiber length | 44.0 (15.2) | 150.9 (72.9) | 270.1 (147.8) | F(2,66)=28.9 | p<0.005 | p <0.001 | p <0.001 |
| 24.8 – 86.7 | 40.6 – 309.6 | 84.0 – 573.4 | |||||
| Fiber volume | 349.5 (185.3) | 360.6 (182.6) | 357.2 (232.9) | F (2,66)=0.17 | p=.98 | p=.99 | p=.99 |
| 57 – 779 | 148 – 824 | 54 – 1075 | |||||
| Innervation area | 294.9 (122.9) | 449.5 (139.8) | 627.3 (235.2) | F (2,66)=23.9 | p<0.005 | p<0.001 | p<0.005 |
| 135 – 478 | 179 – 711 | 174 – 1042 | |||||
| Type I HC | 4.2 (1.8) | 2.1 (1.2) | — | F (1,41)=18.8 | p<0.01* | — | — |
| 1 – 8 | 1 – 6 | ||||||
| Calyceal volume | 2911 (1611) | 1795 (1251) | — | F(1,41)=8.3 | p<0.01* | — | — |
| 792 – 6056 | 197 – 4083 | ||||||
| Boutons | — | 16.8 (11.6) | 35.3 (18.0) | F (1,47)=17.9 | — | — | p <0.001* |
| 1 – 46 | 5 – 62 | ||||||
Mean (SD) = standard deviation;
denote one-way ANOVA only.
Dimorph afferents contained both calyceal and bouton terminals that innervated type I and type II hair cells (Fig. 8B, E). Most (95%) of the observed dimorph afferents were located in the striolar region, intermixed with the calyx afferents. A few dimorph afferents also had terminal branch fields that innervated the type II band and the striolar region (Fig. 8G). Dimorph axon diameters were significantly smaller than the calyx afferents (Table 1), varying between 1.0 – 3.2 μm with a mean value of 2.4μm (SD±0.6). Simple dimorph afferents contained a single branch off the parent axon, while the most complex afferent quantified contained 41 branch fibers (out to the 10th order). The mean number of branches for the dimorph afferents was 14.7 (SD±9.7), which was significantly higher than calyx afferents (Table 1). Dimorph calyceal terminals contained significantly fewer type I hair cells than calyx units (Table 1), with a mean of 2.1 (SD±1.2) cells/calyceal terminal. For innervation of type II cells, simple dimorph afferents could have a single branch with only one bouton terminal, or they could be complex with many branches (maximum = 41) and multiple bouton terminals (maximum = 46). Thus, dimorph innervation areas were significantly larger than those of calyx afferents, with a mean value of 449.5μm2 (SD±139.8). Due to the longer parent axons and the more extensive arborization patterns of dimorphs, the mean fiber length of 150.9μm (SD ±72.9) was significantly larger than that of only 44μm (SD±15.2) for calyx afferents (Table 1). However, due to the smaller diameter of the dimorph fibers as compared to calyx units, there was no difference in overall fiber volume. The terminal field areas for the dimorph afferents were significantly larger than calyx afferents, with areas ranging between 179 μm2 for simple fibers to 711μm2 for the most complex afferent profiles.
Bouton afferents were characterized by en passant and bouton terminals that exclusively terminated upon type II hair cells. Bouton afferent diameters were significantly smaller than those of the calyx afferents, with a mean value of 2.0μm; but were only marginally smaller than dimorph afferents (Table 1). After entering the neuroepithelium, bouton afferents varied greatly in the size and complexity of their arborization patterns. The simplest afferent quantified contained only five branch fibers and an equal number of bouton terminals, while the most complex afferent had 63 branches out to the 12th order. With a mean number of 29.2 (SD±15.9) branches per fiber, the bouton afferents were significantly more arborous than either the dimorph or calyx afferents (Table 1). The mean fiber length of 270.1μm (SD±147.8) for the bouton afferents was significantly larger than both of the two other classes of fibers. Extensive branching was also correlated with increased terminals, where the mean number of boutons (35.3) was more than twice that observed for the dimorph afferents, a significant finding (Table 1). For bouton afferents, the innervation areas had a mean value of 627.3μm2 that was significantly larger than that for either the calyx or dimorph afferents (Table 1).
DISCUSSION
Our findings represent a comprehensive study of the development of the vestibular otolith receptors in birds. We addressed three primary questions. First, how do the specific regional distributions of type I and II hair cells develop across the epithelium? We observed that type II hair cells develop first, followed later by the appearance of type I hair cells. This was true even in macular regions that would later be densely populated by type I hair cells. Second, how do the directional polarization maps develop? We observed that planar cell polarity patterns migrate through several days of embryogenesis to reach an adult topographic form. Third, how do the three afferent types develop into regional distributions across the macula? We found that bouton afferents develop first. Calyceal terminals form later on dimorph afferents and true calyx afferents do not appear until the last stage of development. At maturity, we found the regional distribution of calyx, dimorph and bouton afferent terminals in the adult quail utricle to be similar to that reported for pigeons.
Macular growth and hair cell development
Similar to growth rates reported for chicks, quail macular areas develop at an exponential rate, with near completion by the first post-hatch week (Goodyear et al., 1999; Kido et al., 1993). Hair cell formation in quail also followed a similar trajectory as reported for chicks (Goodyear et al., 1999; Roberson et al., 1992; Jørgensen and Mathiesen, 1988), where the early hair cell growth occurred in the striolar regions followed by the extrastriola. In the striolar regions, a high concentration of type I hair cells was found, leading to decreased densities due to larger cell size. Coupled to the proliferation of hair cells, programmed cell death was initiated late in development, but declined to low finite values after hatching that continued into adulthood; similar to the 1% apoptotic turnover rates reported for chicks by Kil et al. (1997).
Stereocilia development and polarization
Morphological polarization of hair cells is important, since stereocilia displacement determines the directional sensitivity of the hair cell (Hudspeth and Corey, 1977) and provides the basis for spatial coding (Fernández and Goldberg, 1976; Flock, 1964; Si et al., 1997). The development of planar cell polarity in hair cells has been well described for the auditory system (Kaltenbach et al., 1994; Tilney et al., 1988; Tilney et al., 1992 review), but less so for the vestibular system (Denman-Johnson and Forge, 1999; Mbiene et al., 1984). Here, the polarization maps for both maculae in adult quail were established. Similar to many vertebrates, hair cell polarizations are directed toward the reversal line in the utricle (Baird and Schuff, 1994; Lewis and Li, 1975; Lu and Popper, 1998; Platt, 1975; Severinsen et al., 2003; Si et al., 2003; Wersäll et al., 1965), but away from the reversal line in the saccule (Jørgensen and Andersen, 1973; Lindeman, 1969; Spoendlin, 1964; Zakir et al., 2003). In birds, the reversal line is located in the striola region, toward the lateral and anterior edges of the epithelium (Si et al., 2003), with an anti-parallel arrangement observed along the medial extrastriola border. In mammals, the macular reversal zones are centrally located, with no region of anti-parallel organization shown to date (Fernández et al., 1990; Li et al., 2008; Lindeman, 1969). In contrast to the utricle, the quail saccule had a C-shaped reversal zone, similar to that seen in cormorants (Jørgensen and Andersen, 1973). However, in other species, the saccular reversal zone is J-shaped or S-shaped such as in pigeons (Zakir et al., 2003), many fish (Edds-Walton and Fay, 1995; Platt, 1975; Popper and Northcutt, 1983; Popper and Saidel, 1990) and mammals (Desai et al., 2005; Lindeman, 1969; Spoendlin, 1964).
In quail, we found that planar cell polarity occurred early in development. Many immature bundle formations exhibited an internal kinocilium that must migrate to an external position for polarity to be established. Nearly 90% of the measured cells exhibited immature stereocilia bundles early in development, but by E10, most cells were polarized. In immature bundles, more than 40% had internal kinocilia. Recently, several genes encoding adherence proteins (e.g., Flamingo, Frizzled, Scribble, Van Gogh) have been shown to be necessary for determining planar polarity in vestibular hair cells (Davies et al., 2005; Montcouqouil et al., 2003; 2006; Wang et al., 2006). The proteins reside eccentrically in the apical surface and are thought to guide the kinocilium of each cell to the peripheral edge, thereby establishing the morphological polarization.
In quail, polarity cues appear to be present as early as E7, and possibly E6, to initiate the morphological polarization of hair cells regionally across the macular surfaces. The planar polarities for hair cells were not randomly distributed, but instead established orientations that migrated as development progressed. By E10, the polarization maps were fully formed to an adult pattern in the utricle, complete with reversal zones, while the saccular map lagged behind by approximately one developmental day. The cues that regulate the map formation are unknown. Recent studies have suggested that signaling morphogens in the cochlea (where all hair cells have similar orientations) could produce a diffusion gradient across the epithelium to direct cellular polarity (Dabdoub and Kelley, 2005). However, in the vestibular maculae, hair cells have regional variations in morphological polarization and even different types of reversal zones, so multiple morphogens working in directional cascades would seem to be necessary. Recently, Warchol and Speck (2007) reported that the transcription factor GATA3 is expressed selectively beneath the perpendicular reversal zones in the chick utricle and lagena, but is absent in the oppositely directed reversal zone of the saccule. These authors suggest that GATA3 may induce morphogens that could direct a perpendicular reversal zone. They also suggest that it is possible that GATA3 plays a role in development of the unique type II band of hair cells in the utricle and lagena that is not present in the saccule. In the end, more research is needed to understand the mechanisms underlying development of hair cell polarization in the vestibular receptor organs.
Afferent development
It is known that in chicks and mice, at E5 and E13.5 respectively, vestibular hair cells begin to differentiate and migrate toward the epithelial surface early in development, (Friedmann, 1969; Ruben, 1967; Goodyear et al., 1995); before nerve fiber penetration into the sensory epithelium occurs (Friedmann, 1969). In quail, the initial afferent fibers entering the maculae appeared to be directed toward developing hair cells, consistent with the suggestion that hair cells supply chemical guidance cues to direct fiber growth. In fact, it has been reported that hair cells release neurotrophins, including BDNF and NT3, which are known to bind to specific afferent receptors (TrkB and TrkC, respectively) to direct growing fibers toward their targets (Ernfors et al., 1995; Fritzsch et al., 1998; Tessarollo et al., 2004). In quail, bouton terminals were observed early in development, largely in close approximation to hair cells, similar to findings reported for chick embryos (Ginzberg and Gilula, 1980). No developing calyceal terminals were observed until later in development, around E10. These early calyceal terminals consisted of cup shaped endings at the hair cell base, which were later followed by terminal finger-like projections that extended along the sides of the hair cell towards the apex. Similar descriptions for calyceal formation have been reported for chick maculae (Fink and Morest, 1977; Friedmann and Bird, 1967; Ginzberg and Gilula, 1980). Most of these initial proto-calyceal terminals were formed on fibers with extant branching fiber segments which contained terminal boutons. It appears certain that calyceal terminals develop on existing bouton fibers, and thereby trans-differentiate into dimorph afferents at E10 – E12. Many of these fibers are expected to remain dimorph afferents. However, it was not until late in embryonic development, at E14, that isolated calyx afferents were first observed. Since bouton fibers appear to trans-differentiate into dimorph units, it is also likely that some fraction of the dimorph fibers become induced (by as yet unknown factors) to shed their small branch segments with bouton endings and trans-differentiate into calyx afferents innervating only type I hair cells. We have recently proposed that a similar trans-differentiation process occurs during regenerative re-innervation of the vestibular epithelia (Haque et al., 2009; Zakir and Dickman, 2006). Alternatively, it is possible that new afferent fibers destined to form calyx innervations grow into the epithelium late in development. More research is needed to answer the question. As a comparison, calyceal terminal formation begins essentially at birth in rodents and continues for several post-natal weeks (Rüsch et al., 1998). However, many mammalian type I hair cells become differentiated prior to calyceal formation, again suggesting that morphogenic factors give direct signaling cues for calyceal terminal development (Lysakowski, 1999; Rüsch et al., 1998).
Afferent innervation patterns
At the terminal phase of development, bouton, dimorph, and calyx afferents were all observed in quail maculae, similar to other amniote vertebrates (Fernández et al., 1990; Si et al., 2003; Zakir et al., 2003). In the utricle, calyceal bearing afferents were principally located in the striola while bouton afferents innervated the extrastriola and type II band, similar to the organization reported for pigeons (Si et al., 2003; Zakir et al., 2003). In both species, calyceal bearing afferents are more broadly distributed throughout the saccular macula (Jørgensen and Andersen, 1973; Rosenhall, 1970; Si et al., 2003; Zakir et al., 2003). As a comparison, mammalian and turtle calyx afferents are restricted to a narrow striolar region (Desai et al., 2005; Leonard and Kevetter, 2002; Moravec and Peterson, 2004; Xue and Peterson, 2008), while in mammals dimorph afferents are found broadly throughout the epithelium. Bouton afferents are exclusively located in the mammalian extrastriolar region (Fernández et al., 1990). We have previously suggested that type I hair cells and calyceal terminals in otolith receptors may be increasing in numbers through selective adaptation (Zakir et al., 2003). For example, Type I hair cells are not present in fish or amphibians (Baird and Schuff, 1994; Chang et al., 1992), but first appear in reptiles and birds in limited numbers (Si et al., 2003; Moravec and Peterson; 2004; Zakir et al., 2003). The number of type I hair cells and calyceal terminals increases in mammals where the highest concentrations have been observed (Fernández et al., 1990; Desai et al., 2005; Lysakowski and Goldberg, 2008).
In quail, calyx afferents had the largest diameter axons, with short unbranched fibers that terminated in large calyceal terminals. On average, calyces contained 4 type I hair cells, fewer than the value of 7 for pigeons (Si et al., 2003), but more than the 1 – 3 hair cells generally observed in mammalian calyces (Desai et al., 2005; Fernández et al., 1990). Quail dimorph afferents were the most diverse in terms of innervation. Their parent axons were smaller than calyx fibers, yet their innervation patterns were more complex with multi-branched fibers that innervated a larger area of the utricular epithelium. There were fewer type I hair cells per calyceal terminal in dimorphs (average of 2) than calyx afferents. A similar diversity in pigeon utricular dimorph afferents was reported, except that pigeon dimorphs (like calyx afferents) were typically larger and more complex than those of quail (Si et al., 2003). In chinchillas, dimorph fibers were more widely spread throughout the macular epithelium than observed in birds (Fernández et al., 1990). Finally, quail bouton afferents had the smallest diameter axons of all fiber types, yet they were the most complex with the most branches, the largest arborization profiles, and the largest innervation areas. For comparison, the average number of 35 bouton terminals in quail afferents was identical to the mean value of 35 reported for chinchillas (Fernández et al., 1990), but less than the value of 60 for pigeons (Si et al., 2003) or nearly 150 for frogs (where only type II hair cells exist; Baird and Schuff, 1994).
Unfortunately, there remains a paucity of data relating differences in afferent physiological responsiveness to the striking differences in fiber innervation pattern. What is known is that fibers innervating the central maculae in chinchillas, where the calyx afferents are located, have the most irregular discharge rates, the highest sensitivities, and the most advanced phase values to linear acceleration as compared to extrastriola innervating afferents (Goldberg et al., 1990). In pigeons, we previously reported that utricular afferents exhibit some of the highest sensitivities to linear acceleration of any species examined to date (Si et al., 1997). These fibers also responded to high frequency stimuli with advanced phase values, but whether these fibers had calyceal terminals or not is unknown. No data currently exist for quail. To the best of our knowledge, neural recordings of developing vestibular afferents during embryogenesis have not been performed in any species. Still, otolith receptors must begin functioning early in many birds as vestibular evoked potentials could be elicited using linear acceleration in E19 chick embryos (Jones and Jones, 2000). Further, upon hatching, quail begin to forage and feed themselves, so a functioning vestibular system must exist. During development, it would appear that bouton afferents become responsive first, followed later by calyceal bearing fibers. Questions regarding development sequences of physiological responses and vestibular mediated behaviors remain the subject of future investigations. Certainly, differences in hair cell organization and innervation morphology throughout the maculae serve to provide important functional distinctions.
Acknowledgments
The authors would like to thank Mark Warchol for valuable discussions. The project described was supported by award numbers R01 DC003286 and R01 DC007618 from the National Institute on Deafness and other Communication Disorders and from award number NNA04CC52G from the National Aeronautics and Space Administration. The content is solely the responsibility of the authors and does not necessarily represent the official views of the National Institutes of Health or the National Aeronautics and Space Administration.
References
- Baird RA, Shuff NR. Peripheral innervation patterns of vestibular nerve afferents in the bullfrog utriculus. J Comp Neurol. 1994;342:279–298. doi: 10.1002/cne.903420210. [DOI] [PubMed] [Google Scholar]
- Bever MM, Jean YY, Fekete DM. Three-dimensional morphology of inner ear development in xenopus laevis. Developmental Dynamics. 2003;227:422–430. doi: 10.1002/dvdy.10316. [DOI] [PubMed] [Google Scholar]
- Blasiole B, Canfield VA, Vollrath MA, Huss D, Manzoor-Ali PKM, Dickman JD, Cheng KC, Fekete DM, Levenson R. Separate Na, K-ATPase genes are required for otolith formation and semicircular canal development in zebrafish. J Neuroscience. 2006;294:148–160. doi: 10.1016/j.ydbio.2006.02.034. [DOI] [PubMed] [Google Scholar]
- Cajal RS. Terminación periférica del nervio acústico del las aves. Trav Lab Invest Biol Univ Mad. 1908;6:161–176. [Google Scholar]
- Cajal RS. Histology of the Nervous System of Man and Vertebrates. New York: Oxford; 1909. 1995, English translation by Neely and Larry Swanson from the 1909 French translation by L. Azoulay), 1899 original Spanish version. [Google Scholar]
- Chang JSY, Popper AN, Saidel SM. Heterogeneity of hair cells in a fish ear. J Comp Neurol. 1992;342:621–640. doi: 10.1002/cne.903240413. [DOI] [PubMed] [Google Scholar]
- Corwin JT. Morphology of the macula neglecta in sharks of the genus Carcharhinus. J Morphology. 1977;152:341–362. doi: 10.1002/jmor.1051520306. [DOI] [PubMed] [Google Scholar]
- Dabdoub A, Kelley MW. Planar cell polarity and a potential role for Wnt morphogen gradient in stereocilia bundle orientation in the mammalian inner ear. J Neurobiol. 2005;64:446–457. doi: 10.1002/neu.20171. [DOI] [PubMed] [Google Scholar]
- Davies A, Formstone C, Mason I, Lewis J. Planar polarity of hair cells in the chick inner ear is correlated with polarized distribution of c-flamingo-1 protein. Developmental Dynamics. 2005;223:998–1005. doi: 10.1002/dvdy.20376. [DOI] [PubMed] [Google Scholar]
- Denman-Johnson K, Forge A. Establishment of hair bundle polarity and orientation in the developing vestibular system of the mouse. J Neurocytol. 1999;28:821–835. doi: 10.1023/a:1007061819934. [DOI] [PubMed] [Google Scholar]
- Desai SS, Zeh C, Lysakowski A. Comparative morphology of rodent vestibular periphery. I. Saccular and utricular maculae. J Neurophysiol. 2005;93:251–266. doi: 10.1152/jn.00746.2003. [DOI] [PubMed] [Google Scholar]
- Dickman JD, Huss D, Lowe M. Morphometry of otoconia in the utricle and saccule of developing Japanese quail. Hear Res. 2004;188:89–103. doi: 10.1016/S0378-5955(03)00377-0. [DOI] [PubMed] [Google Scholar]
- Eatock RA, Hurley KM. Functional development of hair cells. Curr Top Devel Bio. 2003;57:389–443. doi: 10.1016/s0070-2153(03)57013-2. [DOI] [PubMed] [Google Scholar]
- Edds-Walton PL, Fay RR. Regional differences in directional response properties of afferents along the saccule of the toadfish, Opsanus tau. Biol Bull. 1995;189:211–212. doi: 10.1086/BBLv189n2p211. [DOI] [PubMed] [Google Scholar]
- Ernfors P, Van De Water T, Loring J, Jaenisch R. Complementary roles of BDNF and NT-3 in vestibular and auditory development. Neuron. 1995;14:1153–1164. doi: 10.1016/0896-6273(95)90263-5. [DOI] [PubMed] [Google Scholar]
- Fernández C, Goldberg JM. Physiology of peripheral neurons innervating otolith organs of the squirrel monkey. I. Response to static tilts and to long-duration centrifugal force. J Neurophysiol. 1976;39:970–984. doi: 10.1152/jn.1976.39.5.970. [DOI] [PubMed] [Google Scholar]
- Fernández C, Goldberg JM, Baird RA. The vestibular nerve of the chinchilla. III. Peripheral innervation patterns in the utricular macula. J Neurophysiol. 1990;63:767–780. doi: 10.1152/jn.1990.63.4.767. [DOI] [PubMed] [Google Scholar]
- Fink DJ, Morest DK. Formation of synaptic endings by colossal fibers in the vestibular epithelium of the chick embryo. Neurosci. 1977;2:229–252. doi: 10.1016/0306-4522(77)90091-4. [DOI] [PubMed] [Google Scholar]
- Flock A. Structure of the macula utriculi with special reference to directional interplay of sensory responses as revealed by morphological polarization. J Cell Biology. 1964;22:413–431. doi: 10.1083/jcb.22.2.413. [DOI] [PMC free article] [PubMed] [Google Scholar]
- Friedmann I, Bird ES. Electron microscopic studies of the isolated fowl embryo otocyst in tissue culture. Rudimentary kinocilia, cup shaped nerve endings and synaptic bars. J Ultrastructural Res. 1967;20:356–367. doi: 10.1016/s0022-5320(67)80105-9. [DOI] [PubMed] [Google Scholar]
- Friedmann I. The innervation of the developing fowl otocyst in vivo and in vitro. Acta Otolaryngol. 1969;67:224–238. doi: 10.3109/00016486909125447. [DOI] [PubMed] [Google Scholar]
- Fritzsch B, Barbacid M, Silos-Santiago I. The combined effects of trkB and trkC mutations on the innervation of the inner ear. Int J Dev Neurosci. 1998;16:493–505. doi: 10.1016/s0736-5748(98)00043-4. [DOI] [PubMed] [Google Scholar]
- Ginzberg RD, Gilula NB. Synaptogenesis in the vestibular sensory epithelium of the chick embryo. J Neuroscytol. 1980;9:405–424. doi: 10.1007/BF01181545. [DOI] [PubMed] [Google Scholar]
- Goldberg JM, Desmadryl G, Baird RA, Fernández C. The vestibular nerve of the chinchilla. V. Relation between afferent discharge properties and peripheral innervation patterns in the utricular macula. J Neurophysiol. 1990;63:791–804. doi: 10.1152/jn.1990.63.4.791. [DOI] [PubMed] [Google Scholar]
- Goodyear R, Holley M, Richardson G. Hair and supporting-cell differentiation during the development of the avian inner ear. J Comp Neurol. 1995;351:81–93. doi: 10.1002/cne.903510108. [DOI] [PubMed] [Google Scholar]
- Goodyear RJ, Gates R, Lukashkin AN, Richardson GP. Hair-cell numbers continue to increase in the utricular macula of the early posthatch chick. J Neurocytol. 1999;28:851–861. doi: 10.1023/a:1007070121751. [DOI] [PubMed] [Google Scholar]
- Haque A, Zakir M, Dickman JD. Regeneration of vestibular horizontal semicircular canal afferents in pigeons. J Neurophsyiol. 2009;102:1274–1286. doi: 10.1152/jn.91000.2008. [DOI] [PMC free article] [PubMed] [Google Scholar]
- Hudspeth AJ, Corey DP. Sensitivity, polarity, and conductance change in the response of vertebrate hair cells to controlled mechanical stimuli. Proc Natl Acad Sci. 1977;74:2407–2411. doi: 10.1073/pnas.74.6.2407. [DOI] [PMC free article] [PubMed] [Google Scholar]
- Hughes I, Blasiole B, Huss D, Warchol M, Rath N, Hurle B, Dickman JD, Levenson R, Thalmann R, Ornitz D. Otopetrin is required for otolith formation in the zebra fish Danio rerio. Developmental Biology. 2004;276:391–402. doi: 10.1016/j.ydbio.2004.09.001. [DOI] [PMC free article] [PubMed] [Google Scholar]
- Huss D, Dickman JD. Histological preparation of developing vestibular otoconia for scanning electron microscopy. J Neuroscience Meth. 2003;125:129–136. doi: 10.1016/s0165-0270(03)00048-7. [DOI] [PubMed] [Google Scholar]
- Jones SM, Jones TA. Ontogeny of vestibular compound action potentials in the domestic chicken. J Assoc Res Otolaryngol. 2000;1:232–242. doi: 10.1007/s101620010026. [DOI] [PMC free article] [PubMed] [Google Scholar]
- Jørgensen JM, Andersen T. On the structure of the avian maculae. Acta Zool. 1973;54:121–130. [Google Scholar]
- Jørgensen JM, Mathiesen C. The avian inner ear. Continuous production of hair cells in vestibular sensory organs but not in the auditory papilla. Naturwissenschaften. 1988;75:319–320. doi: 10.1007/BF00367330. [DOI] [PubMed] [Google Scholar]
- Kaltenbach JA, Falzarano PR, Simpson TH. Postnatal development of the hamster cochlea II. Growth and differentiation of stereocilia bundles. J Comp Neurol. 1994;350:187–198. doi: 10.1002/cne.903500204. [DOI] [PubMed] [Google Scholar]
- Kido T, Sekitani T, Yamashita H, Endo S, Okami K, Ogata Y, Hara H. The otolithic organ in the developing chick embryo. Acta Otolaryngol (Stockh) 1993;113:128–136. doi: 10.3109/00016489309135780. [DOI] [PubMed] [Google Scholar]
- Kil J, Warchol ME, Corwin JT. Cell death, cell proliferation, and estimates of hair cell life spans in the vestibular organs of chicks. Hear Res. 1997;114:117–126. doi: 10.1016/s0378-5955(97)00166-4. [DOI] [PubMed] [Google Scholar]
- Lee MK, Tuttle JB, Rebhum LI, Cleveland DW, Frankfurter A. The expression and posttranslational modification of a neuron-specific beta-tubulin isotope during chick embryogenesis. Cell Motil Cytoskel. 1990;17:118–132. doi: 10.1002/cm.970170207. [DOI] [PubMed] [Google Scholar]
- Leondard RB, Kevetter GA. Molecular probes of the vestibular nerve. I. Peripheral termination patterns of calretinin, calbindin, and peripherin containing fibers. Brain Res. 2002;928:8–17. doi: 10.1016/s0006-8993(01)03268-1. [DOI] [PubMed] [Google Scholar]
- Lewis ER, Li CW. Hair cell types and distributions in the otolithic and auditory organs of the bullfrog. Brain Res. 1975;83:35–50. [Google Scholar]
- Li A, Xue J, Peterson EH. Architecture of the mouse utricle: macular organization and hair bundle heights. J Neurophysiol. 2008;99:718–733. doi: 10.1152/jn.00831.2007. [DOI] [PubMed] [Google Scholar]
- Lindeman EH. Regional differences in structure of the vestibular sensory regions. J Laryngol Otol. 1969;83:1–17. doi: 10.1017/s0022215100070018. [DOI] [PubMed] [Google Scholar]
- Lorente de Nó R. Etudes sur l’anatomie et al physiologie due labyrinthe de l’oeille et due VIII nerf. Travaux du Lab de Recherches biologiques de l’Univer de Mad. 1926;24:53–153. [Google Scholar]
- Lu Z, Popper AN. Morphological polarizations in sensory hair cells in the three otolith organs of a teleost fish: fluorescent imaging of ciliary bundles. Hear Res. 1998;126:47–57. doi: 10.1016/s0378-5955(98)00149-x. [DOI] [PubMed] [Google Scholar]
- Lysakowski A. Development of synaptic innervation in the rodent utricle. Ann NY Acad Sci. 1999;871:422–425. doi: 10.1111/j.1749-6632.1999.tb09209.x. [DOI] [PMC free article] [PubMed] [Google Scholar]
- Lysakowski A, Goldberg JM. Ultrastructural analysis of the cristae ampullares in the squirrel monkey (Saimiri sciureus) J Comp Neurol. 2008;511:47–64. doi: 10.1002/cne.21827. [DOI] [PMC free article] [PubMed] [Google Scholar]
- Mbiene JP, Favre D, Sans A. The pattern of ciliary development in fetal mouse vestibular receptors. A qualitative and quantitative SEM study. Anat Embryol (Berl) 1984;170:229–238. doi: 10.1007/BF00318726. [DOI] [PubMed] [Google Scholar]
- Molea D, Stone J, Rubel E. Class III β-tubulin expression in sensory and nonsensory regions of the developing avian inner ear. J Comp Neurol. 1999;406:183–198. [PubMed] [Google Scholar]
- Montcouquiol M, Rachel RA, Lanford PJ, Copeland NG, Jenkins NA, Kelley MW. Identification of Vangl2 and Scrb1 as planar polarity genes in mammals. Nature. 2003;423:173–177. doi: 10.1038/nature01618. [DOI] [PubMed] [Google Scholar]
- Montcouquiol M, Sans N, Huss D, Kach J, Dickman JD, Forge A, Rachel RA, Copeland NG, Jenkins NA, Bogani D, Murdoch J, Warchol ME, Wenthold R, Kelley MW. Asymmetric localization of Vangl2 and Fz3 indicate novel mechanisms for planar cell polarity in mammals. J Neurosci. 2006;26:5265–5275. doi: 10.1523/JNEUROSCI.4680-05.2006. [DOI] [PMC free article] [PubMed] [Google Scholar]
- Moravec WJ, Peterson EH. Differences between stereocilia numbers on type I and type II vestibular hair cells. J Neurophysiol. 2004;92:3153–3160. doi: 10.1152/jn.00428.2004. [DOI] [PubMed] [Google Scholar]
- Oh SH, Johnson R, Wu DK. Differential expression of bone morphogenetic proteins in the developing vestibular and auditory sensory organs. J Neurosci. 1996;16:6463–6475. doi: 10.1523/JNEUROSCI.16-20-06463.1996. [DOI] [PMC free article] [PubMed] [Google Scholar]
- Perry B, Jensen-Smith HC, Luduena RF, Hallworth R. Selective expression of β tubulin isotypes in gerbil vestibular sensory epithelia and neurons. J Assoc Res Otolaryngol. 2003;4:329–338. doi: 10.1007/s10162-002-2048-4. [DOI] [PMC free article] [PubMed] [Google Scholar]
- Platt C. Hair cell distribution and orientation in goldfish otolith organs. J Comp Neurol. 1975;172:283–298. doi: 10.1002/cne.901720207. [DOI] [PubMed] [Google Scholar]
- Popper AN, Northcutt RG. Structure and innervation of the inner ear of the bowfin, Amia calva. J Comp Neurol. 1983;213:279–286. doi: 10.1002/cne.902130304. [DOI] [PubMed] [Google Scholar]
- Popper AN, Saidel WM. Variations in receptor cell innervation in the saccule of a teleost fish ear. Hearing Res. 1990;46:211–228. doi: 10.1016/0378-5955(90)90003-8. [DOI] [PubMed] [Google Scholar]
- Retzius G. Das gehörorgan der reptilien. der vögel, und der säugethiere; Stockholm: 1884. Das gehörorgan der wirbelthiere. II. [Google Scholar]
- Richardson KC, Jarett L, Finke EH. Embedding in epoxy resins for ultrathin sectioning in electron microscopy. Stain Technology. 1960;35:313–316. doi: 10.3109/10520296009114754. [DOI] [PubMed] [Google Scholar]
- Roberson DF, Weisleder P, Bohrer PS, Rubel EW. Ongoing production of sensory cells in the vestibular epithelium of the chick. Hear Res. 1992;57:166–174. doi: 10.1016/0378-5955(92)90149-h. [DOI] [PubMed] [Google Scholar]
- Rosenhall U. Some morphological principles of the vestibular maculae in birds. Arch Klin Exp Ohr-Nas U Kehlk Heilk. 1970;197:154–182. doi: 10.1007/BF00306164. [DOI] [PubMed] [Google Scholar]
- Rowe MH, Peterson EH. Quantitative analysis of stereociliary arrays on vestibular hair cells. Hear Res. 2004;190:10–24. doi: 10.1016/S0378-5955(03)00395-2. [DOI] [PubMed] [Google Scholar]
- Ruben RJ. Development of the inner ear of the mouse; a radioautographic study of terminal mitoses. Acta Otolaryngol Suppl. 1967;220:1–44. [PubMed] [Google Scholar]
- Rüsch A, Lysakowski A, Eatock RA. Postnatal development of type I and type II hair cells in the mouse utricle: Acquisition of voltage-gated conductances and differentiated morphology. J Neuroscience. 1998;18:7487–7501. doi: 10.1523/JNEUROSCI.18-18-07487.1998. [DOI] [PMC free article] [PubMed] [Google Scholar]
- Severinsen AS, Jorgensen MJ, Nyengaard RJ. Structure and growth of the utricular macula in the inner ear of the slider turtle Trachymys scripta. J Assoc Res Otolaryngol. 2003;4:505–520. doi: 10.1007/s10162-002-3050-6. [DOI] [PMC free article] [PubMed] [Google Scholar]
- Seinknecht UJ, Fekete DM. Comprehensive Wnt-related gene expression during cochlear duct development in chicken. J Comp Neurol. 2008;510:378–395. doi: 10.1002/cne.21791. [DOI] [PMC free article] [PubMed] [Google Scholar]
- Shen Y, Jeyabalan AK, Wu KL, Hunker KL, Kohrman DC, Thompson DL, Liu D, Barald KF. The transmembrane inner ear (time) gene contributes to vestibular and lateral line development and function in the Zebrafish (Danio rerio) Devel Dynam. 2008;237:941–952. doi: 10.1002/dvdy.21486. [DOI] [PMC free article] [PubMed] [Google Scholar]
- Shotwell SL, Jacobs R, Hudspeth AJ. Directional sensitivity of individual vertebrate hair cells to controlled deflection of their hair bundles. Ann NY Acad Sci. 1981;374:1–10. doi: 10.1111/j.1749-6632.1981.tb30854.x. [DOI] [PubMed] [Google Scholar]
- Si X, Angelaki DE, Dickman JD. Response properties of pigeon otolith afferents to linear acceleration. Exp Brain Res. 1997;117:242–250. doi: 10.1007/s002210050219. [DOI] [PubMed] [Google Scholar]
- Si X, Zakir M, Dickman JD. Afferent innervation of the utricular macula in pigeons. J Neurophysiol. 2003;89:1660–1677. doi: 10.1152/jn.00690.2002. [DOI] [PubMed] [Google Scholar]
- Spoendlin HH. Organization of the sensory hair in the gravity receptors in the utricle and saccule of the squirrel monkey. Z Zellforsch. 1964;62:701–716. doi: 10.1007/BF00341855. [DOI] [PubMed] [Google Scholar]
- Swartz DJ, Santi PA. Immunolocalization of tenascin in the chinchilla inner ear. Hear Res. 1999;130:108–114. doi: 10.1016/s0378-5955(98)00229-9. [DOI] [PubMed] [Google Scholar]
- Tessarollo L, Coppola V, Fritzsch B. NT-3 replacement with brain-derived neurotrophic factor redirects vestibular nerve fibers to the cochlea. J Neurosci. 2004;24:2575–2584. doi: 10.1523/JNEUROSCI.5514-03.2004. [DOI] [PMC free article] [PubMed] [Google Scholar]
- Tilney LG, Tilney MS, Cotanche DA. Actin filaments, stereocilia and hair cells of the bird cochlea. V. How the staircase pattern of stereociliary lengths is generated. J Cell Biol. 1988;106:355–365. doi: 10.1083/jcb.106.2.355. [DOI] [PMC free article] [PubMed] [Google Scholar]
- Tilney LG, Tilney MS, DeRosier DJ. Actin filaments, stereocilia, and hair cells: How cells count and measure. Ann Rev Cell Biol. 1992;8:257–274. doi: 10.1146/annurev.cb.08.110192.001353. [DOI] [PubMed] [Google Scholar]
- Wang Y, Guo N, Nathans J. The role of Frizzled3 and Frizzled6 in neural tube closure and in the planar polarity of inner-ear sensory hair cells. J Neurosci. 2006;26:2147–2156. doi: 10.1523/JNEUROSCI.4698-05.2005. [DOI] [PMC free article] [PubMed] [Google Scholar]
- Warchol ME, Speck JD. Expression of GATA3 and tenascin in the avian vestibular and maculae: Normative patterns and changes during regeneration. J Comp Neurol. 2007;500:646–657. doi: 10.1002/cne.21153. [DOI] [PubMed] [Google Scholar]
- Werner CF. The differentiation of the maculae in the labyrinth, in particular in mammals. Z Anat Entwicklungersch. 1933;99:696–707. [Google Scholar]
- Wersäll J. Studies on the structure and innervation of the sensory epithelium of the cristae ampullares in the guinea pig; a light and electron microscopic investigation. Acta Otolaryngol Supp. 1956;126:1–85. [PubMed] [Google Scholar]
- Wersäll J, Flock A, Lundquist P. Structural basis for directional sensitivity in cochlear and vestibular sensory receptors. Cold Spring Harbor Symposia on Quantitative Biology. 1965;30:115–132. doi: 10.1101/sqb.1965.030.01.015. [DOI] [PubMed] [Google Scholar]
- Xue J, Peterson EH. Hair bundle heights in the utricle: differences between macular locations and hair cell types. J Neurophysiol. 2006;95:171–186. doi: 10.1152/jn.00800.2005. [DOI] [PubMed] [Google Scholar]
- Xue J, Peterson EH. Architecture of the mouse utricle: macular organization and hair bundle height. J Neurophysiol. 2008;99:718– 733. doi: 10.1152/jn.00831.2007. [DOI] [PubMed] [Google Scholar]
- Zakir M, Dickman JD. Regeneration of vestibular otolith afferents following ototoxic damage. J Neuroscience. 2006;26:2881–2893. doi: 10.1523/JNEUROSCI.3903-05.2006. [DOI] [PMC free article] [PubMed] [Google Scholar]
- Zakir M, Huss D, Dickman JD. Afferent innervation patterns of the saccule in pigeons. J Neurophysiol. 2003;89:534–550. doi: 10.1152/jn.00817.2001. [DOI] [PubMed] [Google Scholar]