

Abstract
Objectives
The content and distribution of lipids is an important aspect of plaque vulnerability, but lipids are present within a heterogeneous environment, impeding detection by magnetic resonance imaging. Our goal was to achieve accurate detection of mobile lipids by a single magnetic resonance imaging sequence.
Methods and Results
Carotid endarectomy specimens (n = 23) were imaged ex vivo at a high magnetic field (11.7 T) within 24 hours after surgery. Three contrast-weighted (T1W, T2W, and diffusion-weighted imaging [DWI]) image sequences were acquired and then coregistered with histological preparations for lipids (Oil red O and polarized light microscopy) and fibrous tissue (trichrome). Contrast-to-noise ratios were measured and compared for the 3 contrast weightings. Contrast-to-noise ratio measurement in regions identified as lipid versus fibrous tissue showed greater differences by DWI (4.5±0.63 versus 0.64±0.08; P<0.05) as compared with T2W (2.83±0.36 versus 1.36±0.37; P<0.05). We validated the presence and distribution of lipids (mainly cholesteryl esters) by both histology and image-guide spectroscopy. The basis for distinguishing mobile lipid and water inside the plaque was illustrated by diffusion-weighted spectroscopy.
Conclusions
Biophysical properties of plaque lipids can confer selective identification by DWI, as opposed to standard T1W and T2W imaging sequences. Successful translation of DWI in vivo could identify of features of vulnerable plaque.
Keywords: atherosclerosis, carotid arteries, diffusion-weighted image, lipids, MRI
Atherosclerosis is characterized by the presence of discrete lipid-containing plaques within the walls of arteries and underlies the clinical conditions of myocardial infarction, chronic stable angina, stroke, and peripheral vascular disease.1 Plaques with a high likelihood of thrombotic complications and rapid progression to an unstable state are termed vulnerable plaques.1 Vulnerable plaques are not identified in vivo by conventional angiographic x-ray techniques or other standard methods before thrombosis; these methods assess lumen diameter but do not provide information about the ultrastructure of the plaque.2 High-resolution magnetic resonance imaging (MRI) has emerged as a noninvasive modality for atherosclerotic plaque characterization because it permits measuring plaque burden and determining plaque constituents both ex vivo and in vivo.3–6
Accurate detection of lipid deposits is important for monitoring progression of atherosclerosis (and its potential regression) and for predicting plaque vulnerability. However, lipids are often difficult to distinguish from other components by MRI in the heterogeneous environment of a plaque,7 and the reported appearance of lipids in different MR studies is inconsistent.3–6 Until detection of lipids by MRI is improved and fully validated, assignment of lipids in MR images must be made mainly by correlation with other methods, usually histology. However, a recent survey of 73 studies concluded that carotid plaque images cannot be reliably correlated with histology because of inadequately performed histological methods.8 For example, lipids in plaque are not easily discerned in tissue slices obtained from paraffin-embedded tissue, primarily because organic solvents extract and/or distort lipid deposits. Furthermore, current MRI studies of atherosclerosis often rely on a combination of multicontrast sequences rather than a single protocol, making the results subject to considerable variability.9 In general, lipids are identified as regions that are bright in T1W images and dark in T2W images.6,10,11 These lipids represent mainly liquid cholesteryl esters (CE), the most abundant liquid lipid, because T2 relaxation of the liquid-crystalline phospholipid/cholesterol bilayers and crystalline cholesterol are much faster.12 Cholesterol crystals give rise to signal voids in MR images, although such voids may also represent calcium phosphate.13
Diffusion-weighted imaging (DWI) is a representation of molecular diffusion, which can be quantified by the apparent diffusion coefficient (ADC). The ADC is a phenomenological measure that combines the actual diffusion coefficient of the observed spin (eg, water molecules) with the geometric restrictions imposed on molecular motion by barriers such as cell membranes, organelles, and other tissue microstructures. DWI is highly sensitive to changes in water molecule mobility.14 The calculated water diffusion coefficient in different components within plaques suggested that DWI might provide a tool for the characterization of atherothrom-bosis.15 We previously showed that DWI sequences revealed restricted diffusion of the atherothrombosis relative to the vessel wall of the rabbit aorta and provided excellent contrast between these 2 fundamental components of plaque rupture.16
Here we focus on the atherosclerotic plaque and critically evaluate DWI for identification of plaque lipids in human carotid endarectomy specimens. Lipid molecules, even within a liquid phase, undergo diffusion much slower than water molecules. Lipids in human breast adipose tissue, which consist mainly of triglyceride, are characterized by a very low diffusion coefficient.17 Recent ex vivo MRI studies of carotid plaques presented DW images as suggestive of a higher specificity for lipids than other contrast mechanisms. However, these studies did not specifically stain for lipid content or determine the types of lipids.3,18 Furthermore, the reliability of DWI in detecting lipids was not established. As shown, T1 and T2 images can sometimes detect lipids but often do not reveal lipids clearly and are thus unreliable. In addition, indirect methods have been used to provide contrast of plaque lipids, for example by highlighting the fibrous cap.19
The goals of this study were: (1) to improve detection of liquid lipids by creating high contrast between the lipids and all other components of the plaque using a single sequence; (2) to validate our interpretations of images by rigorous histology with cryostat sectioning to avoid lipid extraction by organic solvents, together with polarized light microscopy to detect specific lipids in specific phases; and (3) to explain the biophysical mechanism by which DWI enhanced contrast as compared with conventional imaging methods such as T1W and T2W.
Materials and Methods
Materials
This study was approved by the Institutional Review Board of Boston University Medical Campus. Human carotid artery specimens (n = 23) were obtained after resection from 23 patients undergoing endarectomy because of arterial stenosis >70% as shown by ultrasound, MR angiography, or x-ray angiography. Demographic data from 17 subjects (8 male, 9 female, age = 66±8, mean±SD) were available because of Institutional Review Board protocol limitations. Most of subjects were white (n = 15), and there was 1 black subject and 1 Asian subject. Regarding conventional risk factors for carotid atherosclerosis, 88% of subjects had hypertension, 30% had diabetes, 41% were actively smoking, and 100% had hypercholesterolemia. Seven subjects (41%) had symptomatic carotid stenosis.
One-third to one-half of each specimen was sent to the pathology unit. We studied segments that were 1 to 3.5 cm in length and 0.8 to 1.5 cm in diameter. Specimens were rinsed with phosphate-buffered saline (PBS; 0.1 mol/L), marked at the proximal end, photographed, and transferred to glass tubes containing PBS. A protease inhibitor cocktail (1:100 dilution; Sigma-Aldrich Co., St. Louis, Mo) was added for tissue preservation. The entire preparation process was performed at room temperature in 10 to 20 minutes. Then, MRI experiments were conducted at 37°C. Before MRI experiments, 5 to 10 minutes were allowed for temperature stabilization. After a maximum of 24 hours of MRI experiments, the specimens were fixed with 10% formalin and kept at 4°C for histology.
A mixture of cholesteryl linoleate/cholesteryl oleate (1:1 wt; Sigma-Aldrich Co.) was chosen as a model for CE inside the atherosclerotic plaque.20
MRI
Images were acquired on an 11.7-T Avance spectrometer (Bruker, Billerica, Mass), using 10- or 20-mm birdcage coils. Data acquisition and reconstruction were performed with ParaVision software system provided by the vendor. Imaging parameters, optimized for contrast, were as follows: repetition time/echo time (TR/TE), 2000 ms/40 ms for T2W images; TR/TE, 160 ms/6 ms for T1W images; field of vision, 12 mm; matrix, 256×256; in-plane resolution of 46.9 μm; and slice thickness of 0.5 mm. The imaging time for each T1W and T2W experiment was 60 minutes. T2 relaxation times were determined using a CPMG sequence with Tα = 10 ms. T1 relaxation times were determined using a variable TR method with TR ranging from 165 to 4000 ms.
DW images were acquired using a DWI–spin echo sequence in a total acquisition time of 21 minutes. Parameters were TR/TE, 2000 ms/40 ms, matrix, 128×128, pulse field gradient duration (δ) of 10 ms, and pulse field gradient separation (Δ) of 20 ms. Pulse field gradient strengths varied from 0 to 100 mT/m, yielding 5 images (attenuator factor b = 0, 136, 317, 699, and 1230 sec/mm2). Each 5-image set was then used to produce a parametric image of the ADC. To validate the determined ADCs, reference images of water, acetone, and isopropanol were obtained. Measured ADCs were consistent with those previously reported.21
MR Spectroscopy
MR spectra were acquired after completion of DWI measurements using a point-resolved spectroscopy sequence; 2-mm3 volumes were centered on the regions predicted by DWI to be lipid-rich or lipid-poor. The water peak was assigned to 4.7 ppm and lipid signals identified by characteristic peaks between 0.8 ppm and 1.4 ppm.22 A stimulated echo acquisition mode sequence with a diffusion module was used to obtain spectra with different diffusion gradient strengths. Fifteen different gradients strengths values were used (10 mT/m to 600 mT/m, corresponding to b values of 84 sec/mm2 to 20000 sec/mm2). MR spectroscopy parameters were: spectral width, 5K; acquisitions size, 2048; TR, 5 seconds; and NEX, 512. Spectra were postprocessed with the program MestRe-C (Mestrelab Research). The water and major CE peaks were integrated and normalized to the signal intensity measured with b = 0 (no diffusion weighting).
Histology
After completion of the MRI experiments, specimens were fixed in 10% formalin for cryosectioning. Transverse sections (10-μm-thick) were collected throughout the length of the segment, and adjacent slides were stained by hematoxylin and eosin, Oil red O (ORO), and Masson trichrome for cellular components, neutral lipid, calcification, fibrous tissue, and thrombus, respectively. Polarized light microscopy was also used with corresponding unstained slices to observe the characteristic birefringence of cholesterol and CE. Lipid was defined as intense red staining by ORO or typical birefringence pattern under polarized light microscopy.20 Fibrous tissue was defined as blue stain on trichrome.
Data Analysis and Image Registration
MRI slices and voxels for spectroscopy were located precisely by obtaining sagittal view images of the entire specimen and measuring from the proximal end of the specimen or the common carotid bifurcation. If the bifurcation was not present in the specimen, other internal plaque landmarks clearly visible by MRI and histology were chosen for coregistration. The gross morphology and calcified regions of each MR image were used to confirm registration with histology sections. To compensate for the different slice thicknesses in MRI (500 μm) and histology (10 μm), 2 consecutive histological sections 250 μm apart were acquired in segments encompassing each MRI slice. These 2 sections within one MRI slice showed no dramatic morphological difference across all plaques studied. Furthermore, one of the histological sections was chosen to correlate with MR slices by scaling, translation, and rotation transforms using ImageJ (National Institutes of Health, version 1.36). A second observer (J.V.) colocalized imaging slices with histology.
Of our 23 specimens, 2 were highly calcified and were excluded because of sample disruption during preparation for histology.13 Four demonstrated low lipid content by both MRI and histology. Contrast-to-noise (CNR) calculations were performed on 70 cross sections from the remaining 17 specimens (3 to 5 slices per specimens). Small regions of interest were selected for image analysis from the area defined by histology as noncrystalline lipids or fibrous tissue; 2 to 3 regions of interests were collected from each tissue type. Normalized CNR for each sequence was calculated using CNR = SIt−SIPBS/SDnoise, where SIt is the signal intensity of tissue, SIPBS is the signal intensity of the background PBS buffer, and SDnoise is the standard deviation of background PBS noise. The Mann-Whitney rank sum test was used to asses for statistical differences between CNR values associated with the lipid-rich region and fibrous tissue. Statistical significance was defined as a value of P<0.05. The calculations were performed using SigmaStat (version 3.1; Systat Software, Inc.). Histograms for T1, T2, and ADC maps were postprocessed by MATLAB 6.5 (The MathWorks, Inc.).
Results
T1W and T2W Images Did Not Accurately Identify Lipids in the Carotid Plaques
Comparison of 70 MR images with histology (see Methods) showed that T1W and T2W images did not accurately identify noncrystalline lipids in the carotid plaques, as illustrated in Figure 1 (T1W in Figure 1A and 1D, and T2W in Figure 1B and 1E images). Lipid deposits identified by ORO staining as intense red are shown in Figure 1C and 1F. In the first specimen (upper row), there was a rough correlation between histology findings and MR images; the lipid deposits were bright on T1W (Figure 1A) and dark on T2W (Figure 1B). In the second example (lower row), T1W and T2W images correlated poorly with the histology results. Because our analysis (Methods) showed that the histology was not different in sections obtained 250 μm apart in these samples, the discrepancy does not appear to be a limitation of the histological methods or of registration.
Figure 1.
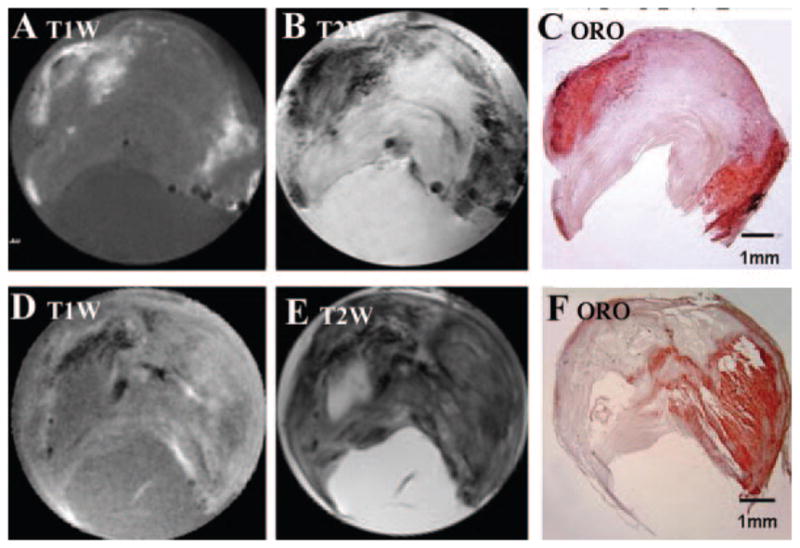
T1W and T2W MR images of 2 carotid plaques (endarectomy specimens) and histological identification of lipids. A and D, T1W image. B and E, T2W image. C and F, ORO staining: intense red staining signifies lipid deposits.
DWI Created Higher Contrast Between Lipid Deposits and Fibrous Tissue Than T1W or T2W Imaging
A different carotid plaque (Figure 2) also showed a rough correlation between bright signal on T1W images (Figure 2A), dark signal on T2W images (Figure 2B), and ORO staining (Figure 2E). However, the bright signal in the DW image (Figure 2C) more faithfully matched the distribution of ORO stain and had higher contrast with the surrounding fibrous tissue. The ADC (Figure 2D) was calculated from DW images for each constituent: lipid-rich core (0.36±0.16), fibrous tissue (1.55±0.38), and PBS buffer (2.14±0.15), all in units of 10−3 mm2/s (P<0.05).
Figure 2.
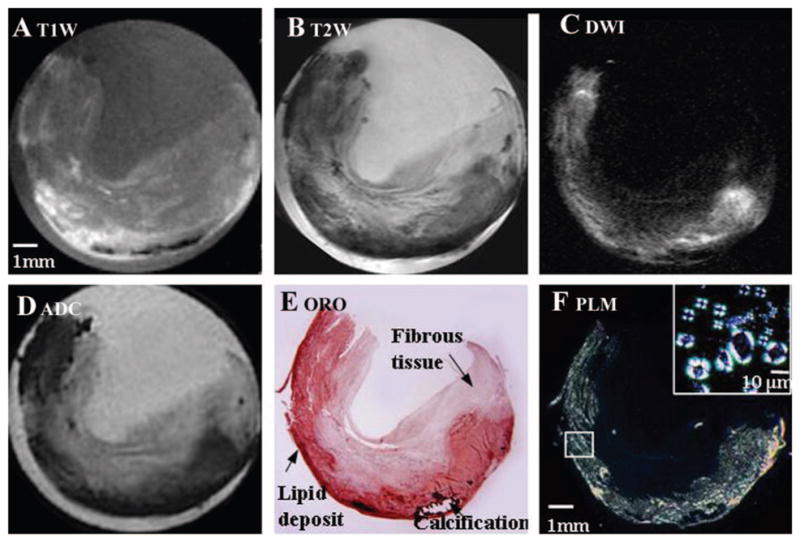
T1W, T2W, and DW MR images of a carotid plaque (endarectomy specimen) correlated with histology. A, T1W image. B, T2W image. C, DW image (b value 1230 s/mm2). D, ADC map. E, ORO staining. Major features of the plaque are indicated. F, Polarized light microscopy image of relevant unstained section at 22°C. Bright signals indicate lipids (mainly CE). The inset shows Malt-ese crosses characteristic of liquid-crystalline CE after heating to 60°C and cooling to 33°C.
Histology and MRS Validate Image Assignment
The corresponding histology images (Figure 2E, 2F) confirmed our assignment of the bright areas in DWI to lipids. Polarized light microscopy, which is more specific for identification of lipid type and phase, showed birefringence (Maltese cross in the small box of Figure 2F) characteristic of liquid crystalline CE at 33°C, which melted completely by 37°C.20 Crystalline cholesterol melts at a much higher temperature and can be identified by polarized light microscopy20 but was not detected in our samples.
The calculated CNR for plaque lipids and fibrous tissue was significantly different in both T2W and DW images but much larger for DWI (2.83±0.36 versus 1.36±0.37, P<0.05 for T2W; 4.5±0.63 versus 0.64±0.08, P<0.05 for DWI). By comparison, the T1W did not shown CNR difference in CNR for lipid and fibrous tissue in the averaged pool of 17 specimens (Figure 3A). The contrast in T1W and T2W, as well as in DWI, is parameter-dependent, whereas derived values in T1, T2, and ADC maps are less dependent on experiment variables. To minimize the effect of parameters (eg, TR, TE, and b values) on image contrast, we calculated T1, T2, and ADC maps, from which histograms were created for the entire specimen (Figure 3B). Bimodal signal dispersion is observed on the ADC map of the specimen, and the 2 distinct distributions (0.4×10⁻³ mm2/s, 1.5×10⁻³ mm2/s) represent 2 distinguishable components: fibrous tissue and lipid core. However, T1 and T2 maps each show only one component, centered in 1900 ms and 40 ms, respectively. The results further support our finding that higher CNR can be obtained on the basis of diffusion mechanisms than on the T1 and T2 relaxation.
Figure 3.

A, CNR for different tissue components in T1W, T2W, and DW images. CNR values are shown as mean±SEM, N = 17. In the plot, zero represents the contrast value of background PBS. *Statistically significant difference. B, Histograms for 3 parametric maps. The horizontal axis is measured T1, T2, and ADC values; vertical axis is number of pixels per unit. The bin sizes for the x-axis are 0.02×10⁻³ mm2/s for ADC, 25 ms for T1 map, and 1 ms for T2 map, respectively. The locations of histogram peaks with respective to x-axis indicate most common ADC, T1, and T2 values.
To validate the correlation of hyperintense regions within DW images with lipid, 1H NMR spectroscopy was also performed at 37°C.22 1H spectra (Figure 4A) revealed a spectral signature of CE (Figure 4B) from a lipid-rich region identified by DWI (Figure 4D), whereas spectra from a lipid-poor region did not demonstrate these resonances. Figure 4C and 4D illustrate DW and T2W images with the relevant 2-mm3 voxels for spectroscopy. Lipid-rich regions identified by MRI and MRS corresponded to lipid-rich regions as demonstrated by ORO staining (Figure 4E) and polarized light microscopy (not shown).
Figure 4.

Image-guided proton spectra of a carotid plaque correlated with histology. A, Spectra obtained from lipid-rich and lipid-poor regions, respectively, with water suppression. B, Spectrum obtained from a lipid mixture (1:1 cholesteryl linoleate/cholesteryl oleate mixture). C, T2W image. D, DW image. E, ORO staining.
Differences in DWI Signal Intensities Are Caused by the Slow Diffusion of Lipids
1H MR spectra show contributions from both lipid (CE) and water within the lipid-rich region. To illustrate the physical basis of DWI for distinguishing lipid and water within the plaque, imaging (DWI–spin echo) experiments were conducted on phantoms consisting of water and pure lipid (cholesteryl linoleate, in liquid state at 37°C) with a range of b values from 0 to 16000 sec/mm2. The signal attenuation curves for lipid and water (Figure 5A) revealed that lipid diffusion was much slower than water, as expected. A close examination of the attenuation curve at lower b values (0 to 700 sec/mm) better-illustrated the tendency for water signal decay (Figure 5B). To study the diffusion properties of water and lipid separately in the plaque, diffusion weighting was combined with MRS. Figure 5C shows a series of MRS obtained by stimulated echo acquisition mode from the same voxel located in the lipid-rich region illustrated in Figure 4. When b = 0, the spectrum is dominated by the water signal, and the water-to-lipid (CE) ratio is 8:1. With increasing gradient strengths, the water signal was attenuated; in fact, when the attenuation factor (b) reached 2700 s/mm2, the water signal was almost completely suppressed, and spectrum was dominated by lipid peaks. In contrast, the diffusion gradients had minimal effect on the lipid signal, which remained almost the same as shown in Figure 5D. For DWI–spin echo we chose a smaller range of b values (0 to 1230 sec/mm2; Figures 2C, 4D) that could also be used for in vivo clinical imaging at lower field, In this range, ≈80% of water signal is attenuated (Figure 5D).
Figure 5.

A and B, Plot of normalized signal intensity versus b factors (attenuator factor) in high b value range (0 to 16 000 s/mm2) and a low b range (0 to 700 s/mm2) in pure lipid and water phantoms. Water signal does not go to zero because measurements were performed on magnitude images where the noise does not average to zero. C, Serial spectra obtained from the lipid-rich regions by varying the b value (same voxel as shown in the Figure 4). D, Plot of normalized signal intensity versus b value in the lipid-rich region of the plaque.
Discussion
DWI Is a Reliable Method to Identify Liquid Lipid Deposits
From an extensive and detailed comparison of T1W, T2W, and DWI images of carotid plaque specimens with histology, we demonstrated that DWI created the highest CNR for mobile lipid. The enhanced detection of lipids will allow more precise analysis of the quantity and location of fluid lipid in relation to other plaque constituents, and possible correlations with clinical data for patients who have undergone endarterectomy.
The lower CNR of T1W and T2W images of the carotid plaques could be a source of uncertainty in correlations of histology and MR images. Reports of the appearance of lipids in carotid plaques in T1W and T2W MR images are conflicting. Various studies (ex vivo6 and in vivo23) have reported that lipid-core regions are more hypointense than fibrous tissue in T2W images or, conversely that lipids and fibrous tissue were isointense (ex vivo3 and in vivo4). In some comparisons of images from different studies, such as the preceding, there may be an additional inconsistency because of the dependence of relaxation on magnetic field strengths.
We confirmed the presence of liquid lipid in the hyperin-tense regions in DW images by voxel-selective MRS. Lipids within plaques have a low content of triglyceride (5 to 10 wt%) and a high content of CE, both of which are liquid at body temperature. Unesterified cholesterol can also be present at high concentrations in plaques, but mainly as a crystalline form or complexed with phospholipids and would not contribute to the MRS spectrum.20 Thus, as expected, the intense NMR signals within the bright regions of DWI originated from CE in a liquid state.20 The presence and distribution of liquid lipid within the plaque was further validated by multivoxel 2-dimensional chemical shift imaging (not shown).24 Although the postprocessed T1/T2 map can show good correspondence with liquid lipids,22 such maps generated in this more extensive study (not shown) showed this approach was less reliable than DW for guiding voxel positions ex vivo.
Mechanism of High Contrast Created by DWI
Diffusion is an intrinsic property of molecular components in tissues, like T1 and T2 relaxation. MR spectra elicited from lipid-rich regions revealed that major contributions from 2 kinds of molecules, water and lipid (Figure 4). Whereas previous studies have focused solely on water diffusion,15 we studied the diffusivity of both water and lipid (CE). Compared with pure water and lipid phantoms (Figure 5A, 5B), water, and lipids in plaques (Figure 5C, 5D) have lower diffusivity as a result of physical barriers and restrictions. Water diffused slowly within the microenvironment of the atherosclerotic core, where the abundant lipids can restrict its diffusion relative to that in fibrous tissues.5 The diffusion of lipids within the plaque was extremely slow; the signal intensity remained almost the same even after applying very high diffusion gradients (Figure 5D). The hyperintensity (bright areas) in DW images, especially those obtained with a high b value, must be dominated by the slowly diffusing lipid protons because the water signal has been attenuated. As a result, DWI becomes a “lipids-specific” method that provides unique information on lipids within plaques.
Some studies have described the use of DWI to highlight hemorrhage (thrombus) within plaques.6,16 This study, focusing on lipid identification, does not provide enough data to draw conclusions about DWI and hemorrhage. Only 2 in-traplaque hemorrhages were noted on histology (not shown). Neither was bright on DWI, possibly because of susceptibility effects from paramagnetic heme metabolites.25 In addition, the ADC for lipids measured in this experiment (0.36±0.16×10⁻³ mm2/s) was much different from that measured for arterial thrombus (1.0×10⁻³ mm2/s).16 Thus, distinguishing lipid core from arterial thrombus should be straightforward but will need the scrutiny of future work.
In Vivo Application of DWI
The validation of DWI for lipid detection merits its consideration for future in vivo applications. Our strategy in this study was to obtain MR images at high field (11.7 T) to maximize the resolution and information content of images, and to use the high-resolution data of histology to interpret the images and validate our assignments. The approach of creating high contrast of one plaque constituent (lipid in this case) reduces dependence on resolution to distinguish key features (ie, features of vulnerability) in complex MR images. Compared with images that contain all components of the heterogeneous plaque, our approaches could be more valuable in applications to in vivo imaging of human atherosclerosis.
Nevertheless, the limited spatial resolution afforded at a low magnetic field (1.5 to 3 T) in a clinical scanner must still be considered, as well as field-dependent differences in T1 and T2. Diffusion parameters are less sensitive to field differences.26 In a comparison that is relevant for our ex vivo study, previous investigators have shown excellent resolution (50×100×1000 um3) in T1, T2, and DW images of carotid endarectomy specimens at 1.5 T in a whole-body system equipped with a custom made coil.3 The different components could be characterized by semi-automated classification based on a multiparameter analysis, and the lipid-rich core demonstrated a hyperintense appearance on DWI as in our results. In another ex vivo study of human atherosclerotic arteries (excised iliac and carotid), diffusion measurements performed on 3-T whole-body system with organ-specific detectors and strong gradients yielded sub 110-μm pixel resolution.26
The clinical application of DWI could also be hampered by bulk physiological motion and magnetic susceptibility. For the neck region, susceptibility artifacts appear at the air–tissue interface and are more prominent for DWI acquired by echo-planar imaging technique. An alternate approach, navigated DWI with spin-echo, resulted in high-quality DW images of the spinal region and eliminated both motion and susceptibility artifacts.27 Parallel imaging techniques combining sensitivity encoding with DWI can reduce image distortion through acceleration of image acquisition, as shown by applications to the abdomen or the musculoskeletal system.28 Line scan DWI is another approach to overcome motion complications in the regions of the body in which physiological motion and magnetic susceptibility are prevalent.29 New developments in MR hardware, pulse-sequences, and computer science have made DWI a more robust imaging technique with reasonable image quality and better diagnostic potential. The data presented here suggest that in the future, DWI could be useful in the noninvasive detection of atherosclerotic plaque lipid, and perhaps provide a means to detect vulnerable plaque in vivo.
Acknowledgments
The authors thank Dr Kevin Hallock for helpful comments.
Sources of Funding
This work was supported by NIH grant P50 HL083801.
Footnotes
Disclosures
None.
References
- 1.Fuster V, Moreno PR, Fayad ZA, Corti R, Badimon JJ. Atherothrombosis and high-risk plaque: part I: evolving concepts. J Am Coll Cardiol. 2005;46:937–954. doi: 10.1016/j.jacc.2005.03.074. [DOI] [PubMed] [Google Scholar]
- 2.Yuan C, Kerwin WS. MRI of atherosclerosis. J Magn Reson Imaging. 2004;19:710–719. doi: 10.1002/jmri.20070. [DOI] [PubMed] [Google Scholar]
- 3.Clarke SE, Hammond RR, Mitchell JR, Rutt BK. Quantitative assessment of carotid plaque composition using multicontrast MRI and registered histology. Magn Reson Med. 2003;50:1199–1208. doi: 10.1002/mrm.10618. [DOI] [PubMed] [Google Scholar]
- 4.Yuan C, Mitsumori LM, Ferguson MS, Polissar NL, Echelard D, Ortiz G, Small R, Davies JW, Kerwin WS, Hatsukami TS. In vivo accuracy of multispectral magnetic resonance imaging for identifying lipid-rich necrotic cores and intraplaque hemorrhage in advanced human carotid plaques. Circulation. 2001;104:2051–2056. doi: 10.1161/hc4201.097839. [DOI] [PubMed] [Google Scholar]
- 5.Toussaint JF, LaMuraglia GM, Southern JF, Fuster V, Kantor HL. Magnetic resonance images lipid, fibrous, calcified, hemorrhagic, and thrombotic components of human atherosclerosis in vivo. Circulation. 1996;94:932–938. doi: 10.1161/01.cir.94.5.932. [DOI] [PubMed] [Google Scholar]
- 6.Shinnar M, Fallon JT, Wehrli S, Levin M, Dalmacy D, Fayad ZA, Badimon JJ, Harrington M, Harrington E, Fuster V. The diagnostic accuracy of ex vivo MRI for human atherosclerotic plaque characterization. Arterioscler Thromb Vasc Bioly. 1999;19:2756–2761. doi: 10.1161/01.atv.19.11.2756. [DOI] [PubMed] [Google Scholar]
- 7.Takaya N, Yuan C, Chu B, Saam T, Polissar NL, Jarvik GP, Isaac C, McDonough J, Natiello C, Small R, Ferguson MS, Hatsukami TS. Presence of intraplaque hemorrhage stimulates progression of carotid atherosclerotic plaques: a high-resolution magnetic resonance imaging study. Circulation. 2005;111:2768–2775. doi: 10.1161/CIRCULATIONAHA.104.504167. [DOI] [PubMed] [Google Scholar]
- 8.Lovett JK, Redgrave JN, Rothwell PM. A critical appraisal of the performance, reporting, and interpretation of studies comparing carotid plaque imaging with histology. Stroke. 2005;36:1091–1097. doi: 10.1161/01.STR.0000160749.61763.95. [DOI] [PubMed] [Google Scholar]
- 9.Corti R. Noninvasive imaging of atherosclerotic vessels by MRI for clinical assessment of the effectiveness of therapy. Pharmacol Ther. 2006;110:57–70. doi: 10.1016/j.pharmthera.2005.09.004. [DOI] [PubMed] [Google Scholar]
- 10.Toussaint JF, Southern JF, Fuster V, Kantor HL. T2-weighted contrast for NMR characterization of human atherosclerosis. Arterioscler Thromb Vasc Biol. 1995;15:1533–1542. [PubMed] [Google Scholar]
- 11.Soila K, Nummi P, Ekfors T, Viamonte M, Jr, Kormano M. Proton relaxation times in arterial wall and atheromatous lesions in man. Invest Radiol. 1986;21:411–415. doi: 10.1097/00004424-198605000-00010. [DOI] [PubMed] [Google Scholar]
- 12.Toussaint J-F, Southern JF, Fuster V, Kantor H. T2-Weighted Contrast for NMR Characterization of Human Atherosclerosis. Arterioscler Thromb Vasc Biol. 1995;15:1533–1542. [PubMed] [Google Scholar]
- 13.Hallock KJ, Hamilton JA. Ex vivo identification of atherosclerotic plaque calcification by a 31P solid-state magnetic resonance imaging technique. Magn Reson Med. 2006;56:1380–1383. doi: 10.1002/mrm.21089. [DOI] [PubMed] [Google Scholar]
- 14.Bammer R. Basic principles of diffusion-weighted imaging. Eur J Radiol. 2003;45:169–184. doi: 10.1016/s0720-048x(02)00303-0. [DOI] [PubMed] [Google Scholar]
- 15.Toussaint JF, Southern JF, Fuster V, Kantor HL. Water diffusion properties of human atherosclerosis and thrombosis measured by pulse field gradient nuclear magnetic resonance. Arterioscler Thromb Vasc Biol. 1997;17:542–546. doi: 10.1161/01.atv.17.3.542. [DOI] [PubMed] [Google Scholar]
- 16.Viereck J, Ruberg FL, Qiao Y, Perez AS, Detwiller K, Johnstone M, Hamilton JA. MRI of atherothrombosis associated with plaque rupture. Arterioscler Thromb Vasc Biol. 2005;25:240–245. doi: 10.1161/01.ATV.0000149673.00564.0a. [DOI] [PubMed] [Google Scholar]
- 17.Tanner JE. Intracellular diffusion of water. Archi Biochem Biophys. 1983;224:416–428. doi: 10.1016/0003-9861(83)90228-x. [DOI] [PubMed] [Google Scholar]
- 18.Clarke SE, Beletsky V, Hammond RR, Hegele RA, Rutt BK. Validation of automatically classified magnetic resonance images for carotid plaque compositional analysis. Stroke. 2006;37:93–97. doi: 10.1161/01.STR.0000196985.38701.0c. [DOI] [PubMed] [Google Scholar]
- 19.Cai J, Hatsukami TS, Ferguson MS. In vivo quantitative measurement of intact fibrous cap and lipid-rich necrotic core size in atherosclerotic carotid plaque: comparison of high-resolution, contrast-enhanced magnetic resonance imaging and histology. Circulation. 2005;112:3437–3444. doi: 10.1161/CIRCULATIONAHA.104.528174. [DOI] [PubMed] [Google Scholar]
- 20.Small DM. Duff, George, Lyman Memorial Lecture—Progression and Regression of Atherosclerotic Lesions—Insights From Lipid Physical Biochemistry. Arteriosclerosis. 1988;8:103–129. doi: 10.1161/01.atv.8.2.103. [DOI] [PubMed] [Google Scholar]
- 21.Le Bihan D, Breton E, Lallemand D, Grenier P, Cabanis E, Laval-Jeantet M. MR imaging of intravoxel incoherent motions: application to diffusion and perfusion in neurologic disorders. Radiology. 1986;161:401–407. doi: 10.1148/radiology.161.2.3763909. [DOI] [PubMed] [Google Scholar]
- 22.Ruberg FL, Viereck J, Phinikaridou A, Qiao Y, Loscalzo J, Hamilton JA. Identification of cholesteryl esters in human carotid atherosclerosis by ex vivo image-guided proton MRS. J Lipid Res. 2006;47:310–317. doi: 10.1194/jlr.M500431-JLR200. [DOI] [PubMed] [Google Scholar]
- 23.Fayad ZA. The assessment of the vulnerable atherosclerotic plaque using MR imaging: A brief review. Int J Cardiac Imaging. 2001;17:165–177. doi: 10.1023/a:1010611530845. [DOI] [PubMed] [Google Scholar]
- 24.Wong WF, Northrup SR, Herrick RC, Glombicki AP, Wood RP, Morrisett JD. Quantitation of Lipid in Biological Tissue By Chemical-Shift Magnetic-Resonance-Imaging. Magnetic Res Med. 1994;32:440–446. doi: 10.1002/mrm.1910320403. [DOI] [PubMed] [Google Scholar]
- 25.Maldjian JA, Listerud J, Moonis G, Siddiqi F. Computing diffusion rates in T2-dark hematomas and areas of low T2 signal. AJNR Am J Neuroradiol. 2001;22:112–118. [PMC free article] [PubMed] [Google Scholar]
- 26.Berg A, Sailer J, Rand T, Moser E. Diffusivity- and T2 imaging at 3 Tesla for the detection of degenerative changes in human-excised tissue with high resolution: atherosclerotic arteries. Invest Radiol. 2003;38:452–459. doi: 10.1097/01.RLI.0000068620.17569.83. [DOI] [PubMed] [Google Scholar]
- 27.Kikuchi K, Miki H, Nakagawa A. The utility of diffusion-weighted imaging with navigator-echo technique for the diagnosis of spinal epidermoid cysts. AJNR Am J Neuroradiol. 2000;21:1164–1166. [PMC free article] [PubMed] [Google Scholar]
- 28.Bammer R, Auer M, Keeling SL, Augustin M, Stables LA, Prokesch RW, Stollberger R, Moseley ME, Fazekas F. Diffusion tensor imaging using single-shot SENSE-EPI. Magn Reson Med. 2002;48:128–136. doi: 10.1002/mrm.10184. [DOI] [PubMed] [Google Scholar]
- 29.Gudbjartsson H, Maier SE, Mulkern RV, Morocz IA, Patz S, Jolesz FA. Line scan diffusion imaging. Magn Reson Med. 1996;36:509–519. doi: 10.1002/mrm.1910360403. [DOI] [PubMed] [Google Scholar]