

SUMMARY
Recent studies have demonstrated that MyoD initiates a feed-forward regulation of skeletal muscle gene expression, predicting that MyoD binds directly to many genes expressed during differentiation. We have used chromatin immunoprecipitation and high throughput sequencing to identify genome-wide binding of MyoD in several skeletal muscle cell types. As anticipated, MyoD preferentially binds to a VCASCTG sequence that resembles the in vitro selected site for a MyoD:E-protein heterodimer, and MyoD binding increases during differentiation at many of the regulatory regions of genes expressed in skeletal muscle. Unanticipated findings were that MyoD was constitutively bound to thousands of additional sites in both myoblasts and myotubes, and that the genome-wide binding of MyoD was associated with regional histone acetylation. Therefore, in addition to regulating muscle gene expression, MyoD binds genome-wide and has the ability to broadly alter the epigenome in myoblasts and myotubes.
INTRODUCTION
Skeletal muscle differentiation is regulated by the myogenic basic-Helix-Loop-Helix (bHLH) transcription factors (Berkes and Tapscott, 2005; Tapscott, 2005). MyoD and Myf5 are expressed at the time of myogenic specification and, together with Myogenin (Myog) and MRF4, regulate the expression of skeletal muscle genes. These myogenic bHLH transcription factors are expressed almost exclusively in the skeletal muscle lineage, form heterodimers with members of the E-protein bHLH subfamily (E2A, E2-2, and HEB), and bind to a consensus E-box sequence (CANNTG). E-boxes are present in many of the regulatory regions of genes expressed in skeletal muscle. However, with over fourteen million consensus E-boxes in the genome, it is likely that every gene has the potential to be bound by MyoD or other myogenic bHLH factors.
Several mechanisms have been identified that increase the specificity of binding and activity among bHLH factors. First, degenerate selection strategies demonstrated that binding preference is conferred by the internal and flanking nucleotides in the CANNTG E-box. For example, the MyoD:E-protein heterodimer was shown to favor a consensus VCASCTGT site (IUPAC nomenclature (iupac.org) where V represents not T and S represents G or C), with E-proteins selecting the VCAS and MyoD selecting the CTGT (Blackwell and Weintraub, 1990). A similar study using a functional selection strategy, rather than only binding affinity, identified a slightly different set of core E-box sequences for MyoD activity: CASKTG (Huang et al., 1996), where K represents T or G. Second, sequence-function studies clearly demonstrated that binding affinity did not always correlate with transcriptional activation, as some E-box sequences were equivalently bound by MyoD and E-proteins but showed different abilities to function as MyoD-responsive enhancers (Davis et al., 1990; Weintraub et al., 1991). Third, we have demonstrated that MyoD functions together with other transcription factors in a feed-forward circuit and often binds to an E-box site prior to transcriptional activation, which is determined by recruitment of co-factors at the specific promoter (Bergstrom et al., 2002; Penn et al., 2004; Rampalli et al., 2007). Together, these studies indicate that MyoD binding affinity is sensitive to core and flanking E-box sequences, and that MyoD transcriptional activity can be regulated independently of binding affinity. Therefore, it is possible that MyoD might bind at sites in the genome without regulating regional gene transcription; however, it is not known how frequently this might occur nor whether it might have any other biological activity.
In this study, we have used chromatin immunoprecipitation and high throughput sequencing (ChIP-seq) to identify genome-wide binding of MyoD in several skeletal muscle cell types. As anticipated, MyoD binds to many of the genes transcriptionally regulated during skeletal muscle differentiation. However, MyoD also binds to thousands of additional sites genome-wide and induces regional histone acetylation. Therefore, in addition to regulating the expression of skeletal muscle genes, MyoD has the potential to broadly alter the epigenome in myoblasts and myotubes.
RESULTS
Identification of MyoD binding sites
Mouse C2C12 cells (Blau et al., 1983; Richler and Yaffe, 1970; Yaffe, 1968) are the most widely used cell line to study muscle differentiation. When maintained in a mitogen-rich culture medium (e.g., 10–20% FBS), C2C12 cells grow as myoblasts, expressing MyoD RNA and protein but not activating downstream genes associated with muscle differentiation. When cultured in low mitogen conditions, C2C12 cells differentiate into skeletal muscle cells and activate expression of muscle genes. To identify MyoD binding sites in muscle cells, we performed MyoD ChIPs in C2C12 cells differentiated into myotubes for 48 hrs. We used three different polyclonal rabbit antisera raised against different but overlapping fragments of the MyoD protein (Tapscott et al., 1988), all of which specifically immunoprecipitated MyoD and not the other myogenic bHLH factors (Supp. Fig. S1A). As controls for background enrichment, we also performed ChIPs with pre-immune serum in C2C12 cells and with the MyoD antisera in mouse embryonic fibroblasts (MEFs) that do not express MyoD.
Precipitated DNA fragments, ranging from 100 to 300 nt, were subjected to high throughput sequencing-by-synthesis on an Illumina Genome Analyzer System that yielded reads of approximately 35–54 nucleotides from a single end. To identify MyoD binding sites, reads with a unique match in the mouse genome were extended to a total length of 200 nt (the estimated average fragment size) and the number of overlapping reads at each position in the genome was computed to generate peak heights for MyoD or the control ChIP samples (see Experimental Procedures). Reads mapping to the X and Y chromosome were excluded from our analysis. The three individual antisera were highly concordant with Pearson correlation coefficients of 0.92, 0.92, and 0.94 (Supp. Fig. S1B) and we pooled the data from the three antisera for further analysis. The small number of regions enriched in the pre-immune IP control were subtracted from the analysis. A sampling analysis based on the accumulation of foreground signal indicated that we had sufficient read coverage for each condition (Supp. Fig. S1C).
Regions bound by MyoD in C2C12 myotubes
To choose a reasonable peak height, or coverage, cutoff for determining MyoD bound sites in myotubes, we estimated the false discovery rate (FDR) at various cutoffs. The FDR was 0.018 at a peak-height cutoff of six reads, and 10−7 at a cutoff of twelve reads (Supp. Fig. S1D). 59267 and 25956 peaks were identified at cutoffs six and twelve, respectively, and gene specific qPCR on twenty sites validated binding (Supp. Table 1A). At a similar stringency, FDR 10−6, the controls (Pre-immune sera, beads alone, or MyoD antisera in MEFs) had fewer than 200 peaks (Supp. Table S1B). An examination of nine previously characterized MyoD binding sites, showed coverage ranging from 16 to 275 reads (Supp. Table S1C). Except where noted, for subsequent analyses we will use the twelve-read cutoff as the criteria for a MyoD binding region, which remains a very conservative threshold for all cell types and experimental conditions reported here.
The 25956 MyoD binding sites in myotubes identified by a twelve-read cutoff are widely distributed both upstream and downstream of gene transcription start sites (TSS) with a high density near a TSS but the majority located more than 10 kb from a TSS (Table1; Supp. Fig. S1E). Approximately 41% of all annotated genes (7758 out of 18054) are bound by MyoD in C2C12 myotubes, using a “gene” definition as the region encompassed by −2 kb from the transcription start site to +2 kb from the polyadenylation site. Since many enhancers are more than 2 kb from their regulated TSS, we assigned MyoD peaks to the closest TSS within the domain bounded by the insulator factor CTCF, a strategy previously suggested as reasonable because CTCF is thought to establish domains within which enhancers and promoters can interact (Heintzman and Ren, 2009). Since CTCF binding is largely invariant across different cell types (Heintzman et al., 2009), we superimposed the CTCF binding profile previously determined in mouse ES cells (SRX 000540, from the NCBI Sequence Read Archive) with our MyoD ChIP-seq data and assigned each peak to the closest promoter within the domain defined by flanking CTCF binding. Of the 35440 annotated promoters (some of which represent alternative transcription start sites of the same gene), 19823 (56%) have a MyoD peak within the domain flanked by bound CTCF, and 13764 (74%) of the total 18054 annotated genes have MyoD bound within the domain flanked by CTCF at one of the transcription start sites.
Table1.
Gene context analysis of Myod binding sites
| #peaks7 | #genes8 | #peaks/Kb9 | ||||
|---|---|---|---|---|---|---|
| Myotube | Myoblast | Myotube | Myoblast | Myotube | Myoblast | |
| Promoter1 | 4772 | 4982 | 4256 | 4502 | 0.153 | 0.160 |
| Promoter.pro2 | 6349 | 6417 | 5085 | 5313 | 0.055 | 0.056 |
| 3prime3 | 694 | 517 | 579 | 433 | 0.022 | 0.017 |
| Exon | 2031 | 1615 | 1554 | 1283 | 0.032 | 0.026 |
| Intron | 8780 | 7239 | 5443 | 4957 | 0.011 | 0.010 |
| Upstream4 | 3739 | 3124 | 2600 | 2272 | 0.015 | 0.012 |
| Downstream5 | 3985 | 3237 | 2901 | 2447 | 0.015 | 0.013 |
| Intergenic6 | 6254 | 5776 | 0 | 0 | 0.005 | 0.004 |
|
| ||||||
| total | 25956 | 23271 | ||||
Promoter : +/− 500bp from the transcription start site (TSS).
Promoter proximal: +/−2kb from the TSS.
3prime end: +/−2kb from the end of the transcript.
Upstream: −2kb to −10kb upstream of the TSS.
Downstream: +2kb to +10kb from the end of the transcript.
Intergenic: >10kb from annotated gene.
# peaks: the number of peaks in each category.
# gene: the number of genes that peaks are associated with in each category, measured by unique Entrez IDs. If one or more peaks are located in multiple alternative splice variants of one gene, only one gene is counted.
# peaks/Kb: number of peaks divided by the total size of the corresponding genomic region in kilobase.
Sequence characteristics in regions bound by MyoD in C2C12 myotubes
To understand the sequence determinants of MyoD binding in myotubes, we first examined E-box sequences in the 200 nt region centered at the MyoD peak summit. 96% of all peaks contain at least one canonical E-box (CANNTG), with an average of 2.4 E-boxes per peak, relative to 1.14 in comparable control regions (see Experimental Procedures), and 72% of peaks have an E-box within 20 nt of the peak summit. A strong sequence preference was observed for the E-box sequences in peak regions (Fig. 1A): 74% of peaks have the CAGCTG E-box (enriched 11-fold); 32% have CACCTG (enriched 2.5 fold); and 89% have either or both of these two E-box motifs. Similarly, determining the number of reads that cover each E-box in the genome identifies CAGCTG and CACCTG as preferred binding sites with higher peaks favoring CAGCTG (Supp. Fig. S2A).
Figure 1.

MyoD binding in C2C12 myotubes. A) Average number of each E-box sequence under myotube peaks and control regions, where 1.0 indicates that each peak has on average one E-box of that sequence. Reverse complement sequences were combined. Compared to the controls, myotubes are enriched for CAGCTG and CAGGTG/CACCTG. B) Myotube peaks are enriched for 5’ A/G and depleted for 3’A at the positions immediately flanking the E-box (CAG[C/G]TG). The size of each nucleotide at a given position is proportional to the frequency of the nucleotide at that position. The darkness of the line connecting the two adjacent nucleotides is determined by the corresponding dinucleotide frequency. The counts of patterns on both strands are indicated above the graphs. C) Motifs enriched in E-box containing Myod binding regions in C2C12 myotube peaks. D) Motifs enriched in non-E-box containing MyoD binding regions in C2C12 myotube peaks.
The two 5-prime nucleotides flanking the E-box are enriched for A and G (positions 2 and 3 in Fig. 1B), and the 3-prime flanking nucleotide is depleted for A (position 10), however, this symmetry might reflect the lack of orientation of the core E-box sequence. If the first 5-prime flanking nucleotide is fixed, an asymmetry of E-box flanking sequences in MyoD-bound regions becomes more apparent (Supp. Fig. S2B), and the enriched sequences reflect the nucleotide preference of MyoD:E-protein heterodimers previously identified by in vitro binding selection assays (Blackwell and Weintraub, 1990). For example, the in vitro determined MyoD:E47 and MyoD:E12 heterodimer protein binding sequences were NACAGGTGBN and RACAGGTGBH, using IUPAC nomenclature where R = A/G, B = not A, H = not G, and N = any nucleotide; and the consensus flanking binding sequence of the CAGGTG E-box in our ChIP-seq study is RRCAGGTGBN (Fig. 1B right panel).
We also performed a de novo motif search on the E-box containing MyoD peaks using a regression-based method. The regions under MyoD peaks had a significantly higher GC content compared to control regions (56% in MyoD peaks vs. 44% in control regions) and we therefore adjusted for GC content with a regression term (see Experimental Procedures). We started with a seed pattern of six nt, then iteratively expanded the motif to a total length of up to twelve nt. The identified motifs are listed in Fig. 1C and in order of enrichment represent: E-boxes (CASCTG); AP1/c-Fos site (TGAGTCA); Meis site (CTGYCA); partial match to Runx site (RCCACAG); and two additional E-boxes (CAGWTG). AP1/cFos and Meis have both been implicated in the regulation of myogenic differentiation. The Runx family of transcription factors have been well documented to be associated with leukemia, whereas their role in myogenesis is largely unknown. Without controlling for GC content during the motif search, the top non-E-box motifs are composed entirely of C and G bases. The most significant of these motifs, CCGCCC, matches the Sp1 binding site, a factor that has been shown to regulate muscle gene expression with MyoD.
A small percentage of MyoD bound regions (4%) do not contain any consensus E-box. Interestingly, most of these regions are located within 500 nt of a TSS (59%) or overlap with a CpG island (67%), and have very high GC content (67% average GC content). Compared to control regions without E-boxes and within CpG islands, the top motifs were non-canonical E-boxes CAGSCG and the Sp1 site CCGCCC (Fig. 1D).
To complement the motif search, we identified the conserved TRANSFAC binding sites in the MyoD bound regions. Consistent with our motif search findings, the TRANSFAC search showed significant enrichment for E-box motifs (MyoD, AP-4, E47, Lmo2, ITF-2, USF2), AP-1 like motifs (FosB), and Sp1 sites in MyoD bound regions (Supp. Table S2).
MyoD binding in myoblasts compared to myotubes
Next, we determined MyoD binding in myoblasts at 50% confluence (log-phase growth) and 95% confluence (prior to transition to low mitogen differentiation medium). The location and height of the MyoD binding in C2C12 cells at 50% and 95% confluence was highly concordant, with a Pearson correlation coefficient of 0.85 (Fig. 2A). In addition, the majority of sites bound by MyoD in differentiated myotubes were bound nearly equivalently in myoblasts (95% confluent), with a Pearson correlation coefficient of 0.77 (Fig. 2B). For example, MyoD binds to regulatory regions of the Desmin gene (Fig. 2C) and the core enhancer of the MyoD gene (Fig. 2D) in both myoblasts and myotubes. In contrast to the majority of binding sites that do not substantially change between myoblasts and myotubes, it is striking that many of the previously identified functional MyoD binding sites associated with genes activated during differentiation showed enhanced MyoD binding in myotubes. For example, at the Myog promoter (Fig. 2E) and the CKM regulatory regions (Fig. 2F), MyoD binding increases substantially in the differentiated myotubes. In summary, the majority of MyoD binding regions are bound by MyoD in both myoblasts and myotubes, and some of these regions are associated with genes expressed in both myoblasts and myotubes, such as Desmin and MyoD; whereas, a sampling of regulatory regions in genes induced during differentiation show enhanced MyoD binding in differentiated myotubes compared to myoblasts.
Figure 2.

MyoD binding in C2C12 myoblasts compared to C2C12 myotubes. A) 50% and 95% confluent C2C12 myoblasts share similar binding profiles. The X- and Y-axes of the scatter plot correspond to the Variance Stabilization and Normalization (vsn) transformed number of reads in 50% and 95% confluent C2C12 myoblasts in the combined peak regions. The middle diagonal line is the linear fit. The two flanking lines define the 95% confidence interval for differential peaks. Grey scale values represent a smoothed density estimate for the bulk of the data. Individual points shown at the fringes represent the outliers in low density regions. Peaks within +/−2 kb of the TSS of selected muscle genes (Myh3, Acta, Myog, Cdh14, Mef2a, Des, and Ckm) are annotated by gene names. Note that some genes have multiple peaks within the promoter regions. B) 95% C2C12 myoblasts and C2C12 myotubes have overlapping but different binding profiles. Scatter plot is similar to Figure 2A. C)) MyoD binding profile at the Desmin locus. The Y-axis scale was adjusted by the total number of reads in each cell type, so that non-differentially bound peaks appear roughly the same heights in all three tracks. The two peaks match the two previously characterized MyoD binding sites (Tam et al., 2006). D) MyoD binding profile at the MyoD locus identifies three previously characterized MyoD binding sites (stars) (Asakura et al., 1995; Goldhamer et al., 1992; Tapscott et al., 1992) and several new MyoD binding sites. E) MyoD binding profile at the Myog locus identifies the known MyoD binding site in the promoter region, as well as a new binding site at the 3’ end of the gene. F) MyoD binding profile at the Ckm Locus identifies all known MyoD binding sites.
To determine whether differentiation-enhanced MyoD binding was associated with genes induced during differentiation, we determined differentially expressed peaks between 95% confluent myoblasts and myotubes using a regression based analysis. Briefly, we combined the data from the myotubes and myoblasts and detected 49472 peaks using a twelve-coverage cutoff, of which 3926 and 2169 were identified as myotube-increased (significantly increased binding in myotubes) and myotube-decreased (significantly decreased binding in myotubes) peaks, respectively, using a statistical criterion (see Experimental Procedures). The remaining 43377 peaks are categorized as unchanged. Differentially bound peaks were assigned to a gene based on the closest TSS within the region flanked by CTCF binding sites. 3124 myotube-increased peaks were assigned to 1588 genes, and 1723 myotube-decreased peaks were assigned to 950 genes. Of these, 105 genes were assigned both myotube-increased and myotube-decreased peaks.
Gene set enrichment analysis (GSEA) showed that genes associated with myotube-increased peaks are enriched for Gene Ontology (GO) categories related to muscle formation and function; whereas genes associated with myotube-decreased peaks are enriched for GO terms related to cell proliferation and cell communication (Table 2). A similar GSEA analysis showed significant enrichment in cell mobility and cell adhesion GO categories for genes associated with peaks that decrease as cells reach confluence, whereas no informative GO categories are enriched for genes associated with peaks that increase as cells reach 95% confluence (Supp. Table S3A).
Table2.
Gene ontology analysis on differentially bound peaks in myoblasts vs myotubes.
| GO categories enriched in genes associated with myotube-increased peaks | ||||||
|---|---|---|---|---|---|---|
| GOID | Term | Pvalue | OR1 | Count2 | Size3 | Ont4 |
| GO:0005856 | cytoskeleton | 2.05E-11 | 2.40 | 94 | 490 | CC |
| GO:0043292 | contractile fiber | 6.98E-09 | 5.85 | 22 | 58 | CC |
| GO:0030016 | myofibril | 1.96E-08 | 5.74 | 21 | 56 | CC |
| GO:0044449 | contractile fiber part | 2.58E-08 | 5.97 | 20 | 52 | CC |
| GO:0030017 | sarcomere | 4.95E-08 | 6.04 | 19 | 49 | CC |
| GO:0008092 | cytoskeletal protein binding | 3.69E-07 | 2.52 | 47 | 227 | MF |
| GO:0007519 | skeletal muscle development | 2.50E-06 | 4.13 | 20 | 65 | BP |
| GO:0015629 | actin cytoskeleton | 4.73E-06 | 3.08 | 27 | 111 | CC |
| GO:0003779 | actin binding | 7.52E-06 | 2.59 | 34 | 159 | MF |
| GO:0006936 | muscle contraction | 1.93E-05 | 4.22 | 16 | 51 | BP |
| GO:0044430 | cytoskeletal part | 2.23E-05 | 2.03 | 51 | 294 | CC |
| GO:0031674 | I band | 2.27E-05 | 5.67 | 12 | 32 | CC |
| GO:0003012 | muscle system process | 2.54E-05 | 4.11 | 16 | 52 | BP |
| GO:0030029 | actin filament-based process | 2.89E-05 | 2.73 | 27 | 119 | BP |
| GO:0007517 | muscle development | 5.06E-05 | 2.69 | 26 | 116 | BP |
| GO categories enriched in genes associated with myo tube-decreased peaks | ||||||
| GOID | Term | Pvalue | OR | Count | Size | Ont |
| GO:0044421 | extracellular region part | 4.59E-09 | 3.43 | 37 | 229 | CC |
| GO:0005576 | extracellular region | 1.88E-08 | 2.54 | 56 | 457 | CC |
| GO:0007167 | enzyme linked receptor protein signaling pathway | 7.88E-07 | 3.17 | 29 | 188 | BP |
| GO:0005615 | extracellular space | 1.70E-06 | 3.83 | 21 | 116 | CC |
| GO:0005125 | cytokine activity | 5.92E-06 | 6.08 | 12 | 45 | MF |
| GO:0007178 | transmembrane receptor protein ser/thr kinase signaling pathway | 6.24E-06 | 5.05 | 14 | 61 | BP |
| GO:0007166 | cell surface receptor linked signal transduction | 8.13E-06 | 2.09 | 53 | 504 | BP |
| GO:0007179 | transforming growth factor beta receptor signaling pathway | 1.18E-05 | 5.11 | 13 | 56 | BP |
| GO:0005102 | receptor binding | 2.31E-05 | 2.64 | 28 | 209 | MF |
| GO:0008284 | positive regulation of cell proliferation | 3.46E-05 | 3.56 | 17 | 98 | BP |
| GO:0042127 | regulation of cell proliferation | 9.33E-05 | 2.50 | 26 | 204 | BP |
A differentially bound peak was associated to the closest gene measured by distance to TSS within CTCF flanking domains. Analysis is performed based on unique Entrez ID.
OR: the odds ratio between the predicted and observed number of genes within the given GO category.
Count: the number of genes included in the differentially bound peaks.
Size: is the total number of genes for the given functional group.
Ont: is the Geneontology. BP stands for ‘biological process’; MF stands for ‘molecular function’, and CC stands for ‘cellular component’.
To determine whether motifs for specific transcription factors are associated with peaks that increase or decrease during myotube differentiation, we carried out a de novo motif search comparing myotube-increased peaks or myotube-decreased peaks to unchanged peaks. The myotube-increased peaks are enriched for E-boxes, MEF2-like sites (AAATAG), and Meis-like sites (CTGCCA), and depleted for AP1/fos-like motifs (TGAGTCA) and Sp1-like consensus (CCGCCC) (Fig. 3A). The myotube-decreased peaks are enriched for AP1/fos-like motifs and RP58-like motifs (ACATCTG) (Fig. 3B). Similar results were obtained using the conserved TRANSFAC binding sites (Supp. Table S3B).
Figure 3.

Characteristics of differentially bound regions between C2C12 myoblasts and myotubes. A) Motifs enriched (↑) and depleted (↓) in peaks that increase in C2C12 myotubes comparing to myoblasts. B) Motifs enriched in peaks that decrease in C2C12 myotubes comparing to myoblasts. C) and D) MyoD binding profiles at the Id2 and Id3 locus showed decreased binding of MyoD after differentiation. The characterized RP58 binding sites (Yokoyama et al, 2009) are indicated by vertical bars. E) Differentially bound peaks positively correlate with differentially expressed genes in 95% C2C12 myoblasts vs myotubes. The X and Y-axes correspond to the vsn-transformed number of reads in 95% confluent C2C12 myoblasts and myotubes in the combined peaks. Downregulated and upregulated genes are plotted in the left and right panels respectively. Note that in the left panel, data points are concentrated below the diagonal line, indicating that genes downregulated in myotubes have lower binding affinity in myotubes. In contrast, data points are concentrated above the diagonal line in the right panel, indicating that genes up-regulated in myotubes have stronger binding in myotubes. F) Differentially bound peaks do not correlate with differentially expressed genes in 50% vs 95% C2C12 myoblasts. Only the peaks associated with differentially expressed genes are plotted. The X and Y-axes correspond to the vsn-transformed number of reads in 50% and 95% myoblasts in the combined peaks. Downregulated and upregulated genes are plotted in the left and right panels respectively. Note that the points are relatively symmetrically distributed around the diagonal line, indicating that there is no correlation between the binding affinity and the mRNA expression levels.
AP1 has been shown to regulate muscle differentiation (Andreucci et al., 2002; Aoki et al., 1998), and RP58 expression is activated by MyoD and suppresses expression of Id2 and Id3 (Yokoyama et al, 2009). It is interesting to note that the RP58 binding sites that repress Id2 and Id3 overlap with the E-boxes in MyoD peaks that decrease with differentiation at these genes (Fig. 3C–D), suggesting that the MyoD induction of RP58 feeds-forward to repress MyoD binding.
Comparing our ChIP-seq data to a previous MyoD ChIP-on-chip study that identified 126 genes bound by MyoD in C2C12 myoblasts and/or myotubes (Blais et al., 2005), almost all of the MyoD-bound promoters they identified have MyoD peaks in our ChiP-seq study, their myotube-bound promoters tend to have peaks that increase with differentiation, and their myoblast-bound promoters tend to have peaks that decrease with differentiation (Supp. Fig. 3A), indicating reasonable agreement.
Association between differential binding and gene expression
To evaluate association between regions showing differential binding with gene expression, we used Illumina Mouse WG-6 Expression Bead Arrays to measure mRNA abundance in 50% confluent, 95% confluent, and differentiated C2C12 cells. Among the 45281 features represented on the array, 438 (0.96%) are differentially expressed between 50% and 95% C2C12 myoblasts, and 1956 (4.3%) are differentially expressed between 95% confluent C2C12 myoblasts and myotubes (FDR < 0.05 and a two-fold difference). GSEA showed that genes up-regulated in myotubes compared to 95% confluent myoblasts are enriched for muscle development and cytoskeleton GO categories, whereas genes downregulated in myotubes are enriched for cell cycle and cell division related GO categories (Supp. Table S4). Up-regulated genes were significantly associated with a peak that increased with differentiation (64% of peaks associated with up-regulated genes showed increased binding (p = 10−82)), and 63% of peaks associated with down-regulated genes decreased with differentiation (p = 10−19) (Fig. 3E). In contrast, GSEA did not show significant enrichment in any GO categories when comparing 50% and 95% confluent myoblasts and there was no clear correlation between expression and differential binding (Fig. 3F).
Although upregulated genes were significantly associated with peaks that increased with differentiation, absolute peak height was not a good predictor of sites associated with genes regulated by MyoD. One method to determine the accuracy of peak height as a discriminator of function is to calculate the Area Under a Receiver Operating Characteristic curve (AUROC). Comparing peak heights within 2 kb of upregulated promoters to non-regulated promoters of expressed or non-expressed genes yielded AUROC values of 0.64 and 0.66, respectively (Supp. Fig. S3B–C), where 0.50 would represent no discriminatory power. For example, a height threshold of 30 would identify 56% of regulated promoters and 33-30% of non-regulated promoters. The discriminatory power of peak height to predict local promoter regulation increased slightly when we assessed peaks within the domain flanked by CTCF binding, with AUROC values of 0.7 and 0.73 comparing regulated promoters to non-regulated expressed and non-expressed promoters, respectively (Supp. Fig. S3D–F); and was 0.77 compared to intergenic domains bounded by CTCF (Supp. Fig. S3H). In this case, a peak height threshold of 50 would identify 58% of regulated promoters but also 24–29% of non-regulated promoters and 19% of intergenic regions. Therefore, while there is a trend toward higher peaks near regulated genes, peak height is neither a sensitive nor specific discriminator of function.
MyoD binding in primary muscle cells and fibroblasts expressing MyoD
To determine whether our findings in the C2C12 myoblast cell line are representative of primary muscle cells, we performed similar ChIP-seq on myoblasts isolated from the leg muscles of an adult mouse and differentiated to myotubes in vitro. In addition, because expression of MyoD converts mouse embryonic fibroblasts (MEFs) to skeletal muscle, we also performed ChIP-seq for MyoD binding in MEFs transduced with a retrovirus expressing MyoD (MyoD-MEFs) at levels comparable to C2C12 cells. Each sample had a similar number of mappable reads, and using a twelve-read cut-off that identifies 25956 peaks in C2C12 myotubes, the primary myotubes have 39075 binding regions, and the MyoD-MEFs have 23286 MyoD binding regions. The three binding profiles (C2C12 myotubes, primary myotubes, and MyoD-MEFs) showed a high degree of similarity, with Pearson correlation coefficient of 0.75 between C2C12 myotubes and MyoD-MEFs, 0.67 between C2C12 myotubes and primary myotubes, and 0.63 between MyoD-MEFs and primary myotubes (Supp. Fig. S4A). Among the peaks with twelve or more reads in C2C12 myotubes, 93% and 90% have at least six reads in the same regions in MyoD-MEFs and in primary myotubes, respectively (Fig. 4A), which increases to 96% and 97% when only considering peaks that increase with differentiation (Fig. 4B). Similarly, 73% and 82% of the peaks in primary myotubes have at least six reads in the same regions in C2C12 myotubes or in MyoD-MEFs, respectively (data not shown), reflecting a larger number of peaks in primary myotubes. Examination of several MyoD-regulated genes also showed that the MyoD binding regions in the three different types of muscle cells were very similar, although some binding regions varied among the muscle cell types (Fig. 4C–F). Therefore, the MyoD binding regions are extremely similar in C2C12 cells, primary muscle cells, and MEFs transduced with MyoD.
Figure 4.

MyoD binding in primary myotubes and fibroblasts. A) The MyoD binding regions are largely shared between C2C12 Myotubes (open circle) and primary myotubes (open triangle), or mouse embryonic fibroblasts expressing MyoD (cross). To assess the concordance between C2C12 myotubes and the other two types of myotubes, MyoD bound regions in C2C12 myotubes with at least 12 coverage were treated as reference, and the proportion of peaks that were also present in primary myotubes or fibroblasts expressing MyoD at each given cutoff was plotted. B) Plot is similar to A), except that the analysis was restricted to the peaks present in C2C12 myotubes that increased in coverage during differentiation, indicating a high similarity in this set of peaks that are associated with differentially expressed genes (see Fig. 4A). C), D), E) and F) show the MyoD binding profiles at the Acta1, Tnnc2, Actc1 and Mef2a loci.
Functional assessment of genome-wide MyoD binding
To determine whether all identified MyoD binding sites represent classic enhancer elements, we selected 25 isolated peaks covering conserved regions that increased, decreased, or did not change peak height with differentiation, and cloned regions (ranging from 204 to 567 nt under the center of the peak that maximized the inclusion of evolutionarily conserved sequences) into a reporter construct that contains the SV40 promoter driving luciferase (pGL3-promoter), and enhancer activity was measured in C2C12 myoblasts and myotubes. Although some regions showed enhancer activity in this assay (five of eleven intragenic regions and five of fourteen intergenic regions), the majority of MyoD binding regions did not show standard enhancer activity (Supp. Fig. S4B–C).
To determine whether the genome-wide binding of MyoD might alter regional chromatin structure, we assessed histone H3 lysine 4 tri-methylation (H3K4me3) and histone H4 acetylation (H4Ac), a marker of active promoters and a modification broadly associated with active chromatin at both enhancers and promoters (Heintzman et al., 2007). We performed ChIP-seq for these modifications in MEFs without MyoD and MyoD-MEFs differentiated to skeletal muscle, permitting us to compare the same genomic region with or without MyoD binding. We used a 500 nt sliding window across the genome to identify regional changes in histone modifications between MEFs and MyoD-MEFs, and plotted the degree of change against the number of MyoD reads in the MyoD-MEFs. H3K4me3 showed very little increase at MyoD bound regions genome-wide (Fig. 5A), consistent with the expression array data indicating that MyoD regulates transcription of approximately 4% of the tiled genes and the fact the most of the binding sites are not in the promoter regions that are H3K4me3 in actively transcribed genes. In contrast, there was a substantial increase in H4Ac at regions bound by MyoD (Fig. 5B). This was not secondary to a nonspecific increase in histone acetylation because regions not bound by MyoD did not show a shift to increased acetylation (left most part of Figure 5B), nor did regions bound by another DNA binding factor, CTCF, show increased levels of either H3K4me3 or H4Ac in the MyoD-MEFs (Supp. Fig. S5A–B).
Figure 5.
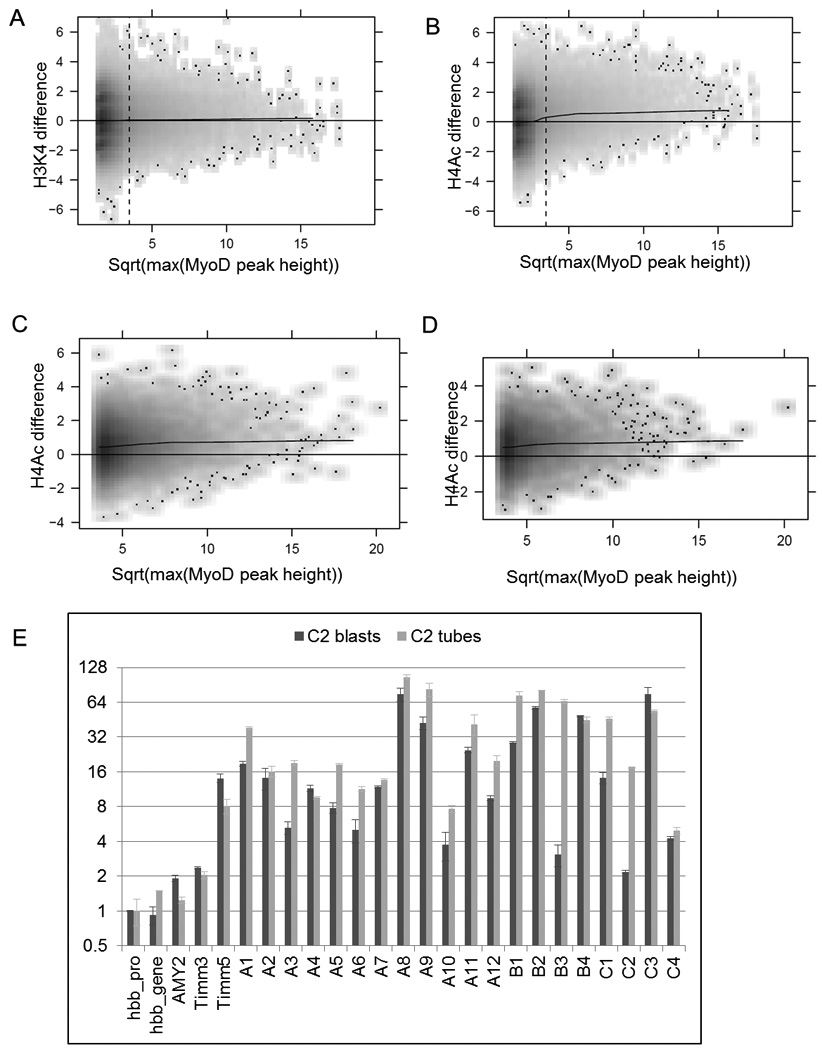
MyoD induces histone H4 acetylation at binding sites genome-wide. A) Expression of MyoD does not induce changes in H3K4me3 at the majority of binding sites genome-wide. The difference of total H3K4me3 reads between MyoD-MEFs and MEFs in a 500 nt sliding window (Y-axis) was plotted against the square root of maximal MyoD peak height (X-axis) within the same sliding window across the genome. See Methods section for details. B) Expression of MyoD induces H4Ac at binding sites genome-wide. The plot is similar to A), except that the Y-axis is the H4Ac differences. C) Expression of MyoD increases H4Ac in MyoD bound regions. For each MyoD bound peak, the difference of total H4Ac reads between MyoD-MEFs and MEFs in a 500nt window centered at the peak summit (Y-axis) was plotted against the square root of maximal MyoD peak height (X-axis) D) Similar to C except that only the intergenic MyoD binding peaks are considered. E) C2 myoblasts and myotubes have increased H4Ac at MyoD binding sites. Quantitative real-time PCRs were performed at 20 loci on H4Ac ChIP samples from C2C12 myoblasts and myotubes. Hbb promoter region was used as a baseline control. The fold enrichments were calculated relative to the amount of input chromatin. The error bars indicate the difference between the duplicate measurements for the particular experiments. Hbb, Hemoglobin-beta; AMY2, Amylase 2; A1-A12, intergenic regions; B1-B4, promoter regions; C1-C4, intron regions. See Suppl. Table S1 for ChIP-seq and qPCR measurement of MyoD binding at these regions.
To determine whether the MyoD-associated H4Ac changes occurred at intergenic regions as well as gene associated regions, we plotted the change in H4Ac reads in a 500 nt window centered on the location of MyoD peaks, either at all sites in the genome, only intergenic sites (defined as more than 10 Kb from an annotated gene), or MyoD binding sites in the MyoD-MEFs that intersect with intergenic constitutively bound sites in C2C12 myoblasts and myotubes. MyoD binding at regions throughout the genome was associated with increased H4Ac (Fig. 5C–D), including the intergenic binding sites corresponding to unchanged peaks in C2C12 cells (Supp. Fig. S5C).
Finally, we performed H4Ac ChIP and locus specific real-time qPCR to assess acetylation at a set of MyoD binding sites in C2C12 myoblasts and myotubes. When compared to the promoter of the inactive hemoglobin-beta (Hbb) gene, the intergenic MyoD binding regions showed a four- to 105-fold enrichment of H4Ac (Fig 5E, regions A1-A12). Similar enrichments were seen at binding sites in promoter regions (regions B1-B4) and introns (regions C1-C4). For most of the sampled regions, the MyoD peak height was approximately the same in myoblasts and myotubes (see Supp. Table 1A) and the H4Ac enrichment was similar in myoblasts and myotubes. At the two regions where MyoD binding substantially increased with differentiation (B3 and C2), the degree of H4Ac also increased substantially with differentiation. The degree of H4Ac enrichment at the MyoD binding sites compared favorably to the enrichment at the promoter of the constitutively expressed Timm17b gene, which ranged from eight- to fourteen-fold. Therefore, the genome-wide binding of MyoD in C2C12 myoblasts and myotubes is associated with regional histone acetylation, indicating a genome-wide role for MyoD in broadly reprogramming the epigenetic state of the specified myoblast.
DISCUSSION
Our study identifies approximately 60000 MyoD binding sites in non-repetitive regions of autosomal chromosomes. Including the sex chromosomes would modestly increase the number of sites, whereas including binding to repetitive regions could substantially increase the number and distribution of MyoD binding sites in the genome. Using our very conservative requirement for twelve overlapping reads to identify a MyoD binding site, somewhere between 41% and 74% of genes are associated with a MyoD binding region, and it is likely that with looser stringency and including repetitive elements these already high percentages would be further increased.
There is a positive correlation between regulated MyoD binding (i.e., sites that are preferentially bound in myoblasts or differentiated myotubes) and gene expression. This suggests that sites regulating gene transcription in myotubes require additional factors to modulate MyoD binding. Indeed, the sites associated with myotube expressed genes are enriched for motifs of factors that are activated by MyoD and function with MyoD in a positive feed-forward circuit, as demonstrated previously with Mef2 (Penn et al., 2004) and Myogenin (Cao et al., 2006). In addition, the Pbx/Meis complex cooperates with MyoD in activating a subset of genes (Berkes et al., 2004; Maves et al., 2007). Another finding was that genes decreasing expression with differentiation were associated with decreased MyoD binding at sites enriched for RP58 and AP1 motifs. A recent study (published after our analysis was complete) identified RP58 as a gene activated by MyoD during muscle differentiation that suppresses Id2 and Id3 transcription (Yokoyama et al., 2009), and our expression array time course data shows that RP58 is upregulated at 24 and 48 hrs of differentiation in C2C12 cells (data not shown). The RP58 binding sites that repress the Id genes overlap with MyoD binding sites in peaks that decrease with differentiation. Therefore, this strongly suggests that MyoD positively regulates Id expression in the myoblast and then, during differentiation, activates RP58, and RP58 suppresses MyoD binding through a negative feed-forward mechanism, an incoherent feed-forward loop that can provide fold-change detection (Goentoro et al., 2009). This would be consistent with our previous observation that Id RNAs are transiently induced when MyoD is expressed in MEFs (Bergstrom et al., 2002). Since we identified RP58 as associated with differentiation decreased MyoD peaks through a de novo motif search, it is likely that many other genes in addition to the Ids are similarly regulated.
Another interesting finding of our study is that the majority of sites are constitutively bound by MyoD in both myoblasts and myotubes. In general, these sites are not associated with MyoD-mediated changes in regional gene expression, based on expression arrays, regional H3K4me3, and preliminary studies on induced RNAs (Y. Cao, unpublished data). Studies of transcription factor binding in Drosophila also show binding at thousands of sites in the genome in addition to binding at regulated genes (Li et al., 2008; MacArthur et al., 2009). In this case, higher affinity binding occurred at regulated genes and lower affinity binding in regions not regulated by the factors, suggesting that the low affinity genome-wide binding might be “non-functional” in regard to direct transcriptional activation. In our study, peak height as a measure of affinity does not accurately discriminate between sites associated with transcriptionally regulated or non-regulated genes, and, while peaks at regulated genes trend higher than intergenic peaks, the same is true comparing peaks at non-regulated genes to intergenic peaks. Further, our demonstration that MyoD binding induces regional histone acetylation at sites throughout the genome, presumably through direct recruitment of histone acetyltransferases (Puri et al., 1997), indicates that MyoD binding has a functional consequence at these sites that is independent of regional regulation of transcription. The fact that the MyoD-recruited acetylation occurs at constitutively bound sites in myoblasts, indicates a role for MyoD in broadly modifying the chromatin structure of myoblasts. Future studies will be necessary to determine the biological function, if any, of these epigenetic changes in the specification of the myoblast lineage.
Our study is in general agreement with, and significantly extends, the previous profiling of global MyoD binding sites that used ChIP-chip technology (Blais et al., 2005; Cao et al., 2006). First, in the subset of promoter regions that can be directly compared between the studies, we identify MyoD binding in almost all of the promoter regions identified as bound in both studies (see Suppl. Fig. S3B and data not shown). Second, the prior ChIP-chip studies only surveyed the promoter regions of annotated genes, whereas the ChIP-seq technology allowed us to survey the entire genome. In fact, our study showed that approximately 24% of the MyoD peaks are located in the promoter-proximal regions (+/− 2 kb from TSS). This might be significant because a recent study has shown that the chromatin state at promoters is largely shared by different tissues, whereas tissue specific gene expression is highly correlated with the chromatin state of the enhancers located outside of the promoter region (Heintzman et al., 2009). Therefore, many of the functional MyoD binding sites might be outside of the promoter regions. Consistent with this hypothesis, although 24% of the peaks are located within the promoter proximal regions, only 10% of the differentially bound peaks are in these promoter regions.
The consensus E-box motif is present in 96% of the MyoD binding regions, and, as predicted from previous in vitro degenerate binding site selections, there is a preference for E-boxes with internal CC or GC sequences, with 89% of MyoD binding regions containing either CACCTG or CAGCTG sites. In vitro selection studies suggest that CACCTG is preferred by MyoD:E-protein heterodimers and CAGCTG by MyoD homodimers (Blackwell and Weintraub, 1990); however, homo and heterodimers can bind to either sequence. Prior studies suggested that the expression of Id proteins in myoblasts competed with MyoD for E-protein dimerization and limited the formation of MyoD:E-protein heterodimers (Benezra et al., 1990; Jen et al., 1992). In this regard, we have not distinguished heterodimer binding from homodimer binding in our study, but do note that, although there is an enrichment of the consensus heterodimer motif in peaks that increase with differentiation (data not shown), the E-box sequence does not accurately discriminate between constitutively bound sites and myotube specific sites. Therefore, if there is a shift between homodimer binding and heterodimer binding during differentiation, it is not obviously represented in the sequence of the bound E-box.
In summary, our findings add an interesting and challenging element to the consensus model for how myogenic bHLH transcription factors regulate myogenesis. Similar to the consensus model (Berkes and Tapscott, 2005), we find regulated binding at many genes activated by MyoD during myogenic differentiation and the association with motifs for Mef2 and other factors, consistent with prior ChIP-chip studies (Blais et al., 2005) and with a feed-forward temporal regulation of gene expression (Penn et al., 2004). The major finding not anticipated by the consensus model is the genome-wide MyoD binding associated with histone acetylation in both myoblasts and myotubes. Dynamic changes in nuclear organization are necessary for genes to be repositioned during differentiation (Hu et al., 2008; Kosak and Groudine, 2004; Kosak et al., 2007; Schoenfelder et al., 2010) and progenitor cell commitment requires a transition between two different ordered nuclear states (Rajapakse et al., 2009). Although speculative, the genome-wide binding of MyoD and associated histone acetylation might initiate new patterns of gene looping and chromosome architecture necessary for the transition between nuclear states.
EXPERIMENTAL PROCEDURES
Cell culture
C2C12 cells were grown in DMEM with 10% fetal bovine serum (Hyclone), and differentiation was induced at confluence in DMEM with 2% horse serum, 10 µg/mL insulin, and 10 µg/mL transferrin (differentiation media, DM) for 48 h. Mouse embryo Myf-5/MyoD null fibroblasts transduced with pCLBABE-Myod retrovirus or control pCLBABE retrovirus were maintained in DMEM with 2ug/ml puromycin and 10% bovine calf serum (Hyclone), and differentiation was induced at confluence in DM. Primary mouse myoblasts were isolated from adult mouse hindlimb muscle (see Supplementary Methods for details), cultured in Ham’s F10 media supplemented with 20% FBS, 2.5ng/ml bFGF, penicillin/streptomycin, and L-glutamine. Cells were differentiated for 3 days in DM before collection.
Chromatin Immunoprecipitation and ultra-high throughput sequencing
ChIP was performed as previously described (Bergstrom et al., 2002), with the exception that sonication was performed to generated final DNA fragments of 150–600bp. The three anti-MyoD polyclonal antibodies were previously characterized (Tapscott et al., 1988). ChIP DNA samples were prepared for sequencing according to the manufacture’s recommended protocol with two modifications: 1) DNA fragments ranging from 150bp to 300bp were selected at the gel selection step; 2) 21 cycles of PCR were done at the PCR amplification step instead of 18. The samples were sequenced using the Illumina Genome Analyzer II. Sequences were deposited in the NCBI Sequence Read Archive (www.ncbi.nlm.nih.gov/Traces/sra/), Study ID: SRP001761.2.
Defining peaks
We extracted the sequences using the Firecrest and Bustard programs from package GApipeline-0.3.0, and used MAQ (version 0.6.6) to align reads to the mouse reference genome (NCBI v37, mm9). We allowed up to 2 mismatches in the first 28bp seed regions. We discarded reads with MAQ score less than 15, which eliminates most reads mapping to multiple loci in the reference genome. To minimize artifacts of PCR amplification during sample preparation, we retained only one copy of any duplicated sequence. Preliminary analysis showed strong agreement among data from the three antisera. Therefore, for the same sample condition, we combined reads from all 3 antisera in our study. For the purpose of identifying peaks, we extended each read to a total of 200bp in the sequencing orientation. We calculated coverage for each genomic position as the number of (extended) reads that overlap with the position. To identify a reasonable coverage cutoff, we considered the distribution of the maximum coverage depth within an island (defined as a contiguous region of coverage 1 or more). We assumed a Poisson null distribution (reads sampled uniformly from the genome) and estimated the Poisson parameters based on the number of islands with coverage one and two. Given this, we estimated the false discovery rate (FDR) at any given cutoff by the ratio of the expected and observed number of islands at that cutoff. Simulation studies suggest that the estimated false discovery rates are relatively conservative. Data from the pre-immune control sample fits the Poisson distribution well in general, except for a few high peaks that were present in all samples. We consequently removed any peaks whose coverage was within four fold of the control sample coverage. Based on this Poisson analysis, peak cutoffs of 6 and 12 provide FDR of approximately 0.012 and 10−7, respectively. We used the very stringent threshold of 12 to define peaks for further analysis. For each peak, we define the peak summit to be the location with maximum coverage. We used the 200 bp regions centered at the peak summits for sequence/motif analysis (see below), and used the midpoint of the peak summits to calculate the distance from peaks to other genomic locations, e.g., gene transcription start sites.
Control data selection
To evaluate the sequence signal of myotube peaks, we created a control dataset to serve as a comparison. We selected a set of singleton reads with size equal to the number of myotube peaks. This dataset was chosen so that it also shares the same distribution of distance to TSS and has similar distribution among genes, introns, exons, and intergenic regions as the myotube peaks. This control dataset effectively adjusts for the TSS bias in the myotube peaks, as well as the potential sequencing alignment bias, so that comparisons of myotube peaks and the control are not affected by these two factors.
Gene context analysis
We collected gene annotation from the UCSC browser (mm9, July 2007) known gene track. We first identified the peaks within the promoter regions (+/− 500 bp from TSS). We then assigned the remaining peaks to the 3' end (+/− 500 bp from 3' end of the transcripts), exon, intron, upstream (−500 bp to −10 kb of transcription start sites), downstream (+500 bp to +10 kb from 3' end of the transcripts) and intergenic regions (with distance greater than 10 kb from any transcript). Proximal promoter regions were defined as regions within +/−2 kb of a TSS. Therefore, each peak may be assigned to multiple categories, except those within the promoters.
Association of MyoD binding sites to genes
We associated a peak to its closest transcription start site (TSS) within the region flanked by CTCF binding sites, which were identified in a ChIP-seq experiment on mouse embryonic stem cells (GEO accession number GSM288351). The original CTCF peaks were translated from mm8 to mm9 with the UCSC Liftover tool.
Detection of differential peaks
To compare two ChIP-seq samples, we combine them, treating the combined data as if it were from a single sample, then call peaks as described above. Although this may favor false positives, we want to find all peaks and are willing to accommodate a small number of additional regions that are not peaks, but have some hallmarks of a peak. For each of the potential peak regions, we obtain the number of reads in one sample (xi) and in the other (yi), and fit them to the regression model f(yi) ~ f(xi), where f is an appropriate log-scale transformation. The intercept in the regression model may be interpreted as an adjustment for unequal sample sizes (number of reads); more data equates to a scale factor in the xi or yi values, which translates to an additive shift on the log scale.
We used this approach to compare myotube to myoblast using the variance stabilization and normalization transformation (VSN) (Huber et al., 2002). VSN is essentially at log scale, and we mainly care about the intercept. For robustness, we used the median of di = f(yi) - f(xi) as an estimate of the intercept, and the median absolute deviation (mad) of di as an estimate of standard deviation. The residuals are calculated as (di -med(di))/mad(di). A peak is considered to be differentially bound if the absolute value of the residual is greater than 1.64, which corresponds to a 95% confidence interval if the residuals follow a normal distribution.
Our approach has several advantages. First, peak-calling in the combined samples, as opposed each sample separately, avoids comparing peaks with different boundaries in the two samples. The regression approach is also appealing because it frames the problem in the familiar context of classical statistics, where a series of observations are made on a number of experimental units. In the ChIP-seq scenario, the experimental units are peaks as defined above, and observations associated with each peak include the number of reads overlapping that peak. The analogy is less than perfect because the experimental units, in this case (peaks), are determined from the data itself. However, we do not expect this to be problematic, as peaks corresponding to strong binding sites would usually be identified correctly, and those with weak signal in both samples would either be unidentified, or deemed not significantly different. The regression approach is even more appealing in situations where the experimental units are independently defined, such as promoter regions, or computationally predicted transcription factor binding sites. Additionally, it admits inclusion of other covariates such as local GC content, if desired.
Motif analysis
We have developed a discriminative motif discovery tool especially designed for ChIP-Seq application. We formulate the motif search problem in a regression framework. The training datasets include a positive set that contains putative transcription factor binding sites (e.g., regions under peaks), and a negative set that provides appropriate background (e.g., the control data set above). The goal is to find a motif whose occurrences best discriminate between the positive and negative datasets. Unlike other motif search methods that model a motif by a position weight matrix (PWM) or a consensus pattern using IUPAC codes, we define a motif simply as a collection of oligonucleotides. (Note that the motif logos presented in the figures are visual summaries of the mono- and dinucleotide frequencies of the oligos in these collections, not the collections themselves.) This “collection of oligos” representation of motifs is very flexible, and is capable of describing arbitrary dependencies among different positions in motifs, which cannot be captured by traditional motif models. The main drawback of this model is the large search space. To address this problem, we used a greedy algorithm to navigate the search space, and tested for statistical significance at every step to avoid over-fitting. With our large ChIP-seq training sets, this approach enables us to capture subtle but statistically significant signals. The regression framework also enables us to add additional regression terms to counter possible biases the in positive or negative datasets, such as GC content. For given length n, the method first enumerates all n-mers, and uses the frequencies of each n-mer to fit a logistic regression model, where the response specifies whether a sample is from the positive or the negative set. The most statistically significant n-mer is chosen as the seed for the top motif. We then try all variants of the seed within a given Hamming distance (1 or 2), and add them to the motif if the combined motif frequencies fit the regression model better. After exhausting all the variants, we extend the motif one position at a time, trying all four choices A, C, G, T and exclude each extended pattern iteratively if the remaining set is more statistically significant. After refining the top motif, we mask all its occurrences in the sequence dataset, and repeat the whole process to find the next motif. The ranks for patterns that overlap with previous motifs tend to drop significantly after masking, which prevents reporting redundant motifs. We used this method in several contexts. For example, to discover motifs that associate with myotube peaks, we selected the 200 bases centered at the summit of each myotube peak versus the 200 bases of each extended read in the control data set described above. Similarly, in the myoblast/myotube comparison, we used this method to discover motifs that discriminate between peaks that increase (and, separately, decrease) upon differentiation into myotubes versus those that are present in both but remain unchanged in height. In both comparisons, the positive sets were selected from peaks determined to be differentially increased (decreased, resp.) as described above, and the negative set is unchanged peaks outside CpG islands with absolute differential residuals within 0.2.
GO analysis
Gene set enrichment analysis (GSEA) was performed using the Bioconductor GOstats package (Falcon and Gentleman, 2007; Gentleman et al., 2004). This method computes hypergeometric p-values for over- or under-representation of each GO term in the specified ontology for the gene set of interest. Each gene is represented by a unique Entrez ID, and genes with no Entrez ID were not included in this analysis. The annotation of genes is based on the Bioconductor annotation package org.Mm.eg.db.
TRANSFAC analysis
Conserved transcription factor binding sites were collected from the UCSC browser (contributed by TRANSFAC) for the human genome (hg18). We successfully lifted 98% of sites to the mouse genome (mm9). The frequency of each conserved TRANSFAC binding site in the myotube peaks (200bp centered on the summits) and the control regions were counted.
Detection of differential histone modification state
To evaluate global H4Ac changes, we scanned the entire genome with a 500 bp sliding window with 250 bp overlap. In each window, we counted the number of overlapping H4Ac reads in MEF expressing MyoD and MEF control. We took the square root of the number of H4Ac reads in each sample, and fit a local regression curve on the difference of the two vs the mean, to adjust for any potential bias due to relative abundance of H4Ac in the two samples. The residual is defined as the difference after subtraction of this local correction divided by the standard deviation. Similar analysis was performed on H3K4me, and was associated with the MyoD/CTCF binding.
Microarray analysis
Triplicate total RNA samples were collected from 50% confluent proliferating C2C12 cells, 95% confluent C2C12 cells, and C2C12 cells differentiated for 2 days. Samples were analyzed by Illumina Mouse Whole Genome arrays. Probe intensities were corrected, normalized and summarized by the Lumi package of Bioconductor (Du et al., 2008). Differentially expressed genes were identified by the LIMMA package of Bioconductor (Smyth, 2004). GEO accession number GSE20059 (www.ncbi.nlm.nih.gov/geo/).
Supplementary Material
ACKNOWLEDGEMENTS
We thank M. Groudine, R. Eisenman, F.J. Dilworth for comments on the manuscript and H. Rincon for technical advice. This work was supported by NIH NIAMS R01AR045113, P41-HG004059, NIEHS P30ES07033, the FHCRC BioShared Resource and Synergy Fund.
Footnotes
Publisher's Disclaimer: This is a PDF file of an unedited manuscript that has been accepted for publication. As a service to our customers we are providing this early version of the manuscript. The manuscript will undergo copyediting, typesetting, and review of the resulting proof before it is published in its final citable form. Please note that during the production process errors may be discovered which could affect the content, and all legal disclaimers that apply to the journal pertain.
REFERENCE
- Andreucci JJ, Grant D, Cox DM, Tomc LK, Prywes R, Goldhamer DJ, Rodrigues N, Bedard PA, McDermott JC. Composition and function of AP-1 transcription complexes during muscle cell differentiation. J Biol Chem. 2002;277:16426–16432. doi: 10.1074/jbc.M110891200. [DOI] [PubMed] [Google Scholar]
- Aoki K, Meng G, Suzuki K, Takashi T, Kameoka Y, Nakahara K, Ishida R, Kasai M. RP58 associates with condensed chromatin and mediates a sequence-specific transcriptional repression. J Biol Chem. 1998;273:26698–26704. doi: 10.1074/jbc.273.41.26698. [DOI] [PubMed] [Google Scholar]
- Asakura A, Lyons GE, Tapscott SJ. The regulation of MyoD gene expression: conserved elements mediate expression in embryonic axial muscle. Dev Biol. 1995;171:386–398. doi: 10.1006/dbio.1995.1290. [DOI] [PubMed] [Google Scholar]
- Benezra R, Davis RL, Lockshon D, Turner DL, Weintraub H. The protein Id: a negative regulator of helix-loop-helix DNA binding proteins. Cell. 1990;61:49–59. doi: 10.1016/0092-8674(90)90214-y. [DOI] [PubMed] [Google Scholar]
- Bergstrom DA, Penn BH, Strand A, Perry RL, Rudnicki MA, Tapscott SJ. Promoter-specific regulation of MyoD binding and signal transduction cooperate to pattern gene expression. Mol Cell. 2002;9:587–600. doi: 10.1016/s1097-2765(02)00481-1. [DOI] [PubMed] [Google Scholar]
- Berkes CA, Bergstrom DA, Penn BH, Seaver KJ, Knoepfler PS, Tapscott SJ. Pbx marks genes for activation by MyoD indicating a role for a homeodomain protein in establishing myogenic potential. Mol Cell. 2004;14:465–477. doi: 10.1016/s1097-2765(04)00260-6. [DOI] [PubMed] [Google Scholar]
- Berkes CA, Tapscott SJ. MyoD and the transcriptional control of myogenesis. Semin Cell Dev Biol. 2005;16:585–595. doi: 10.1016/j.semcdb.2005.07.006. [DOI] [PubMed] [Google Scholar]
- Blackwell TK, Weintraub H. Differences and similarities in DNA-binding preferences of MyoD and E2A protein complexes revealed by binding site selection. Science. 1990;250:1104–1110. doi: 10.1126/science.2174572. [DOI] [PubMed] [Google Scholar]
- Blais A, Tsikitis M, Acosta-Alvear D, Sharan R, Kluger Y, Dynlacht BD. An initial blueprint for myogenic differentiation. Genes Dev. 2005;19:553–569. doi: 10.1101/gad.1281105. [DOI] [PMC free article] [PubMed] [Google Scholar]
- Blau HM, Chiu CP, Webster C. Cytoplasmic activation of human nuclear genes in stable heterocaryons. Cell. 1983;32:1171–1180. doi: 10.1016/0092-8674(83)90300-8. [DOI] [PubMed] [Google Scholar]
- Cao Y, Kumar RM, Penn BH, Berkes CA, Kooperberg C, Boyer LA, Young RA, Tapscott SJ. Global and gene-specific analyses show distinct roles for Myod and Myog at a common set of promoters. EMBO J. 2006;25:502–511. doi: 10.1038/sj.emboj.7600958. [DOI] [PMC free article] [PubMed] [Google Scholar]
- Davis RL, Cheng PF, Lassar AB, Weintraub H. The MyoD DNA binding domain contains a recognition code for muscle-specific gene activation. Cell. 1990;60:733–746. doi: 10.1016/0092-8674(90)90088-v. [DOI] [PubMed] [Google Scholar]
- Du P, Kibbe WA, Lin SM. lumi: a pipeline for processing Illumina microarray. Bioinformatics. 2008;24:1547–1548. doi: 10.1093/bioinformatics/btn224. [DOI] [PubMed] [Google Scholar]
- Falcon S, Gentleman R. Using GOstats to test gene lists for GO term association. Bioinformatics. 2007;23:257–258. doi: 10.1093/bioinformatics/btl567. [DOI] [PubMed] [Google Scholar]
- Gentleman RC, Carey VJ, Bates DM, Bolstad B, Dettling M, Dudoit S, Ellis B, Gautier L, Ge Y, Gentry J, et al. Bioconductor: open software development for computational biology and bioinformatics. Genome Biol. 2004;5:R80. doi: 10.1186/gb-2004-5-10-r80. [DOI] [PMC free article] [PubMed] [Google Scholar]
- Goentoro L, Shoval O, Kirschner MW, Alon U. The incoherent feedforward loop can provide fold-change detection in gene regulation. Mol Cell. 2009;36:894–899. doi: 10.1016/j.molcel.2009.11.018. [DOI] [PMC free article] [PubMed] [Google Scholar]
- Goldhamer DJ, Faerman A, Shani M, Emerson CP., Jr Regulatory elements that control the lineage-specific expression of myoD. Science. 1992;256:538–542. doi: 10.1126/science.1315077. [DOI] [PubMed] [Google Scholar]
- Heintzman ND, Hon GC, Hawkins RD, Kheradpour P, Stark A, Harp LF, Ye Z, Lee LK, Stuart RK, Ching CW, et al. Histone modifications at human enhancers reflect global cell-type-specific gene expression. Nature. 2009;459:108–112. doi: 10.1038/nature07829. [DOI] [PMC free article] [PubMed] [Google Scholar]
- Heintzman ND, Ren B. Finding distal regulatory elements in the human genome. Curr Opin Genet Dev. 2009;19:541–549. doi: 10.1016/j.gde.2009.09.006. [DOI] [PMC free article] [PubMed] [Google Scholar]
- Heintzman ND, Stuart RK, Hon G, Fu Y, Ching CW, Hawkins RD, Barrera LO, Van Calcar S, Qu C, Ching KA, et al. Distinct and predictive chromatin signatures of transcriptional promoters and enhancers in the human genome. Nat Genet. 2007;39:311–318. doi: 10.1038/ng1966. [DOI] [PubMed] [Google Scholar]
- Hu Q, Kwon YS, Nunez E, Cardamone MD, Hutt KR, Ohgi KA, Garcia-Bassets I, Rose DW, Glass CK, Rosenfeld MG, Fu XD. Enhancing nuclear receptor-induced transcription requires nuclear motor and LSD1-dependent gene networking in interchromatin granules. Proc Natl Acad Sci U S A. 2008;105:19199–19204. doi: 10.1073/pnas.0810634105. [DOI] [PMC free article] [PubMed] [Google Scholar]
- Huang J, Blackwell TK, Kedes L, Weintraub H. Differences between MyoD DNA binding and activation site requirements revealed by functional random sequence selection. Mol Cell Biol. 1996;16:3893–3900. doi: 10.1128/mcb.16.7.3893. [DOI] [PMC free article] [PubMed] [Google Scholar]
- Huber W, von Heydebreck A, Sultmann H, Poustka A, Vingron M. Variance stabilization applied to microarray data calibration and to the quantification of differential expression. Bioinformatics. 2002;18 Suppl 1:S96–S104. doi: 10.1093/bioinformatics/18.suppl_1.s96. [DOI] [PubMed] [Google Scholar]
- Jen Y, Weintraub H, Benezra R. Overexpression of Id protein inhibits the muscle differentiation program: in vivo association of Id with E2A proteins. Genes Dev. 1992;6:1466–1479. doi: 10.1101/gad.6.8.1466. [DOI] [PubMed] [Google Scholar]
- Kosak ST, Groudine M. Form follows function: The genomic organization of cellular differentiation. Genes Dev. 2004;18:1371–1384. doi: 10.1101/gad.1209304. [DOI] [PubMed] [Google Scholar]
- Kosak ST, Scalzo D, Alworth SV, Li F, Palmer S, Enver T, Lee JS, Groudine M. Coordinate gene regulation during hematopoiesis is related to genomic organization. PLoS Biol. 2007;5:e309. doi: 10.1371/journal.pbio.0050309. [DOI] [PMC free article] [PubMed] [Google Scholar]
- Li XY, MacArthur S, Bourgon R, Nix D, Pollard DA, Iyer VN, Hechmer A, Simirenko L, Stapleton M, Luengo Hendriks CL, et al. Transcription factors bind thousands of active and inactive regions in the Drosophila blastoderm. PLoS Biol. 2008;6:e27. doi: 10.1371/journal.pbio.0060027. [DOI] [PMC free article] [PubMed] [Google Scholar]
- MacArthur S, Li XY, Li J, Brown JB, Chu HC, Zeng L, Grondona BP, Hechmer A, Simirenko L, Keranen SV, et al. Developmental roles of 21 Drosophila transcription factors are determined by quantitative differences in binding to an overlapping set of thousands of genomic regions. Genome Biol. 2009;10:R80. doi: 10.1186/gb-2009-10-7-r80. [DOI] [PMC free article] [PubMed] [Google Scholar]
- Maves L, Waskiewicz AJ, Paul B, Cao Y, Tyler A, Moens CB, Tapscott SJ. Pbx homeodomain proteins direct Myod activity to promote fast-muscle differentiation. Development. 2007;134:3371–3382. doi: 10.1242/dev.003905. [DOI] [PubMed] [Google Scholar]
- Penn BH, Bergstrom DA, Dilworth FJ, Bengal E, Tapscott SJ. A MyoD-generated feedforward circuit temporally patterns gene expression during skeletal muscle differentiation. Genes Dev. 2004;18:2348–2353. doi: 10.1101/gad.1234304. [DOI] [PMC free article] [PubMed] [Google Scholar]
- Puri PL, Sartorelli V, Yang XJ, Hamamori Y, Ogryzko VV, Howard BH, Kedes L, Wang JY, Graessmann A, Nakatani Y, Levrero M. Differential roles of p300 and PCAF acetyltransferases in muscle differentiation. Mol Cell. 1997;1:35–45. doi: 10.1016/s1097-2765(00)80005-2. [DOI] [PubMed] [Google Scholar]
- Rajapakse I, Perlman MD, Scalzo D, Kooperberg C, Groudine M, Kosak ST. The emergence of lineage-specific chromosomal topologies from coordinate gene regulation. Proc Natl Acad Sci U S A. 2009;106:6679–6684. doi: 10.1073/pnas.0900986106. [DOI] [PMC free article] [PubMed] [Google Scholar]
- Rampalli S, Li L, Mak E, Ge K, Brand M, Tapscott SJ, Dilworth FJ. p38 MAPK signaling regulates recruitment of Ash2L–containing methyltransferase complexes to specific genes during differentiation. Nat Struct Mol Biol. 2007;14:1150–1156. doi: 10.1038/nsmb1316. [DOI] [PMC free article] [PubMed] [Google Scholar]
- Richler C, Yaffe D. The in vitro cultivation and differentiation capacities of myogenic cell lines. Dev Biol. 1970;23:1–22. doi: 10.1016/s0012-1606(70)80004-5. [DOI] [PubMed] [Google Scholar]
- Schoenfelder S, Sexton T, Chakalova L, Cope NF, Horton A, Andrews S, Kurukuti S, Mitchell JA, Umlauf D, Dimitrova DS, et al. Preferential associations between co-regulated genes reveal a transcriptional interactome in erythroid cells. Nat Genet. 2010;42:53–61. doi: 10.1038/ng.496. [DOI] [PMC free article] [PubMed] [Google Scholar]
- Smyth GK. Linear models and empirical bayes methods for assessing differential expression in microarray experiments. Stat Appl Genet Mol Biol. 2004;3 doi: 10.2202/1544-6115.1027. Article3. [DOI] [PubMed] [Google Scholar]
- Tam JL, Triantaphyllopoulos K, Todd H, Raguz S, de Wit T, Morgan JE, Partridge TA, Makrinou E, Grosveld F, Antoniou M. The human desmin locus: gene organization and LCR-mediated transcriptional control. Genomics. 2006;87:733–746. doi: 10.1016/j.ygeno.2006.01.009. [DOI] [PubMed] [Google Scholar]
- Tapscott SJ. The circuitry of a master switch: Myod and the regulation of skeletal muscle gene transcription. Development. 2005;132:2685–2695. doi: 10.1242/dev.01874. [DOI] [PubMed] [Google Scholar]
- Tapscott SJ, Davis RL, Thayer MJ, Cheng PF, Weintraub H, Lassar AB. MyoD1: a nuclear phosphoprotein requiring a Myc homology region to convert fibroblasts to myoblasts. Science. 1988;242:405–411. doi: 10.1126/science.3175662. [DOI] [PubMed] [Google Scholar]
- Tapscott SJ, Lassar AB, Weintraub H. A novel myoblast enhancer element mediates MyoD transcription. Mol Cell Biol. 1992;12:4994–5003. doi: 10.1128/mcb.12.11.4994. [DOI] [PMC free article] [PubMed] [Google Scholar]
- Weintraub H, Dwarki VJ, Verma I, Davis R, Hollenberg S, Snider L, Lassar A, Tapscott SJ. Muscle-specific transcriptional activation by MyoD. Genes Dev. 1991;5:1377–1386. doi: 10.1101/gad.5.8.1377. [DOI] [PubMed] [Google Scholar]
- Yaffe D. Retention of differentiation potentialities during prolonged cultivation of myogenic cells. Proc Natl Acad Sci U S A. 1968;61:477–483. doi: 10.1073/pnas.61.2.477. [DOI] [PMC free article] [PubMed] [Google Scholar]
Associated Data
This section collects any data citations, data availability statements, or supplementary materials included in this article.