

Schlemm's canal and the collector channels were imaged with spectral domain optical coherence tomography (SD-OCT). Doppler flow measurement was used to confirm the location and identity of these structures.
Abstract
Purpose.
Measurements of human Schlemm's canal (SC) have been limited to histologic sections. The purpose of this study was to demonstrate noninvasive measurements of aqueous outflow (AO) structures in the human eye, examining regional variation in cross-sectional SC areas (on/off collector channel [CC] ostia [SC/CC] and nasal/temporal) in the eyes of living humans.
Methods.
SC was imaged by spectral-domain optical coherence tomography with a 200-nm bandwidth light source. Both eyes of 21 healthy subjects and one glaucomatous eye of three subjects were imaged nasally and temporally. Contrast and magnification were adjusted to maximize visualization. Cross-sectional SC on and off SC/CC was traced three times by two independent masked observers using ImageJ (ImageJ 1.40g, http://rsb.info.nih.gov/ij/ Wayne Rasband, developer, National Institutes of Health, Bethesda, MD). The mean SC area was recorded. A linear mixed-effects model was used to analyze eye, nasal/temporal laterality, and SC area on or off SC/CC.
Results.
SC area was significantly larger on SC/CCs than off (12,890 vs. 7,391 μm2, P < 0.0001) and was significantly larger on the nasal side than on the temporal (10,983 vs. 8,308 μm2, P = 0.009). SC areas were significantly smaller in glaucoma patients than in normal subjects, whether pooled (P = 0.0073) or grouped by on (P = 0.0215) or off (P = 0.0114) SC/CC.
Conclusions.
Aqueous outflow structures, including SC and CCs, can be noninvasively assessed in the human eye. These measurements will be useful in physiological studies of AO and will be clinically useful in the determination of the impact of glaucoma therapies on IOP as well as presurgical planning.
Glaucoma is the second leading cause of blindness worldwide,1 and the most important risk factor for glaucoma is elevated intraocular pressure (IOP).2,3 IOP in the human eye is regulated, in part, by aqueous outflow (AO) through the trabecular meshwork (TM), draining into Schlemm's canal (SC) and then to the collector channels (CCs), which empty into the scleral veins.4 Results in studies have suggested that eyes of subjects with glaucoma have smaller SCs than do those of healthy individuals.5 Reduced SC size may be associated with elevated IOP because the size of SC is related to outflow facility.5 Past observations of reduced SC size and the correlation of SC size and outflow facility were obtained in cadaveric eyes.
Noninvasive measurement of AO and AO structures including SC, CC, and the SC ostia at CC junctions (SC/CC) in the human eye would provide a powerful tool for both clinical and basic research and the clinical management of glaucoma. The purpose of the present study was to measure SC noninvasively in living human eyes, determine the reproducibility of morphometric measurements within SC, and compare SC area in different regions of the eye.
Methods
The study was conducted in accordance with the tenets of the Declaration of Helsinki and the Health Insurance Portability and Accountability Act. The institutional review board of the University of Pittsburgh approved the study. Written informed consent was given by all subjects before participation.
Subjects
Healthy volunteers were recruited from the staff and faculty of the University of Pittsburgh Medical Center (UPMC) Eye Center. Glaucoma subjects were recruited from patients seen in the glaucoma clinic of the UPMC Eye Center. SC and active CCs were imaged by spectral domain optical coherence tomography (SD-OCT; Bioptigen, Research Triangle Park, NC).
Imaging of SC in Human Eyes
We have developed techniques that combine structural and functional SD-OCT imaging to accurately identify SC; to assess Doppler signals from AO in SC, CCs, and scleral veins; and to make structural measurements throughout (Kagemann L, et al. IOVS 2008;49:ARVO E-Abstract 684). SD-OCT Doppler measurements have been described in detail elsewhere and have been validated in an in vivo model.6 Since successful SD-OCT imaging of SC and CC have not been accomplished previously, Doppler images were used in combination with structural images to confirm the location and identity of SC and CCs in SD-OCT limbus images in the first five subjects (Figs. 1A, 1B). CCs appeared in the images as dark structures following tortuous paths from superficial veins to a deep, slit-like structure (Fig. 2). The Doppler signature of the vein confirmed its identity as a structure containing laminar flow (Fig. 1A). CC's were tracked from the vein to SC, using the Doppler signature within the CC to confirm it as a structure containing laminar flow (Fig. 1B).
Figure 1.

Radial scans of the limbus and SC were obtained. (A) Structure and Doppler images appear side by side (B). Doppler shifts are sampled (B, C, right) along the red vertical line and graphed, with the blue horizontal line used to locate the measurement site within the structural, Doppler, and velocity graphs. (B, C) The strong Doppler shift against the stable background (B, center) contains laminar flow within a scleral vein (parabolic velocity distribution, B, right) and CC (smaller parabolic velocity distribution, C, right). The identity of SC was made by virtue of its connection to scleral veins via tortuous CCs. This connection was confirmed by tracing CCs from superficial veins into the depths of the limbus to the slit-like structure.
Figure 2.
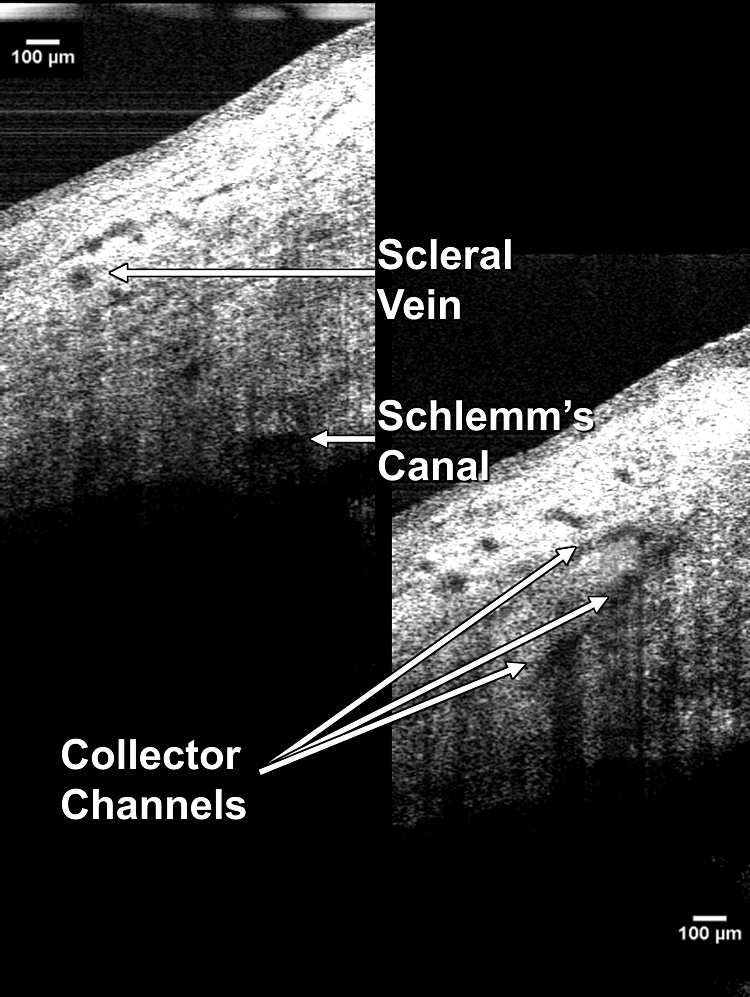
SC, the scleral vein into which it drains, and the CCs connecting the two are visualized in these two frames of a 3-D image sequence.
A commercially available SD-OCT optics engine was used (Bioptigen, Research Triangle Park, NC) that permits the use of a wide-bandwidth superluminescent diode array: a quad diode–coupled source with an 870-nm center wavelength and a 200-nm bandwidth (Q870; Superlum Ltd., Dublin, Ireland). This light source has a theoretical axial resolution of 1.3 μm in tissue; however, tissue water absorption results in a somewhat reduced true axial resolution in the eye. The nonisotropic raster scan consisted of 700 × 10 axial scans (A-scans) sampling a 1.3 × 0.6-mm slice of tissue 2 mm thick. The raster scan was centered on an SC/CC, so that raster volumes contained both an SC/CC and adjacent areas of SC with no visible junction (Fig. 2). To reduce background noise, each of the 700 × 10 A-scans was calculated by averaging 18 sequential raw A-scans. Raw A-scans were acquired at a rate of 28,000 per second. A bite bar was used to minimize fore and aft head motions during the 4.5-second scan. In healthy subjects, SC was imaged in both eyes nasally and temporally. In subjects with glaucoma, SC was imaged on the nasal side of the glaucomatous eye.
Image Processing
Each of the 10 B-scans (consisting of 700 averaged A-scans) was resampled to a 1:1 aspect ratio, and measurements were obtained with ImageJ (ImageJ 1.40g, http://rsb.info.nih.gov/ij/ developed by Wayne Rasband, National Institutes of Health, Bethesda, MD). Contrast and magnification were subjectively adjusted to maximize visualization of SC, which was manually traced using the “freehand selection tool” (Fig. 3).
Figure 3.

SC is visible adjacent to a CC ostium (A) and at the ostium (B). Measurements were made in both locations by increasing contrast (C) and magnification (D). SC was then outlined with the freehand tool in ImageJ (NIH; E). When the outline was complete, ImageJ automatically measured the enclosed area, presenting results in square micrometers in calibrated images.
Reproducibility of Morphometric Measurements of SC
In a subset of healthy subjects, SC was measured three times by two independent observers. Observers were instructed to locate the SC/CC junction within the raster scan and select a cross-sectional image of SC within a few frames of the junction, no more than three frames (180 μm) from the SC/CC. Bias (relative systematic difference) and imprecision (random difference) between two observers were estimated by fitting a latent variable measurement error model to the six repeated measurements (three from each observer). This model included parameters of observer and measurement number (measurements 1, 2, and 3).
Comparison of SC Area in Different Regions of the Eye
The effects of scan location within the eye (temporal versus nasal) and scan location within SC (on versus off SC/CC) were analyzed by a linear mixed-effects model. SC cross-sectional areas were compared between healthy and glaucoma subjects by Mann-Whitney Rank U test. P < 0.05 was considered statistically significant.
Results
Imaging of SC in Human Eyes
SC was successfully identified and imaged in every healthy subject in whom it was attempted. Specifically, SC was located nasally and temporally in both eyes in 17 female and 4 male healthy subjects (34 ± 9 years; range 24–49). Three glaucoma subjects were imaged (57 ± 6 years; range 52–63). SC and CCs were successfully located in two of the glaucoma subjects. SC and CCs were not found in the third subject, who had an implanted glaucoma drainage device.
Reproducibility of Morphometric Measurements of SC
A randomly selected subset of 12 healthy subjects was included in the reproducibility and location comparison studies. No bias between repeats within observers was observed. The calibration curves and equations relating measurement bias between the two observers are provided in Figure 4. A model without bias was fitted. A coefficient of variation (CoV) of 11.4% was calculated from the quantification of imprecision.
Figure 4.

Each observer made three measurements of SC cross-sectional area on and adjacent to a CC ostium. The latent variable model produced calibration equations relating the measurements of the two observers.
Comparison of SC Area in Different Regions of the Eye
Average measurements from the subjects included in the reproducibility study are shown in Table 1. Nasal SC areas were significantly larger than temporal ones (P = 0.009). Cross-sectional SC areas were significantly greater at junction sites than those adjacent to those sites: 12,426 ± 4,158 μm2 versus 7,254 ± 2,605 μm2, respectively (mean ± SD; P < 0.0001). In the two glaucomatous eyes, cross-sectional SC areas on and off CC junctions were 6025 ± 1909 and 3725 ± 742 μm2, respectively. SC areas were significantly smaller in glaucoma patients than in normal subjects, whether pooled (P = 0.006) or grouped by measurements on SC/CC (P = 0.039) or off SC/CC (P = 0.031).
Table 1.
Schlemm's Canal Cross-Sectional Area Measured at Visible Collector Channel Junctions and Adjacent to Those Junctions by Two Independent Observers
| Schlemm's Canal Collector Channel Junction |
Schlemm's Canal without Junction |
|||||
|---|---|---|---|---|---|---|
| Nasal | Temporal | Combined | Nasal | Temporal | Combined | |
| OD | ||||||
| Observer 1 | 13797 (6770) | 10390 (4864) | 12605 (6261) | 7998 (3207) | 4964 (1503) | 7027 (3099) |
| Observer 2 | 12280 (2894) | 11236 (2510) | 11915 (2746) | 7446 (1658) | 6080 (914) | 7009 (1580) |
| Combined | 13039 (5160) | 10813 (3744) | 12260 (4785) | 7722 (2529) | 5523 (1333) | 7018 (2435) |
| OS | ||||||
| Observer 1 | 13738 (4177) | 12485 (5176) | 13768 (5512) | 8793 (3068) | 6411 (3676) | 7721 (3481) |
| Observer 2 | 11785 (1939) | 12073 (2153) | 12033 (2427) | 7706 (2190) | 7028 (1719) | 7385 (1958) |
| Combined | 12762 (3342) | 12279 (3815) | 12593 (3474) | 8276 (2679) | 6720 (2802) | 7557 (2812) |
| Combined | ||||||
| Observer 1 | 13768 (5512) | 11438 (4946) | 12952 (5376) | 8310 (3121) | 5730 (2881) | 7336 (3255) |
| Observer 2 | 12033 (2427) | 11654 (2288) | 11900 (2356) | 7542 (1835) | 6582 (1443) | 7171 (1742) |
| Combined | 12900 (4306) | 11546 (3782) | 12426 (4158) | 7933 (2577) | 6156 (2285) | 7254 (2605) |
Measurement results are expressed as mean square micrometers ± SD.
Discussion
We found that a combination of signal averaging and high axial resolution enables the location of superficial vessels in the limbus and the CCs that drain into them, which can be traced, either in live acquisition mode or in 3-D data blocks, to locate SC. When located, the cross-sectional area of SC can be reproducibly measured. The cross-sectional area of SC was larger at junctions with active CCs. Determination of activity was based on the presence of a Doppler signal within. SC was significantly smaller in the two patients with glaucoma than in the healthy subjects. In one patient with a glaucoma drainage device, SC and the CCs could not be located.
A latent variable model using measurements from two observers computed imprecision associated with the measurement process. Each observer measured a single set of images three times. Since variability changed with level, data were log transformed, and standard deviation (SD) was estimated in log space. To account for the change in SD with level, SD was normalized to level and the resulting CoV of 11.4%. This value estimates measurement imprecision and is needed when calculating statistical power during the design of clinical experiments.
SC cross-sectional areas have been measured after fixation in several histologic studies. Ten Hulzen and Johnson7 examined the effect of perfusion pressure on SC area, measuring immersion-fixed versus perfusion-fixed specimens at 15 mm Hg. Wild et al.8 compared viscoelastic substances in viscocanalostomy procedures, and their study included a control group. In that study, SC area was measured at the location of a deep flap penetrating to SC, and 6 mm away from the flap. Using their published data, we calculated the overall mean and SD of the data as presented, and used those values to calculate the 95% confidence interval (CI) mean ±1.96 × SD. Histologic values were then increased by 15% to account for tissue shrinkage associated with fixation9 (Table 2). In the SC area measurements away from the CC ostia, all temporal data fell within the 95% CI for all normative data adjusted for shrinkage, except for the OS and combined measurements by observer 2. All nasal and temporal SC area measurements off of CC ostia fell within the immersion-fixed 95% CIs, with the lone exception of the OS nasal measurement by observer 1. None of the measurements obtained at CC ostia was within the 95% CIs regardless of fixation method. Overall, the magnitudes of SC area measurements in the present study are in good agreement with published values, after adjustment for shrinkage, although they tend to be toward the high end of the 95% CI. This finding suggests the possibility of a statistically insignificant difference between the present in vivo measurements and published histologic measurements. Such a systematic difference could result from an underestimation of the effects of tissue shrinkage, systematic differences between study populations in this and the published work, or a small error in the calibration of the SD-OCT images.
Table 2.
Published Schlemm's Canal Cross-Sectional Area Measurements, Used to Calculate 95% CI for Normal Healthy Eyes
| Published Values |
15% Adjusted |
|||
|---|---|---|---|---|
| Lower Limit | Upper Limit | Lower Limit | Upper Limit | |
| Ten Hulzen and Johnson7 | ||||
| IM-Fixed | 825 | 8138 | 948 | 9359 |
| PP-Fixed | 176 | 5715 | 202 | 6572 |
| Wild et al.8 | ||||
| At-Flap | 858 | 7762 | 987 | 8925 |
| 6 mm from Flap | 1202 | 7310 | 1383 | 8406 |
Area is expressed as mean square micrometers ± SD. Results were increased by 15% to allow for tissue shrinkage. IM, immersion; PP, perfusion pressure.
If measurements are made exclusively on ostia, they are significantly larger than published values, since they are not contained within the adjusted 95% CIs. The broadness of the CIs for published data suggests that histologic assessment was performed on a wide range of SC presentations. It is unknown whether histologic measurements obtained exclusively at ostia would agree with data in the present study.
After ongoing validation studies are complete, this noninvasive measurement of AO may find several immediate applications. The most obvious is basic research of the physiology of AO and the pathophysiology of AO in glaucoma. The present findings in two glaucoma subjects showed that the structures involved in AO are narrow in vivo, in agreement with prior histologic findings.5 Other applications will include investigations of the impact of glaucoma medications and treatments on the modulation of AO in both healthy and glaucomatous eyes. Eventually, AO measurements may also be useful in presurgical planning. The utility of AO imaging for presurgical planning may vary with procedure. If a procedure is designed to facilitate AO from the trabecular meshwork into SC, then it is suggested (but remains to be demonstrated) that optimal outcomes will occur when flow from the TM is increased in a region adjacent to a large and active SC ostium.
SC was found to be significantly larger on the nasal side than on the temporal. This finding was consistent whether on or off an SC/CC, may suggest preferential nasal drainage in the normal healthy eye, and may suggest that interventions designed to enhance outflow on the nasal side are preferable. Further study is needed.
In the patient with a glaucoma drainage device, neither CCs nor SC was visualized. It is possible that the natural outflow system collapsed beyond the limits of resolution used after being replaced by an alternate outflow pathway.
SD-OCT imaging of SC has been claimed previously,10,11 however; a hyporeflective band occurring at the interface of the TM may have been misidentified as SC. The hyporeflective band wraps tightly around the TM, surrounding it and making a complete circuit from the anterior chamber just anterior to the TM, then lateral to the TM, and finally, in some eyes, posterior to the TM. In the present study, both SC and the TM interface were visualized (Fig. 5).
Figure 5.
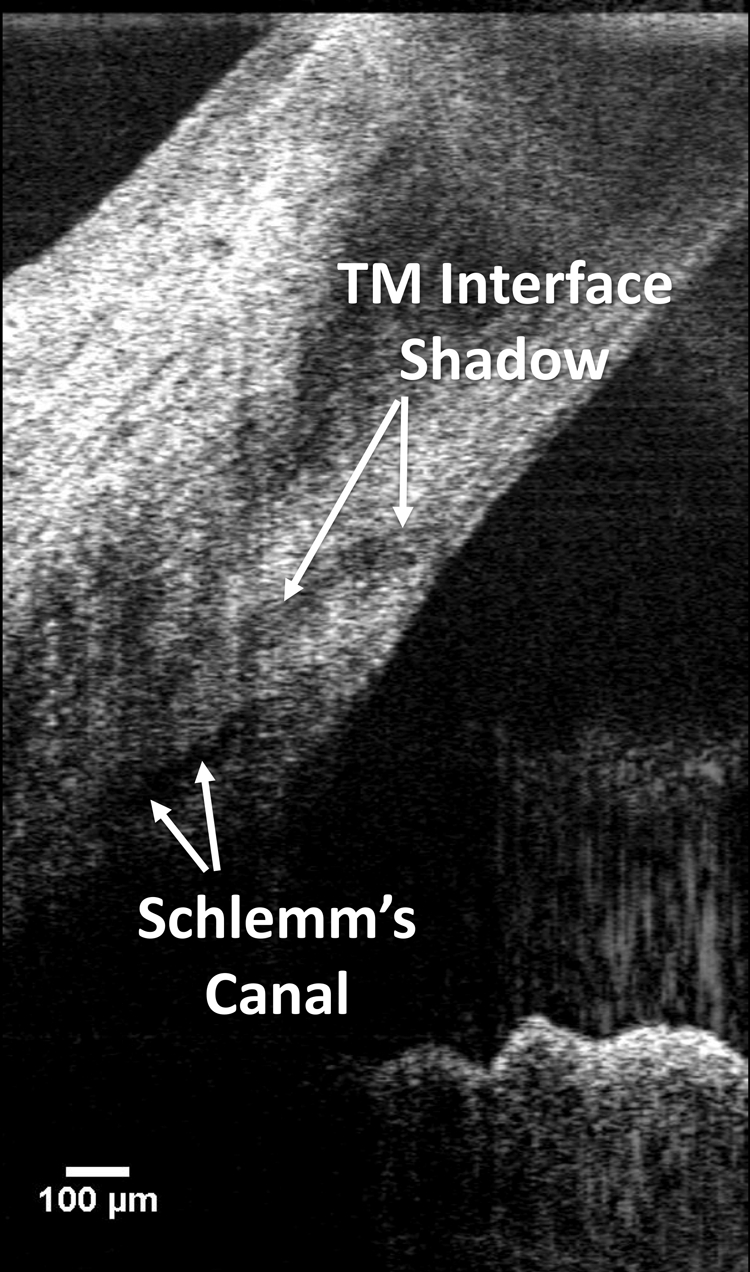
In low-axial-resolution systems, it is possible to mistake the trabecular meshwork interface for SC. It can be distinguished from SC by its curved path toward the anterior chamber.
There are several limitations to the present study. Samples of SC away from SC/CC were limited to locations within 180 μm (three adjacent frames) of a visible junction. As a result, only a small sample of SC was imaged and analyzed in this study. Future work must include a comprehensive 360° survey of SC. Such a survey will be difficult to accomplish in humans for several reasons. First, each scan volume was acquired in 4.5 seconds, with each frame requiring 0.45 seconds. Eye movements may be minimized with the use of a bite bar; however, movements between scans make it extremely difficult to obtain a series of adjacent raster scans at known locations. With each scan volume traversing only 0.6 mm of SC in 4.5 seconds, under ideal conditions, imaging of the SC all around the eye would require 279 seconds (4.65 minutes) of scan time. Second, despite being located in all eyes without shunts, each eye had many regions in which shadowing from superficial blood vessels obscured SC and the CCs (Fig. 6). Shadowing did not prevent the identification and measurement of SC/CC junctions, as locations with sufficiently few shadows were present in all eyes (usually the 3 or 9 o'clock nasal location). However; the combination of blood vessel shadowing and scan time makes the completion of a comprehensive map of all CC junctions and all SC unlikely. It is possible that longer wavelength systems are more robust to shadow artifact, but it is unknown whether longer wavelengths would have sufficient axial resolution to image SC, or if such a system would address the limitation of scan time. Axial resolution is inversely proportional to center wavelength, and as longer wavelengths are used, resolution suffers. The optimal wavelength for SC imaging and measurement may differ and is yet to be determined. Another limitation of the study is the small number of glaucoma subjects. Caution should be used in interpretation of results drawn from the small sample; however, the observed differences are of interest, and our pilot results emphasize the need for further investigation.
Figure 6.
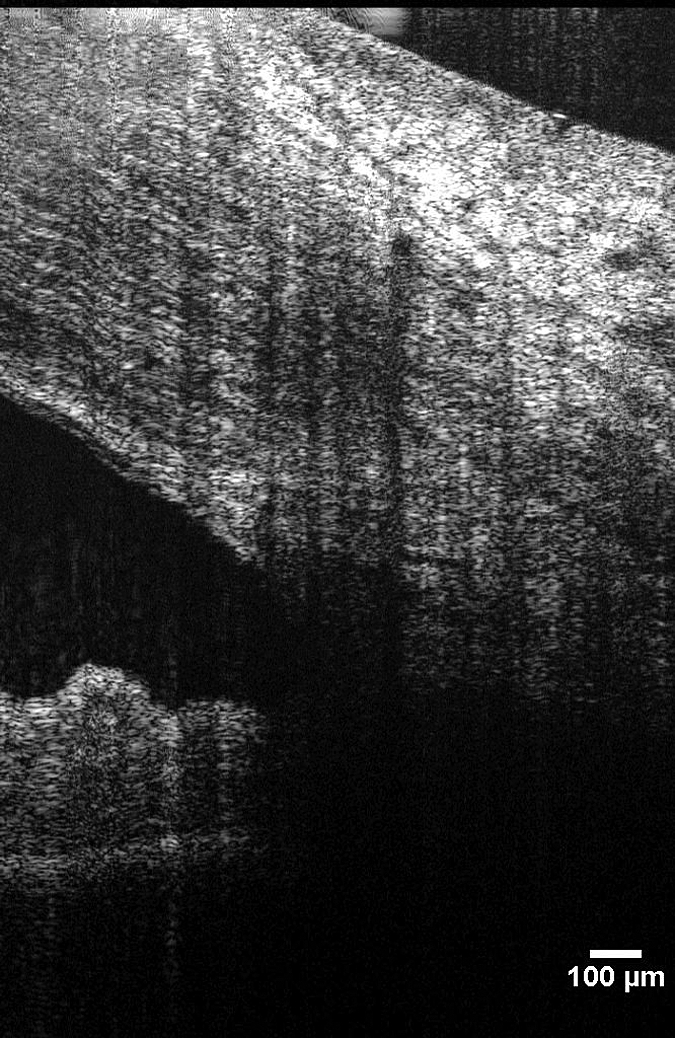
Shadows from superficial blood vessels often obscure part or all of SC.
In the present study, a simple subjective method of quality control was used to detect eye movements. Since the scan set consisted of 10 B-scans obtained approximately in a single location, it was simple to page rapidly between B-scans and compare the appearance of the anterior corneal surface. Scans containing apparent eye movements were not used for analysis. Generally speaking, no technological advance can be trusted to completely eliminate eye movement artifacts in OCT or any other scanning ophthalmic imaging technique. Some method of quality control or image validation will always be needed. That being said, it is possible that reduced scan times in future OCT systems will lessen the deleterious effects of eye movements. Swept-source technology has increased the A-scan rate to 249,000 Hz in a prototype system.12 Applied to the scan protocol used in the present study, a 249-kHz scan rate would reduce the B-scan acquisition time from 0.45 to only 0.05 seconds. Visual inspection for eye movements between slices will always be necessary when images are being used to characterize morphology, but increased scan speeds are likely to reduce the number of frames discarded due to eye movements.
In conclusion, SC and the AO system can be noninvasively imaged and Doppler shifts quantified in the living human eye. These measurements will be useful in physiological studies of AO, and clinically useful for determining the impact of glaucoma therapies on IOP as well as in presurgical planning.
Footnotes
Supported in part by National Institute of Health Grants R01-EY13178 and P30-EY08098, Bethesda, MD; The Eye and Ear Foundation, Pittsburgh, PA; and unrestricted grants from Research to Prevent Blindness, New York, New York.
Disclosure: L. Kagemann, None; G. Wollstein, None; H. Ishikawa, P; R.A. Bilonick, None; P.M. Brennen, None; L.S. Folio, None; M.L. Gabriele, None; J.S. Schuman, None
References
- 1.Quigley HA, Broman AT. The number of people with glaucoma worldwide in 2010 and 2020. Br J Ophthalmol 2006;90:262–267 [DOI] [PMC free article] [PubMed] [Google Scholar]
- 2.Sommer A, Tielsch JM, Katz J, et al. Relationship between intraocular pressure and primary open angle glaucoma among white and black Americans. The Baltimore Eye Survey. Arch Ophthalmol 1991;109:1090–1095 [DOI] [PubMed] [Google Scholar]
- 3.Haefliger IO. Risk factors associated with glaucoma (in German). Klin Monatsbl Augenheilkd 1997;210:265–268 [DOI] [PubMed] [Google Scholar]
- 4.Grant WM. Clinical measurements of aqueous outflow. Am J Ophthalmol 1951;34:1603–1605 [PubMed] [Google Scholar]
- 5.Allingham RR, de Kater AW, Ethier CR. Schlemm's canal and primary open angle glaucoma: correlation between Schlemm's canal dimensions and outflow facility. Exp Eye Res 1996;62:101–109 [DOI] [PubMed] [Google Scholar]
- 6.Kagemann L, Wollstein G, Ishikawa H, Townsend KA, Schuman JS. Validation of spectral domain optical coherence tomographic Doppler shifts using an in vitro flow model. Invest Ophthalmol Vis Sci 2009;50:702–706 [DOI] [PMC free article] [PubMed] [Google Scholar]
- 7.Ten Hulzen RD, Johnson DH. Effect of fixation pressure on juxtacanalicular tissue and Schlemm's canal. Invest Ophthalmol Vis Sci 1996;37:114–124 [PubMed] [Google Scholar]
- 8.Wild GJ, Kent AR, Peng Q. Dilation of Schlemm's canal in viscocanalostomy: comparison of 2 viscoelastic substances. J Cataract Refract Surg 2001;27:1294–1297 [DOI] [PubMed] [Google Scholar]
- 9.Bloom G, Friberg U. Shrinkage during fixation and embedding of histological specimens. Acta Morphol Neerl Scand 1956;1:12–20 [PubMed] [Google Scholar]
- 10.Wang Y, Bower BA, Izatt JA, Tan O, Huang D. In vivo total retinal blood flow measurement by Fourier domain Doppler optical coherence tomography. J Biomed Opt 2007;12:041215 [DOI] [PubMed] [Google Scholar]
- 11.Sarunic MV, Asrani S, Izatt JA. Imaging the ocular anterior segment with real-time, full-range Fourier-domain optical coherence tomography. Arch Ophthalmol 2008;126:537–542 [DOI] [PMC free article] [PubMed] [Google Scholar]
- 12.Srinivasan VJ, Adler DC, Chen Y, et al. Ultrahigh-speed optical coherence tomography for three-dimensional and en face imaging of the retina and optic nerve head. Invest Ophthalmol Vis Sci 2008;49:5103–5110 [DOI] [PMC free article] [PubMed] [Google Scholar]