

Abstract
The degree of tumor hypoxia correlates with advanced disease stages and treatment resistance. The transcription factor hypoxia-inducible factor-1 (HIF-1) promotes tumor cell adaptation and survival under hypoxic conditions. Therefore, specific HIF-1 inhibitors represent an important new class of potential tumor-selective therapeutic agents. A T47D human breast tumor cell-based reporter assay was used to examine extracts of plants and marine organisms for inhibitors of HIF-1 activation. Bioassay-guided fractionation of the lipid extract of the red alga Laurencia intricata yielded a structurally novel diterpene laurenditerpenol (1). The structure of 1 was determined spectroscopically. The relative configurations of the substituents of each ring system were assigned based on NOESY correlations. The absolute configurations of positions C-1 was determined by the modified Mosher ester procedure (directly in NMR tubes). Compound 1 potently inhibited hypoxia-activated HIF-1 (IC50: 0.4 μM) and hypoxia-induced VEGF (a potent angiogenic factor) in T47D cells. Compound 1 selectively inhibits HIF-1 activation by hypoxia but not iron chelator induced activation. Further, 1 suppresses tumor cell survival under hypoxic conditions without affecting normoxic cell growth. Compound 1 inhibits HIF-1 by blocking the induction of the oxygen-regulated HIF-1α protein. Mitochondrial respiration studies revealed that 1 suppresses oxygen consumption.
Rapid tumor growth outstrips the capability of existing blood vessels to supply oxygen and nutrients. As a result, a common feature of solid tumors is the existence of hypoxic regions. Tumor hypoxia directly correlates with advanced disease stages and poor prognosis.1 Unlike normal cells from the same tissue, tumor cells are often chronically hypoxic. Hypoxic tumor cells are more resistant than normoxic tumor cells to radiation treatment and chemotherapy and these hypoxic tumor cells are considered an important contributor to disease relapse.1 Current approaches to overcome tumor hypoxia target the direct effects of hypoxia - lack of cellular oxygen.1 Presently, there is no drug that specifically targets hypoxic tumor cells. Recent results from clinical studies on tirapazamine (a bioreductive drug that selectively kill hypoxic tumor cells) have indicated the significant potential of drugs that target tumor hypoxia.2,3 Our focus is to discover new drug leads that target the important indirect effect of tumor hypoxia - induction of genes that promote the adaptation and survival of tumor cells. The key transcription factor that activates gene expression under hypoxic conditions is HIF-1, a heterodimer of the bHLHPAS proteins HIF-1α and HIF-1β/ARNT.4,5 Upon activation, HIF-1 binds to the hypoxia response element (HRE) present in the genomic sequence and activates target gene transcription. In cancer patients, over-expression of the oxygen regulated HIF-1α subunit is associated with advanced disease stages, poor prognosis and treatment resistance.6,7 In animal models, inhibition of HIF-1 production/function significantly reduces tumor growth.8 Small molecule HIF-1 inhibitors represent potential anti-cancer drug leads that target tumor hypoxia.
In order to discover HIF-1 functional antagonists, we have established a T47D human breast tumor cell-based reporter assay in a 96-well plate format. The activity of HIF-1 is monitored using a luciferase reporter gene under the control of HRE from the erythropoietin gene (pTK-HRE3-luc).9 Natural product-rich extracts of terrestrial and marine organisms were examined for inhibitors of hypoxia-induced HIF-1 activation. The lipid extract of a Jamaican sample of the red alga Laurencia intricata Lamouroux (Rhodomelaceae) potently inhibited HIF-1 activation by hypoxia (79% inhibition at 1 μg mL−1) and was selected for bioassay-guided fractionation. Members of the genus Laurencia have been shown to be a rich source of several hundred unusual secondary metabolites. The majority of these compounds are oxygenated and halogenated sesquiterpenes,10 halogenated diterpenes,11 halogenated enynes,12 sesquiterpene alcohols,13 triterpenes,14 and nonterpenoid bromo allenes.15
Results and Discussion
The tropical red alga Laurencia intricata was collected at Discovery Bay, Jamaica, lyophilized, and exhaustively extracted with CH2Cl2:MeOH (2:1). The extract was fractionated by normal phase VLC and HPLC to yield laurenditerpenol (1), as colorless oil. Both 13C NMR data and HRFABMS measurements supported the molecular formula C20H34O2, indicating four degrees of unsaturation. The presence of a hydroxyl group was evident from a hydroxyl stretch at 3446 cm−1 in the IR spectrum. This was also confirmed by a 1 ppm downfield shift of the H-1 α-oxymethine proton from δ 4.13 to δ 5.23 following acetylation with acetic anhydride-pyridine (supplemental materials). Interpretation of the 13C NMR and DEPT experiments indicated the presence of 20 carbons that correspond to a total of three quaternary, six methine, six methylene and five methyl groups. The 13C NMR spectrum indicated that three carbons were bonded to electronegative heteroatoms C-1 (δC 65.6), C-11 (δC 85.9), and C-14 (δC 84.9). These data suggest the presence of an ether moiety. Two secondary methyl groups were indicated by two doublet resonances at 0.94 ppm and 0.97 ppm in the 1H NMR spectrum. Three tertiary methyl substituents were indicated by the presence of three singlet resonances δ 1.29, 1.37, 1.71, respectively. Further analysis of 1H NMR spectrum revealed one olefinic methine resonance at 5.65 ppm (H-2). Five 1H-1H spin systems were established from interpretation of the 1H-1H COSY spectrum.
The five 1H-1H spin systems were connected through analysis of long-range 1H-13C couplings indicated by the HMBC spectrum (Table 1). The structure of an 6-acyl-3-methyl cyclohex-2-enol ring system was established through observation of long-range couplings connecting the olefinic methine H-2 with C-4, C-6, and C-20 and correlations that connected H-5a with C-1, C-4, and C-6 (Table 1).
Table 1.
NMR Spectral Data for 1 at 500 MHz (1H) and 125 MHz (13C) in CDC13.
| # | δ C | δH(J in Hz) | HMBC |
|---|---|---|---|
| 1 | 65.6 | 4.13 br s | C-20, C-4, C-6 |
| 2 | 123.9 | 5.65 d (4.5) | |
| 3 | 139.7 | ||
| 4 | 32.0 | 1.92–1.98 m | C-2, C-3, C-5, C-6 |
| 1.98–2.01 br dd (18, 5) | |||
| 5 | 20.9 | 1.68–1.73 m | C-1 |
| 1.42 m | |||
| 6 | 44.6 | 1.11–1.17 m | |
| 7 | 33.8 | 1.60–1.64 m | |
| 8 | 33.9 | 1.28–1.30 m | C-9 |
| 9 | 29.5 | 1.29–1.30 m | C-8, C-15, C-10 |
| 1.34–1.35 m | |||
| 10 | 58.7 | 1.18–1.24 m | C-15 |
| 11 | 85.9 | ||
| 12 | 32.6 | 1.40–1.43 m | C-13, C-14, C-11 |
| 1.85–1.87 ddd (12.2, 8.4, 4.3) | |||
| 13 | 39.6 | 1.49–1.52 dddd (24, 12, 5.3, 1.2) | C-15, C-12, C-14 |
| 1.59–1.63 m | |||
| 14 | 84.9 | ||
| 15 | 49.3 | 1.32–1.34 m | C-16, C-9, C-13, C-10 |
| 16 | 19.7 | 0.94 d (6.6) | C-15, C-10, C-14 |
| 17 | 18.6 | 1.29 s | C-13, C-14, C-15 |
| 18 | 21.1 | 1.37 s | C-12, C-10, C-11 |
| 19 | 17.7 | 0.97 d (6.7) | C-7, C-8, C-6 |
| 20 | 23.8 | 1.71 s | C-4, C-2, C-3 |
| OH | 1.02 d (7.1) | C-2 |
13C assignments from HMQC data. HMBC correlations from ambiguous overlapping resonances are not presented.
The presence of a tetrasubstituted 7-oxabicyclo[2.2.1]heptane ring was established through observation of long-range 1H-13C couplings between the methyl groups H3-17 with C-13, C-14, C-15; H3-18 with C-10, C-11, C-12; and H3-16 with C-10, C-14, C-15. Further, NOESY correlations were observed between the H3-17 and H3-18 methyl groups and the chemical shifts of C-11 (δC 85.9) and C-14 (δC 84.9) were characteristic for the presence of an ether bridge connecting these two quaternary carbons.
The two carbocyclic rings were shown to be connected through a short chain by observation of long-range 1H-13C couplings. The C-6 carbon of the cyclohexenol ring was coupled to the H3-19 methyl branch of the acyl chain. The oxabicyclo[2.2.1]heptane ring carbons C-10 and C-15 were coupled to H-9a of the connecting chain and H-15 of the oxabicyclo[2.2.1]heptane ring was coupled to the C-9 methylene carbon of the side chain.
The relative configuration of the oxabicyclo[2.2.1]heptane ring chiral centers was determined by the proximity of the substituents as determined by NOESY correlations. The C-1 absolute configuration was determined using the Modified Mosher ester method.16 The Mosher ester procedure was carried out directly in NMR tubes.17 Separate samples of 1 were each treated with (R)-(+)- and (S)-(−)-α-methoxy-α-trifluoromethyl-phenylacetyl chloride in anhydrous pyridine, respectively, to yield the (S)- and (R)-MTPA ester derivatives 1s and 1r. The 1H chemical shift values of the (R)-MTPA ester derivative (1r) was subtracted from the values of the (S)-MTPA ester (1s) [δΔ = δ (S)-MTPA − δ (R)-MTPA] (Figure 1). The negative δΔq values for H-6, H-19 and the positive values for H-2 and H-20 indicate that C-1 has a S-configuration.
Figure 1.
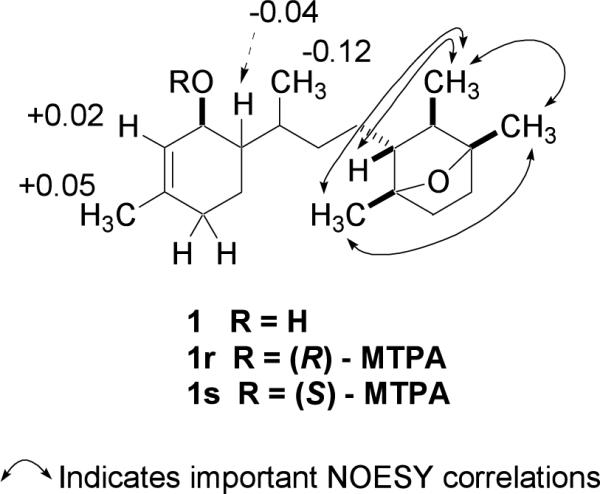
Selected NOESY correlations of 1 and Δδ values [Δδ (in ppm) = δS − δR] for (R)- and (S)-MTPA esters of 1.
The dose-response of 1 inhibiting HIF-1 activation was determined in a T47D cell-based reporter assay. T47D cells transiently transfected with the pTK-HRE3-luc reporter were exposed to 1 at the indicated concentrations for 30 min, followed by another 16 h incubation under hypoxic conditions (1% O2/5% CO2/94% N2). The luciferase activity was determined and presented as percentage inhibition in comparison to the induced control. Hypoxic exposure activated HIF-1 by 21-fold. As shown in Figure 2A, 1 inhibits HIF-1 activation by hypoxia with an IC50 of 0.4 μM. At the MIC (1.78 μM), an 88% inhibition was observed. A similar experiment was performed with a control reporter pGL3-Control (Promega). At the highest concentration tested (3 μM), 1 did not inhibit luciferase expression from the control reporter (data not shown). Iron chelators and transition metals can each activate HIF-1 and have been used as hypoxia mimetics.18 The effects of 1 on HIF-1 activation by the Fe2+ selective chelator 1,10-phenanthroline were also examined and the data presented in Figure 2B. The compound 1,10-phenanthroline (10 μM) activated HIF-1 by 24-fold. At the concentration of 3 μM, 1 did not exert a statistically significant effect on HIF-1 activation by 1,10-phenanthroline. These results suggest that 1 inhibits HIF-1 through a mechanism(s) that is selective to tumor hypoxia induced HIF-1 activation.
Figure 2.

Compound 1 inhibits hypoxia-induced HIF-1 activation in T47D cells (A). Effect of 1 (3 μM) on HIF-1 activation by a hypoxia mimetic 1,10-phenanthroline (10 μM) in T47D cells (B). Data shown are means from one representative experiment performed in quadruplicate and the bars represent standard error. In (B), an asterisk (*) indicates a significance of p < 0.001 when compared to the control, and lack of asterisk indicates no statistical difference (ANOVA and Fisher's PLSD post hoc test).
The list of genes that are direct targets of HIF-1 has expanded to include over 60 genes.4 Most of these genes are induced by hypoxia in a cell type-specific manner. One of the HIF-1 target genes that are hypoxia inducible in most cell types is the angiogenic factor VEGF. In cancer patients, the level of VEGF protein directly correlates with high microvessel density, advanced disease stages, and poor prognosis.19 Agents that suppress VEGF production/function are currently in clinical trials for cancer treatments20 and one has been approved by the FDA. Since secreted VEGF protein is the bioactive form, the effect of 1 on the induction of secreted VEGF protein was examined in T47D cells and the results shown in Figure 3. The hypoxia-selective HIF-1 inhibitor manassantin B (0.1 μM) was used as a positive control.21 Hypoxia (1% O2) increased secreted VEGF protein level by 2.6-fold and 1 inhibited the induction by 55% at 1 μM (Figure 3). At the MIC (3 μM), an 80% inhibition of the induction was observed. HIF-1 activates the expression of genes that promote hypoxic tumor cell survival. Therefore, it is a logical extension to speculate that HIF-1 inhibitors will suppress tumor cell survival under hypoxic conditions. A modified clonogenic assay was used to evaluate the effect of 1 on hypoxic tumor cell survival.22 T47D cells were incubated under hypoxic conditions (1% O2) in the presence and absence of 1. A similar experiment was also performed under normoxic conditions. The colony forming ability of both control and treated cells was examined and the data shown in Figure 4. Hypoxic treatment increased the number of colonies by 30% in comparison to that of the normoxic control. Compound 1 significantly reduced the number of colonies formed under hypoxic conditions (50% inhibition at 1 μM). Under normoxic conditions, the effect of 1 is far less pronounced. No statistically significant difference was observed between the cells treated with 10 μM 1 and the untreated control. In MDA-MB-231 cells, hypoxia has been shown to increase cell survival by 8% (24 h, 0.1% O2)22 and to decrease low serum-induced apoptotic cell death by 40% (48 h, 3% O2).23 In T47D cells, we observed a 30% increase in survival under hypoxic conditions. A previously reported study showed a 16% decrease.22 However, this discrepancy in T47D cell survival under hypoxic conditions may result from differences between the experimental conditions. Our studies used a lower concentration of fetal bovine serum (5% FBS versus 10% FBS) and a less severe state of hypoxia (1% O2 versus 0.1% O2).
Figure 3.
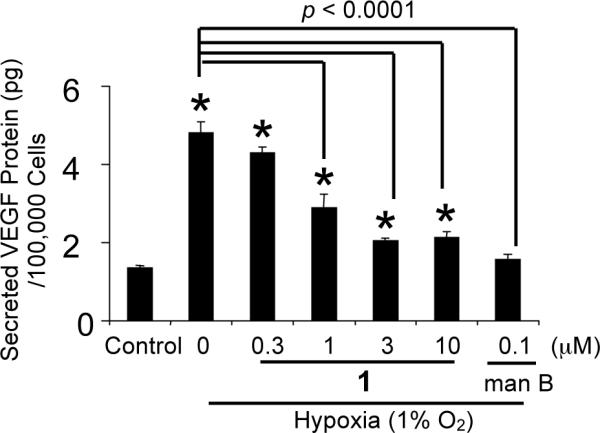
Compound 1 inhibits the induction of secreted VEGF protein by hypoxia in T47D cells. Data shown are averages from a representative experiment performed in triplicate and the bars represent standard error. An asterisk (*) indicates a significance of p < 0.05 when compared to the control, and lack of asterisk indicates no statistical difference (ANOVA and Fisher's PLSD post hoc test). The compound treated samples that exhibited a statistical difference (p < 0.05) when compared to the induced control are highlighted with the brackets and the p value indicated above the brackets.
Figure 4.
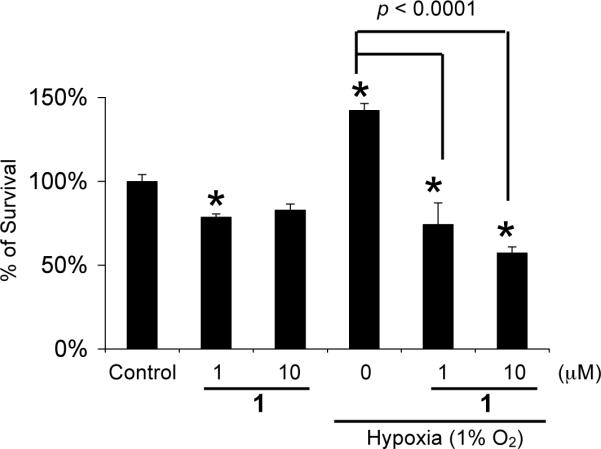
Compound 1 significantly reduces T47D cell survival under hypoxic conditions. Data shown are averages from a representative experiment performed in triplicate and the bars represent standard error. An asterisk (*) indicates a significance of p < 0.05 when compared to the control, and lack of asterisk indicates no statistical difference (ANOVA and Fisher's PLSD post hoc test). The p values between control and compound treatments under hypoxic conditions are shown.
The effects of 1 on tumor cell proliferation/viability under normoxic conditions were further examined using a panel of human breast tumor cell lines (T47D, MCF-7, MDA-MB-231, and SK-BR-3) as in vitro models for different disease stages and phenotypes.22 The African green monkey kidney derived Vero cells were used as an in vitro model for non-transformed cells. The cells were exposed to 1 at concentrations ranging from 10−9 to 10−4 M for 48 h and cell viability determined using MTT assay.24 As shown in Figure 5, 1 did not exert significant inhibition on cell proliferation/viability (less than 50% inhibition at concentrations up to 100 μM) in four out of the five cell lines examined (T47D, MCF-7, MDA-MB-231, and Vero). In SK-BR-3 cells, 1 inhibited cell proliferation/viability by 63% at the highest concentrations tested (100 μM).
Figure 5.
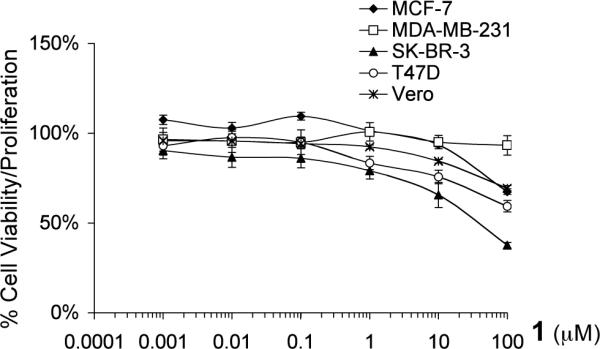
Effects of 1 on cell proliferation/viability in a panel of cell lines. The data are presented as percentage of the control. Averages from a representative experiment performed in triplicate are shown and the bars represent standard error.
Under normoxic conditions, HIF-1α proteins are post-translationally modified and rapidly degraded.25 Stabilization of the HIF-1α subunit is a key step in hypoxia induced HIF-1 activation. The effect of 1 on hypoxia induced HIF-1α protein stabilization was examined in T47D cells. Exponentially grown cells were exposed to 1 at the indicated concentrations for 30 min under normoxic conditions (95% air), followed by another 4 h incubation under hypoxic conditions (1% O2). Nuclear extract samples were prepared from both control and 1 treated cells. The HIF-1α and HIF-1β proteins in the nuclear extract samples were detected by Western blot analysis and the results shown in Figure 6. Hypoxic exposure (1% O2, 4 h) induces the accumulation of nuclear HIF-1α protein while the level of nuclear HIF-1β protein remains the same. At the concentration of 1 μM, 1 completely blocked hypoxic induction of the HIF-1α protein without affecting the constitutively expressed HIF-1β protein. These results suggest that 1 inhibits hypoxia-induced HIF-1 activation by blocking the induction of nuclear HIF-1α protein.
Figure 6.
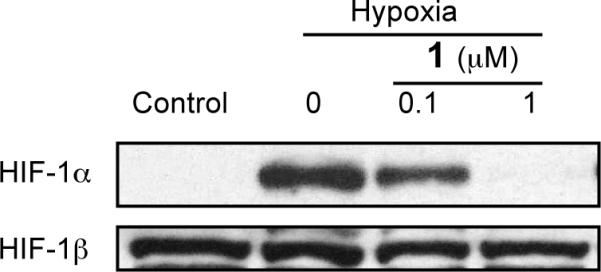
Compound 1 blocks hypoxic induction of nuclear HIF-1α protein. Images shown are results from Western blot analysis of nuclear extract samples from control and treated T47D cells for HIF-1α and HIF-1β proteins.
Mitochondrial inhibitors such as rotenone have been shown to inhibit the induction of HIF-1 target genes (EPO and VEGF) by hypoxia, but not that by transition metals.26 We hypothesized that 1 blocks hypoxia-induced HIF-1α protein but not iron chelator-induced HIF-1α protein through inhibiting mitochondria. The effect of 1 on mitochondrial respiration was examined and the data shown in Figure 7. Compound 1 inhibits the mitochondrial electron transport pathway (IC50: 0.8 μM). Further, 1 did not inhibit mitochondrial activity when succinate was supplied as a substrate (data not shown). These observations suggest that 1 is a Complex I, rather than Complex III, inhibitor. One recent study has demonstrated that inhibition of mitochondrial respiration under hypoxia increases the availability of cellular oxygen.27 Therefore, one possible mechanism of action for 1 to block hypoxia-induced HIF-1 activation is to increase the cellular O2 availability under hypoxia through the inhibition of mitochondrial respiration. This would then promote the oxygen-dependent degradation of HIF-1α protein under hypoxic conditions.
Figure 7.
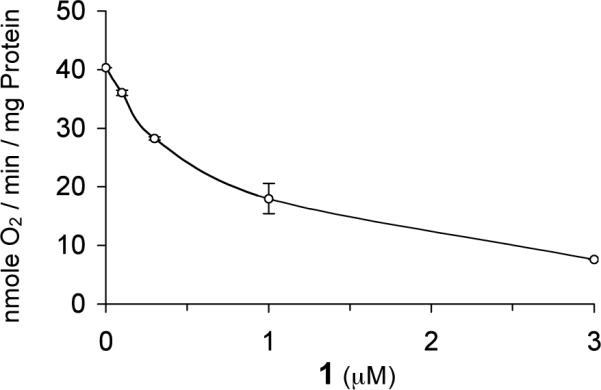
Compound 1 inhibits the mitochondrial electron transport pathway. Mitochondrial oxygen consumption was measured in the presence of glutamate/malate, ADP, and increasing amounts of 1. Data shown represent the average of two independent assays and are representative of multiple experiments.
Recently, one research group at the NCI used a similar cell-based reporter assay to screen libraries of pure compounds for small molecule HIF-1 inhibitors.28 Among the ~2000 structurally diverse pure compounds examined (NCI diversity set), the most potent compounds were the DNA topoisomerase I inhibitor topotecan and its related camptothecin analogs. In human U251 glioma cells, topotecan inhibited hypoxia-induced HIF-1 activation (EC50: 71.3 nM) as well as the iron chelator DFO-induced HIF-1 activation (EC50: 181 nM). In contrast, 1 selectively inhibited hypoxia induced HIF-1 activation (EC50: 0.4 μM) in T47D cells without affecting the iron chelator 1,10-phenanthroline-induced HIF-1 activation (at concentrations up to 3 μM). This is the first report of a marine diterpene that selectively and potently inhibits physiological hypoxia-induced HIF-1 activation in tumor cells. Recently, we reported the identification of dineolignans from Saururus cernuus as potent and physiological hypoxia selective HIF-1 inhibitors.21
Few natural products share structural similarities with 1. The serine/threonine phosphatase inhibitor cantharidin29 contains a 7-oxabicyclo[2.2.1]heptane ring system. However, cantharidin did not inhibit hypoxia-induced HIF-1 activation in T47D cells at concentrations up to 10 μM (Mohammed and Nagle, unpublished observations). Laurenditerpenol is not highly cytotoxic and may not significantly affect phosphatase systems. In fact, structure-activity studies have demonstrated that 1,4-dimethyl cantharidin derivatives that have the same methylation pattern as that of the 7-oxabicyclo[2.2.1]heptane ring system in 1 have a dramatically reduced level of phosphatase inhibitory activity.29b
Interestingly, the previously reported Laurencia pannosa sesquiterpene known as pannosane10c and the Aplysia dactylomela diterpene dactylopyrinoid30 also contain this unusual 7-oxabicyclo[2.2.1]heptane ring system. However, the occurrence of the brominated diterpene dactyloprinoid in the seahare A. dactylomela is most likely of dietary origin and may actually be a biosynthetically related Laurencia metabolite. While 1 contains no residual bromine, brominated terpenes are among the most common natural products produced by Laurencia spp. Therefore, it is envisioned that 1 is perhaps formed through a bromine-assisted cyclization of a diterpene precursor, as shown in Figure 8.
Figure 8.

Proposed biogenesis of 1.
Experimental Section
General Experimental Procedures
Optical rotation was measured on a RUDLPH Research Autopol IV Automatic Polarimeter. The IR spectrum was obtained using an AATI Mattson genesis Series FTIR. The 1H-NMR, 1H-1H COSY, NOESY and HMBC spectra were recorded on a Bruker AV 500 spectrometer. The 13C NMR and HMQC spectra were recorded on a Bruker DRX 500 spectrometer. Both NMR spectrometers were operated at 500 MHz for 1H and 100 MHz for 13C, respectively. The NMR spectra were recorded running gradients and using residual solvent peaks (δ 7.27) as an internal reference. Proton assignments for MTPA esters are based upon the observation of characteristic chemical shift patterns and indicative 1H-1H COSY correlations. The FAB data were acquired on VG 7070-HF mass spectrometer. TLC were run on Merck Si60F254 or Si60RP18F254 plates and visualized by spraying with 1:1 H2SO4 in EtOH and heating. HPLC was carried out on a waters Millenium system with a 996 photodiode array detector.
Algal Material
Laurencia intricata was collected near The Discovery Bay Marine Laboratory (Discovery Bay, Jamaica) at a depth of 1 m on July 6, 1998. A voucher specimen (DNJ-006) was placed on file with the University of Mississippi Herbarium (University of Mississippi).
Extraction and Isolation
Laurencia was extracted with CH2Cl2:MeOH (2:1) to yield 4.11 g crude extract. A portion (1.3 g) was fractionated by VLC (Si gel) using gradient elution with hexanes, EtOAc and MeOH. The active fraction (148 mg) eluted with 30% EtOAc in hexanes. Half of the active fraction (74 mg) was further purified by HPLC (Prodigy®, Si, 5 μm, 21.2 × 250 mm, 2% isopropanol:hexanes (v/v), 12 mL min−1; photodiode-array detection monitored 210 nm) lead to the isolation of 1 (7 mg, 1.07% yield).
Laurenditerpenol (1)
Colorless oil, [α]D26 −158.82° (c 0.34, CHCl3); UV (MeOH) λmax (log ε) 206 (3.39), 230 (2.37) nm; IR (film) λmax 3446, 2963, 2926, 2861, 1713, 1451, 1378, 1265,1131, 1065, 1023, 945, 865, 738 cm−1; 1H and 13C NMR (Table. 1); HRFABMS 329.2455 (calcd for C20H34O2Na [M + Na]+ 329.2456).
(R)- and (S)-MTPA esters of laurenditerpenol (1)
Compound 1 (0.6 mg, 1.9 μmol) was dissolved in pyridine-d5 (180 μL) and treated with 10 μL (53.4 μmol) of (R)-(−)-MTPA chloride at room temperature in a NMR tube for 12 h to yield the (S)-MTPA laurenditerpenol ester 1s. The (R)-MTPA laurenditerpenol ester (1r) was prepared from 1 (1.0 mg, 3.2 μmol) and (S)-(+)-MTPA chloride (53.4 μmol) using the same procedure as described for 1s.
Laurenditerpenol, (S)-MTPA ester (1s)
1H NMR (pyridine-d5, 400 MHz.) 5.94 (d, J = 3.6 Hz, H-2), 5.68 (s, H-1) 3.83, (s), 3.44 (s), 2.04 (m), 1.99(m), 1.89 (m), 1.73 (m), 1.67 (s, H-20), 1.62 (m), 1.51 (m), 1.43 (s, H-18), 1.40 (m), 1.38 (m, H-6), 1.30(s, H-17) 1.25 (m), 1.00 (d, J = 6.8 Hz, H-16), 0.88 (d, J = 6.4 Hz, H-19).
Laurenditerpenol, (R)-MTPA ester (1r)
1H NMR (pyridine-d5, 400 MHz.) δ 5.92 (d, J = 3.6 Hz, H-2), 5.72 (s, H-1), 3.84 (s), 1.91(m), 1.74 (m), 1.62(s, H-20), 1.56 (m), 1.52 (m), 1.44 (s, H-18), 1.42 (m, H-6), 1.39 (d), 1.32 (m), 1.29 (s, H-17), 1.15 (m), 1.00 (d, J = 6.8, H-16, H-19).
T47D Cell-Based Reporter Assay for HIF-1 Activity
The transfection, compound treatment, exposure to hypoxic conditions, exposure to normoxic conditions, exposure to a hypoxia mimetic (10 μM 1,10-phenanthroline), and luciferase activity determination were performed as previously described.21
ELISA for Secreted VEGF Protein
T47D cells were plated at the density of 3.56 × 10⁵ cells per well into 12-well plates in a volume of 1 mL DMEM/F12 medium (JRH Biosciences) supplemented with 10% (v/v) FBS (Hyclone) and antibiotics (50 U mL−1 penicillin G sodium, and 50 μg mL−1 streptomycin, BioWhittaker). After 24 h, half of the conditioned media was replaced with a test compound containing serum-free DMEM/F12 medium supplemented with antibiotics. The cells were incubated with the test compounds for another 30 min before exposure to hypoxic or normoxic conditions or a hypoxia mimetic for 16 h as that described in the reporter assay section. Following incubation, the plates were centrifuged at 100× g for 2 min, the conditioned media transferred to a new plate and stored at −80 °C. The cells were treated with trypsin (300 μL) and the number of viable cells in each well was determined using a hemocytometer (number of cells/mL × 0.3 mL).
The concentrations of secreted VEGF proteins in the conditioned media samples were determined using an ELISA assay for human VEGF protein. The samples were thawed on ice and a sample volume of 100 μL was used. The ELISA assay procedure and the commercial sources for all the reagents were the same as that described previously.21 The amount of secreted VEGF protein was normalized with the number of viable cells.
Clonogenic Survival Assay
T47D cells were plated at low density (400 cells per 100 mm culture dish) in a volume of 10 mL DMEM/F12 medium supplemented with 10% FBS and antibiotics. The cells were allowed to adhere for 4 h. Half of the conditioned media were replaced with a serum-free DMEM/F12 medium supplemented with antibiotics and test compounds. Following a 30 min pre-incubation with the test compounds, the cells were exposed to hypoxic or normoxic conditions for 24 h. A fresh DMEM/F12 medium supplemented with 10% FBS and antibiotics was used to replace the conditioned media. The cells were grown under normoxic conditions for 2–3 weeks with a medium change every 5 days. The plates were fixed with methanol, the colonies stained with crystal violet (0.1% in 20% EtOH), and the number of colonies with more than 50 cells counted.
MTT Assay for Cell Proliferation/Viability
All five cell lines (MCF-7, MDA-MB-231, SK-BR-3, T47D and Vero) were from American Type Cell Culture Collection and maintained in DMEM/F12 medium supplemented with 10% FBS and antibiotics. Exponentially grown cells were plated at 3 × 10⁴ cells per well into 96-well plates and incubated at 37 °C for 24 h. Test compounds were diluted in serum-free DMEM/F12 medium supplemented with antibiotics and added to the wells in an equal volume to achieve the desired concentrations in a 200 μL final volume. Forty-eight hours later, cell viability was determined using the MTT assay.24 A stock solution of MTT (Sigma) was prepared at 1 mg mL−1 in 1× PBS and added to the wells at the final concentration of 0.25 mg mL−1. Following incubation (4 h, 37 °C), the conditioned media were removed and the cells lysed in a volume of 100 μL 0.04 N HCl in isopropanol. After shaking the plates at room temperature for 30 min, absorbance at 570 nm was measured using an EL312e plate reader (Bio-Tek Instruments).
Nuclear Extract Preparation, Western Blot Analysis of HIF-1α and HIF-1β Protein
The experimental procedures were the same as those described previously.21
Mitochondrial Isolation and Respiration Studies
Livers were harvested from adult C57Bl/6 mice (Jackson Laboratory) and mitochondria were isolated according to the method of Kokoszka et al.31 Liver mitochondria (1.5 mg) were added to 1.6 mL buffer containing 225 mM mannitol, 75 mM sucrose, 10 mM KCl, 10 mM Tris/HCl (pH 7.5), and 5 mM KH2PO4 (pH 7.2) followed by 1.6 μL 1 dissolved in DMSO and 5 mM each of glutamate and malate. Respiration was initiated upon addition of ADP (450 nmole). Mitochondrial oxygen consumption was measured polarographically with a Clark electrode at room temperature.
Statistical Analysis
Data were compared using ANOVA and post hoc analyses using Fisher's PLSD (StatView® Software Version 5.01, SAS Institute Inc).
Acknowledgment
The authors thank Dr. S.L. McKnight (University of Texas Southwestern Medical Center at Dallas) for providing the pTK-HRE3-luc construct, F.T. Wiggers (NCNPR) for obtaining some NMR data, and Dr. Y.-P. Kim for assistance with the Western blot analysis. The Natural Resource Conservation Authority, Jamaica, and Discovery Bay Marine Laboratory are gratefully acknowledged for assistance with sample collections. This work was supported by the National Institutes of Health-National Cancer Institute CA 98787-01 (DGN/YDZ). This research was also supported in part by NOAA NURP/NIUST NA16RU1496, the USDA/Agricultural Research Service Specific Cooperative Agreement No. 58-6408-2-0009, and the DOD/2000-Breast Cancer Research Program DAMB17-01-1-0566 (DGN). The U.S. Army Medical Research Acquisition Activity, 820 Chandler Street, and Fort Detrick MD 21702-5014 is the awarding and administering acquisition office. The content herein reported does not necessarily reflect the position or the policy of the Government, and no official endorsement should be inferred. RKB is the Michael L. Rosenberg Scholar in Medical Research and is supported by a Burroughs Wellcome Fund Career Award in the Biomedical Sciences and the UTSW President's Research Council.
References
- (1).Brown JM. Cancer Res. 1999;59:5863–5870. [PubMed] [Google Scholar]
- (2).von Pawel J, von Roemeling R, Gatzemeier U, Boyer M, Elisson LO, Clark P, Talbot D, Rey A, Butler TW, Hirsh V, Olver I, Bergman B, Ayoub J, Richardson G, Dunlop D, Arcenas A, Vescio R, Viallet J, Treat J. J. Clin. Oncol. 2000;18:1351–1359. doi: 10.1200/JCO.2000.18.6.1351. [DOI] [PubMed] [Google Scholar]
- (3).Rischin D, Peters L, Hicks R, Hughes P, Fisher R, Hart R, Sexton M, D'Costa I, von Roemeling R. J. Clin. Oncol. 2001;19:535–542. doi: 10.1200/JCO.2001.19.2.535. [DOI] [PubMed] [Google Scholar]
- (4).Semenza GL. Nat. Rev. Cancer. 2003;3:721–732. doi: 10.1038/nrc1187. [DOI] [PubMed] [Google Scholar]
- (5).Giaccia A, Siim BG, Johnson RS. Nat. Rev. Drug Discov. 2003;2:803–811. doi: 10.1038/nrd1199. [DOI] [PubMed] [Google Scholar]
- (6).Zhong H, De Marzo AM, Laughner E, Lim M, Hilton DA, Zagzag D, Buechler P, Isaacs WB, Semenza GL, Simons JW. Cancer Res. 1999;59:5830–5835. [PubMed] [Google Scholar]
- (7).Bos R, Zhong H, Hanrahan CF, Mommers EC, Semenza GL, Pinedo HM, Abeloff MD, Simons JW, van Diest PJ, van der Wall E. J. Natl. Cancer Inst. 2001;93:309–314. doi: 10.1093/jnci/93.4.309. [DOI] [PubMed] [Google Scholar]
- (8).a) Jiang BH, Agani F, Passaniti A, Semenza GL. Cancer Res. 1997;57:5328–5335. [PubMed] [Google Scholar]; b) Maxwell PH, Dachs GU, Gleadle JM, Nicholls LG, Harris AL, Stratford IJ, Hankinson O, Pugh CW, Ratcliffe PJ. Proc. Natl. Acad. Sci. U.S.A. 1997;94:8104–8109. doi: 10.1073/pnas.94.15.8104. [DOI] [PMC free article] [PubMed] [Google Scholar]; c) Ryan HE, Poloni M, McNulty W, Elson D, Gassmann M, Arbeit JM, Johnson RS. Cancer Res. 2000;60:4010–4015. [PubMed] [Google Scholar]; d) Kung AL, Wang S, Klco JM, Kaelin WG, Livingston DM. Nat. Med. 2000;6:1335–1340. doi: 10.1038/82146. [DOI] [PubMed] [Google Scholar]; e) Unruh A, Ressel A, Mohamed HG, Johnson RS, Nadrowitz R, Richter E, Katschinski DM, Wenger RH. Oncogene. 2003;22:3213–3220. doi: 10.1038/sj.onc.1206385. [DOI] [PubMed] [Google Scholar]
- (9).Tian H, McKnight SL, Russell DW. Genes Dev. 1997;11:72–82. doi: 10.1101/gad.11.1.72. [DOI] [PubMed] [Google Scholar]
- (10).a) Martín JD, Darias J. Chapter 3. In: Scheuer PJ, editor. In Marine Natural Products: Chemical and Biological Perspectives. Vol. I. Academic Press; New York: 1978. pp. 125–173. [Google Scholar]; b) Iliopoulou D, Roussis V, Pannecouque C, De Clercq E, Vagias C. Tetrahedron. 2002;58:6749–6755. [Google Scholar]; c) Suzuki M, Daitoh M, Vairappan CS, Abe T, Masuda M. J. Nat. Prod. 2001;64:597–602. doi: 10.1021/np0006317. [DOI] [PubMed] [Google Scholar]
- (11).a) Iliopoulou D, Mihopoulos N, Roussis V, Vagias C. J. Nat. Prod. 2003;66:1225–1228. doi: 10.1021/np0301184. [DOI] [PubMed] [Google Scholar]; b) Iliopoulou D, Mihopoulos N, Vagias C, Papazafiri P, Roussis V. J. Org. Chem. 2003;68:7667–7674. doi: 10.1021/jo0342323. [DOI] [PubMed] [Google Scholar]
- (12).Cardellina JH, II, Horsley SB, Clardy J, Leftow SR, Meinwald J. Can. J. Chem. 1982;60:2675–2677. [Google Scholar]
- (13).Horsley SB, Cardellina JH, II, Meinwald J. J. Org. Chem. 1981;46:5033–5035. [Google Scholar]
- (14).Suzuki M, Matsuo Y, Takeda S, Suzuki T. Phytochemistry. 1993;33:651–656. [Google Scholar]
- (15).Suzuki M, Kondo H, Tanaka I. Chem. Lett. 1991;1:33–34. [Google Scholar]
- (16).Ohtani I, Kusumi T, Kashman Y, Kakisawa H. J. Am. Chem. Soc. 1991;113:4902–4906. [Google Scholar]
- (17).Su B, Park EJ, Mbwambo ZH, Santarsiero BD, Mesecar AD, Fong HHS, Pezzuto JM, Kinghorn AD. J. Nat. Prod. 2002;65:1278–1282. doi: 10.1021/np0202475. [DOI] [PubMed] [Google Scholar]
- (18).a) Wang GL, Semenza GL. Blood. 1993;82:3610–3615. [PubMed] [Google Scholar]; b) Salnikow K, Su W, Blagosklonny MV, Costa M. Cancer Res. 2000;60:3375–3378. [PubMed] [Google Scholar]
- (19).a) Toi M, Inada K, Suzuki H, Tominaga T. Breast Cancer Res. Treat. 1995;36:193–204. doi: 10.1007/BF00666040. [DOI] [PubMed] [Google Scholar]; b) Obermair A, Kucera E, Mayerhofer K, Speiser P, Seifert M, Czerwenka K, Kaider A, Leodolter S, Kainz C, Zeillinger R. Int. J. Cancer. 1997;74:455–458. doi: 10.1002/(sici)1097-0215(19970822)74:4<455::aid-ijc17>3.0.co;2-8. [DOI] [PubMed] [Google Scholar]
- (20).Ferrara N, Gerber HP, LeCouter J. Nat. Med. 2003;9:669–676. doi: 10.1038/nm0603-669. [DOI] [PubMed] [Google Scholar]
- (21).Hodges T, Hossain FC, Kim Y-P, Zhou Y-D, Nagle DG. J. Nat. Prod. 2004;67:767–771. doi: 10.1021/np030514m. [DOI] [PubMed] [Google Scholar]
- (22).Blancher C, Moore JW, Talks KL, Houlbrook S, Harris AL. Cancer Res. 2000;60:7106–7113. [PubMed] [Google Scholar]
- (23).Bachelder RE, Crago A, Chung J, Wendt MA, Shaw LM, Robinson G, Mercurio AM. Cancer Res. 2001;61:5736–5740. [PubMed] [Google Scholar]
- (24).Alley MC, Scudiero DA, Monks A, Hursey ML, Czerwinski MJ, Fine DL, Abbott BJ, Mayo JG, Shoemaker RH, Boyd MR. Cancer Res. 1988;48:589–601. [PubMed] [Google Scholar]
- (25).a) Ivan M, Kondo K, Yang H, Kim W, Valiando J, Ohh M, Salic A, Asara JM, Lane WS, Kaelin WG., Jr. Science. 2001;292:464–468. doi: 10.1126/science.1059817. [DOI] [PubMed] [Google Scholar]; b) Jaakkola P, Mole DR, Tian YM, Wilson MI, Gielbert J, Gaskell SJ, Kriegsheim AV, Hebestreit HF, Mukherji M, Schofield CJ, Maxwell PH, Pugh CW, Ratcliffe PJ. Science. 2001;292:468–472. doi: 10.1126/science.1059796. [DOI] [PubMed] [Google Scholar]
- (26).Chandel NS, Maltepe E, Goldwasser E, Mathieu CE, Simon MC, Schumacker PT. Proc. Natl. Acad. Sci. U.S.A. 1998;95:11715–11720. doi: 10.1073/pnas.95.20.11715. [DOI] [PMC free article] [PubMed] [Google Scholar]
- (27).Hagen T, Taylor CT, Lam F, Moncada S. Science. 2003;302:1975–1978. doi: 10.1126/science.1088805. [DOI] [PubMed] [Google Scholar]
- (28).Rapisarda A, Uranchimeg B, Scudiero DA, Selby M, Sausville EA, Shoemaker RH, Melillo G. Cancer Res. 2002;62:4316–4324. [PubMed] [Google Scholar]
- (29).a) Woodward RB, Loftfield RB. J. Am. Chem. Soc. 1941;63:3167–3171. [Google Scholar]; b) Sodeoka M, Baba Y, Kobayashi S, Hirukawa N. Bioorg. Med. Chem. Lett. 1997;7:1833–1836. [Google Scholar]
- (30).Wessels M, Konig GM, Wright AD. J. Nat. Prod. 2000;63:920–928. doi: 10.1021/np9905721. [DOI] [PubMed] [Google Scholar]
- (31).Kokoszka JE, Coskun P, Esposito LA, Wallace DC. Proc. Natl. Acad. Sci. 2001;98:2278–2283. doi: 10.1073/pnas.051627098. [DOI] [PMC free article] [PubMed] [Google Scholar]