

Abstract
Background and Aims
Insulin-like growth factor (IGF)-axis mediated signaling pathways play an important role in pancreatic cancer development and progression. We examined if IGF-axis gene variants are associated with clinical outcome in pancreatic cancer.
Methods
We retrospectively genotyped 41 single nucleotide polymorphisms (SNPs) from 10 IGF-axis genes in 333 patients with localized pancreatic adenocarcinoma and validated the findings in 373 patients with advanced disease. Associations between genotype and overall survival (OS) were evaluated using multivariable Cox proportional hazard regression models.
Results
IGF1 *8470T>C, IGF1R IVS2+46329T>C, IGFBP3 A32G, IRS1 G972R in patients with localized disease; IGF1R IVS20-3431A>G, IGF1R T766T, IGFBP3 -202A>C, IRS1 IVS1+4315C>G, IRS1 G972R in patients with advanced disease; and IGF1R T766T, IGF2R L252V, IGFBP3 -202A>C, IRS1 IVS1+4315C>G, IRS1 G972R, IRS2 IVS1+5687T>C in all patients were significantly associated with OS (P ≤ 0.007). Two haplotypes containing the variant allele of either IRS1 G972R or IVS1-10949G>A, and an IRS2 haplotype predicted worse OS (P ≤ 0.002). A significant correlation between increased number of unfavorable-genotypes and decreased OS was observed, patients with 0–1 (n=247), 2 (n=237), 3 (n=145), 4 (n=60) and 5–8 (n=17) unfavorable-genotypes had median survival time of 24.2, 16.4, 14.4, 9.6 and 7.4 months, respectively (P < 0.001). Several SNPs of IGF1R, IGF2R, and IRS1 gene were significantly associated with tumor response to therapy and disease stage.
Conclusion
These data suggest that individual genetic variations in the IGF axis pathway may predict for worse survival in patients with pancreatic cancer. This information may identify population subgroups that could benefit from IGFR-targeted agents.
Keywords: pancreatic cancer, Insulin-like growth factor (IGF)-axis, single nucleotide polymorphism, overall survival
INTRODUCTION
Pancreatic cancer is the fourth-leading cause of cancer mortality in the United States, with estimated 42,470 new cases and 35,240 deaths in 20091. As one of the most aggressive and treatment-resistant cancers, pancreatic cancer has the lowest 5-year survival rate among all malignancies1. Despite the advances in understanding of the molecular mechanisms in pancreatic cancer development, molecular-targeted therapy has not been translated into reduced mortality or improved survival in this deadly disease2. One of the clinical challenges is how to identify patients who are most likely to benefit from each type of molecular targeted therapies. Recent developments in pharmacogenetics have shown that patients’ genetic variations in drug metabolism and DNA repair are associated with their individual responses to cytotoxic cancer therapies. However, few studies have investigated whether genetic variations in the genes/signaling pathways involved in molecular-targeted therapies are associated with heterogeneity in response to therapy or with patient survival. To fill this gap in knowledge, in the current study, we examined association of gene variants in the insulin-like growth factor (IGF) axis genes with clinical outcome of pancreatic cancer.
The IGF-axis consists of the ligands IGF1 and IGF2, IGF receptors IGF1R and IGF2R (IGF2 receptor), the IGF binding protein family (IGFBP1-6), and the proteins involved in intracellular signaling such as insulin-receptor substrate (IRS) family (IRS1-4). The IGF1 gene encodes a protein similar in function and structure to insulin. IGF2 is an imprinted gene expressed only from the paternally inherited allele. IGF-axis plays a pivotal role in maintaining tissue homeostasis, regulating cell proliferation, differentiation, and migration3, 4. IGF-axis signaling pathway affects tumor biology via both metabolic and mitogenic pathways5, 6. For example, insulin resistance contributes to the development of obesity- and diabetes-associated pancreatic cancer. Besides integration with the epidermal growth factor (EGF)/EGF receptor (EGFR), c-Jun-NH2-kinase (JNK)7–9 and met proto-oncogene (Met)10 signaling pathways, IGF-axis mediates activation of the RAS/mitogen-activated protein kinase (MAPK)/extracellular signal-regulated kinase (ERK) and phosphatidylinositol-3′-kinase (PI3K)/v-akt murine thymoma viral oncogene homolog (AKT)/mammalian target of rapamycin (mTOR) pathways to promote tumor development11, 12. Because of its important role in regulating cell survival and death, the IGF-axis has emerged as a therapeutic target for cancer treatment13, 14.
In this study, we tested the hypothesis that genetic variations in the IGF-axis modify clinical outcome in pancreatic cancer. We successfully genotyped 41 single nucleotide polymorphisms (SNPs) including 21 tagging SNPs and 20 functional SNPs of 10 IGF-axis genes (IGF1, IGF2, IGF1R, IGF2R, IGFBP1, IGFBP3, IGFBP5, IRS1, IRS2, and IRS4) which encodes the core components of IGF-axis upstream the PI3K/AKT/mTOR and RAS/MAPK/ERK signaling pathways (Fig. 1). We evaluated the association of the above genotypes with overall survival (OS) and tumor characteristics to explore a potential role of polymorphic variants of the IGF-axis genes in determining clinical outcome in pancreatic cancer.
Fig. 1.
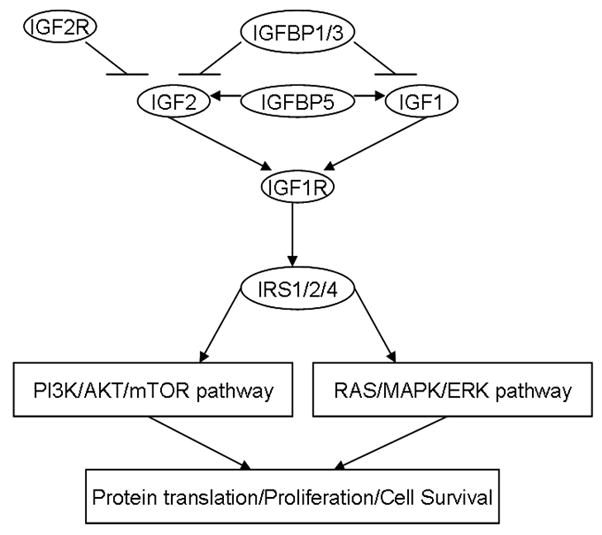
Selected IGF-axis genes that encode core components of IGF-axis upstream the PI3K/AKT/mTOR and RAS/MAPK/ERK pathway. The ligands IGF1 and IGF2 bind to the receptor IGF1R at the cellular level. The bioavailability of IGFs is decreased by IGFBP1 and IGFBP3, but increased by IGFBP5. IGF2 is inhibited by negative feedback of IGF2R, which blocks the signal transduction. IGF1R regulate the downstream PI3K/AKT/mTOR and RAS/MAPK/ERK pathways via activation of IRS proteins.
PATIENTS AND METHODS
Patient Recruitment and Data Collection
The 706 patients included 154 patients with potentially resectable tumor enrolled onto phase II clinical trials of preoperative gemcitabine-based chemoradiation15 and 552 patients recruited in a case-control study conducted at The University of Texas M. D. Anderson Cancer Center from February 1999 through May 2007 and follow-up to August 2009. The eligibility criteria for patient selection were: 1) having been diagnosed with a pathologically confirmed pancreatic ductal adenocarcinoma; 2) having an available DNA sample. All patients signed an informed consent for medical record review and gave a DNA sample. The study was approved by M. D. Anderson Cancer Center’s Institutional Review Board and was conducted in accordance with all current ethical guidelines.
We reviewed patients’ medical records and retrieved information on: date of patient diagnosis, date of death or last follow-up, tumor resection status, clinical tumor stage, patient performance status, tumor site, tumor size, tumor differentiation, serum markers for liver, kidney and pancreas functions (biochemical index), and level of serum carbohydrate antigen 19-9 (CA19-9) at diagnosis. Clinical tumor staging followed the objective computed tomography (CT) criteria: localized or potentially resectable tumors are defined as (1) no evidence of extrapancreatic disease; (2) no evidence of tumor extension to the superior mesenteric artery (SMA) or celiac axis; and (3) no evidence of occlusion of the superior mesenteric vein (SMV) or SMV–portal vein (PV) confluence. Tumor abutment and encasement of the SMV, in the absence of vessel occlusion or extension to the SMA was considered resectable. Locally advanced tumors are those unresectable but without distant metastasis. Tumor response to preoperative therapy by CT at the time of restaging was evaluated among patients who had a localized tumor and received preoperative chemoradiotherapy only. Tumor margin and lymph node status were evaluated among patients with resected tumors only. The clinical information was double-checked by different researchers. Dates of death were obtained and cross-checked using at least one of the following sources: M. D. Anderson Cancer Center’s tumor registry, inpatient medical records, or the United States Social Security Death Index (www.deathindexes.com/ssdi.html). OS was calculated from the date of diagnosis to the date of death or last follow-up.
DNA Extraction, SNP Selection and Genotyping
DNA was extracted from peripheral lymphocytes using Qiagen DNA isolation kits (Valencia, CA). The genes, nucleotide substitutions, function, reference SNP identification numbers, and minor allele frequency (MAF) of the 45 SNPs examined are summarized in Table 1. Twenty-three tagging SNPs were selected using the SNPbrowser software (Applied Biosystems, www.allsnps.com/snpbrowser) with a cutoff of 0.8 for r2 and a MAF≥10% in Caucasians from the HapMap Project database (www.hapmap.org). We chose 22 functional SNPs located in coding region (nonsynonymous or synonymous) or untranslated region (UTR) with a MAF≥1% in Caucasians. The protein sequences, structures, homology models, mRNA transcripts, and predicted functions for the examined SNPs were evaluated using F-SNP (Queen’s University, Kingston, Ontario, Canada)16. Genotyping used the mass spectroscopy-based MassArray (Sequenom, Inc, San Diego, CA) and the Taqman method. Genotyping was successful in 41 of the 45 SNPs (Table 1). Randomly selected 20% of the total samples were genotyped in duplicate, showed 99.9% concordance. The inconsistent data were excluded from final analysis.
Table 1.
SNPs Examined and Allele Frequency
| Gene | Chromosome | SNP | Function | RS# | Minor Allele Frequency |
|
|---|---|---|---|---|---|---|
| Observed | Reported* | |||||
| IGF1 | 12q22-q23 | -1409T>C | 5′ Flank | 35767 | 0.176 | 0.161 |
| IVS2+10605A>G | Intron | 7956547 | 0.255 | 0.25 | ||
| IVS2+12719G>C | Intron | 2195239 | 0.252 | 0.235 | ||
| IVS2+25185C>T | Intron | 10735380 | 0.296 | 0.285 | ||
| *8470T>C | 3′ Flank | 2946834 | 0.335 | 0.313 | ||
| *10212C>A | 3′ Flank | 10860862 | 0.187 | 0.175 | ||
| Ex4-517G>A | 3′UTR | 6219 | failed | 0.076 | ||
| Ex4+2776G>A | 3′UTR | 6214 | 0.30 | 0.421 | ||
| Ex4-2894G>A | 3′UTR | 1063599 | failed | 0.16 | ||
| IGF1R | 15q26.3 | IVS2-70184A>G | Intron | 2684761 | 0.39 | 0.415 |
| IVS2-35846T>C | Intron | 1879612 | 0.444 | 0.42 | ||
| IVS2+46329T>C | Intron | 8041224 | 0.401 | 0.40 | ||
| IVS11+538G>A | Intron | 4966044 | 0.381 | 0.392 | ||
| IVS15+1950A>G | Intron | 7166558 | 0.411 | 0.392 | ||
| IVS17-598C>T | Intron | 2684799 | 0.407 | 0.492 | ||
| IVS20-3431A>G | Intron | 12437963 | 0.181 | 0.142 | ||
| IVS20-797G>T | Intron | 2872060 | 0.482 | 0.457 | ||
| Ex11+97C>T | T766T | 3743262 | 0.058 | 0.058 | ||
| Ex16-58G>A | E1043E | 2229765 | 0.439 | 0.419 | ||
| Ex21+316C>T | Y1346Y | 17847203 | 0.063 | 0.056 | ||
| IGF2 | 11p15.5 | *4352A>G | 3′ Flank | 11042751 | 0.189 | 0.29 |
| IVS2+384C>T | Intron | 734351 | failed | 0.387 | ||
| IGF2R | 6q26 | Ex6-23C>G | L252V | 8191754 | 0.124 | 0.142 |
| Ex9+5A>G | S350S | 1570070 | 0.348 | 0.342 | ||
| Ex16+88A>G | T713T | 998075 | 0.483 | 0.452 | ||
| Ex45+11C>T | L2222L | 1803989 | 0.107 | 0.097 | ||
| IGFBP1 | 7p13-p12 | Ex4+111A>G | I253M | 4619 | 0.40 | 0.36 |
| IGFBP3 | 7p13-p12 | Ex1+227C>G | A32G | 2854746 | 0.39 | 0.403 |
| Ex5-411A>T | 3′UTR | 6670 | 0.211 | 0.197 | ||
| Ex2+70A>C | H164P | 9282734 | 0.005 | 0.01 | ||
| -202A>C | Promoter | 2854744 | 0.48 | 0.476 | ||
| IGFBP5 | 2q33-q36 | IVS1-6727A>C | Intron | 7420849 | 0.43 | 0.45 |
| Ex2+75C>T | R138W | 11575194 | 0.043 | 0.05 | ||
| IRS1 | 2q36 | IVS1-10949G>A | Intron | 35802832 | 0.045 | 0.12 |
| IVS1+4315C>G | Intron | 2288586 | 0.07 | 0.097 | ||
| IVS1+14180A>T | Intron | 1025333 | failed | 0.15 | ||
| Ex1-840G>A | G972R | 1801278 | 0.076 | 0.07 | ||
| Ex1-2217G>C | A512P | 1801276 | 0.026 | 0.06 | ||
| IRS2 | 13q34 | IVS1+166T>C | Intron | 9521511 | 0.391 | 0.43 |
| IVS1+2498G>A | Intron | 7981705 | 0.169 | 0.175 | ||
| IVS1+5687T>C | Intron | 1974134 | 0.299 | 0.44 | ||
| Ex1-1526C>T | P829P | 12853546 | 0.229 | 0.177 | ||
| Ex1-843G>A | G1057D | 1805097 | 0.315 | 0.21 | ||
| Ex2+750A>G | 3′UTR | 2289046 | 0.362 | 0.379 | ||
| IRS4 | Xq22.3 | Ex1+137G>A | A20A | 2073115 | 0.18 | 0.167 |
SNP, single nucleotide polymorphism; RS#, reference SNP identification number; UTR, untranslated region.
The reported minor allele frequency was from the SNP500Cancer and NCBI dbSNP databases.
Statistical Analysis
The distribution of genotypes was examined for Hardy-Weinberg equilibrium with the goodness-of-fit chi-squared test. Genotype and allele frequency of the SNPs were determined by direct gene counting. Haplotype diversity and linkage disequilibrium index (Lewontin’s D′ and r2) were calculated by SNPAlyze software (DYNACOM Co, Ltd, Mobara, Japan). The homozygous and heterozygous genotypes were combined if the frequency of the homozygote was very low or if both genotypes had the same trend of effect (e.g., shorter OS compared with the referent group). The association between genotype or haplotype and OS was estimated using the Kaplan-Meier method and the log-rank test. The median follow-up time was computed using censored observations only. Hazard ratios (HR) and 95% CI were estimated using the multivariate Cox regression proportional hazards model adjusting for sex, age, race, clinical stage, tumor resection, tumor size and site, serum CA19-9 level and performance status at diagnosis. The association of genotype with tumor response to therapy or tumor differentiation was evaluated using logistic regression adjusting for the clinical factors. All statistical testing used SPSS software (SPSS Inc, Chicago, IL). The false discovery rate (FDR) was estimated using the Beta-Uniform Mixture (BUM) approach17. The model is used to obtain an estimated distribution expressed as a mixture of null and alternative densities. Given a threshold of significance, the estimated distribution is partitioned into regions corresponding to the occurrences of false positives17. To evaluate the association of genotype and OS, for 70 comparisons in 41 SNPs (42 in dominant and 28 in recessive inheritance modes, with ≥20 patients per group), we found a P value of 0.007 corresponded to an FDR of 10%. Any P ≤ 0.007 in the genotype analysis was considered statistically significant.
RESULTS
Patients’ Characteristics
The patients’ characteristics and clinical predictors for OS are described in Table 2. The 706 patients were divided into a training set of 333 patients with localized tumors and a validation set of 373 patients with advanced disease (locally advanced and metastatic tumors). The training set included 154 patients who were treated on protocol and 179 patients who were treated off protocol with gemcitabine-based chemoradiation. Two hundred seventy five patients achieved tumor resection. The 373 patients with advanced tumor included 211 patients with locally advanced disease and 162 patients with metastatic disease. At the end of the study, 568 of the 706 patients (80.5%) were dead. The median follow-up time was 46.0 months for the living patients. The median survival time (MST) was 17.2 months (95% CI, 15.8–18.5) for the 706 patients. Patients with unresected tumor, advanced disease stage, an elevated CA19-9 serum level, a tumor size>2cm, tumors located in the body or tail of the pancreas, poorly differentiated tumors, poor response to therapy, poor performance status, abnormal biochemical index were significantly associated with reduced OS.
Table 2.
Patient’s Characteristics and Clinical Predictors for Overall Survival
| Variable | No. of Patients | No. of Deaths | MST (months) | P (log-rank) |
|---|---|---|---|---|
| Gender | 0.48 | |||
| Female | 281 | 235 | 17.5 | |
| Male | 425 | 333 | 16.8 | |
| Age (years) | 0.22 | |||
| ≤ 50 | 90 | 80 | 16.4 | |
| 51–60 | 181 | 142 | 18.4 | |
| 61–70 | 272 | 213 | 17.2 | |
| > 70 | 163 | 133 | 16.5 | |
| Race | 0.63 | |||
| White | 624 | 502 | 16.6 | |
| Hispanic | 43 | 35 | 16.8 | |
| Black | 27 | 21 | 20.2 | |
| Other | 12 | 10 | 17.3 | |
| Clinical Stage | <0.001 | |||
| Localized | 333 | 237 | 28.5 | |
| Locally Advanced | 211 | 188 | 14.7 | |
| Metastatic | 162 | 143 | 9.2 | |
| Performance Status | <0.001 | |||
| 0 | 148 | 106 | 31.0 | |
| 1 | 483 | 394 | 16.0 | |
| 2–3 | 75 | 68 | 9.5 | |
| Tumor Size (cm) | <0.001 | |||
| ≤ 2 | 134 | 94 | 27.5 | |
| > 2 | 572 | 474 | 15.3 | |
| Tumor Site | 0.001 | |||
| Head | 511 | 411 | 18.2 | |
| Non-head | 195 | 157 | 13.7 | |
| CA 19-9 (U/ml) | <0.001 | |||
| ≤ 47 | 161 | 107 | 32.1 | |
| 48–500 | 291 | 237 | 18.0 | |
| 500–1000 | 73 | 60 | 14.5 | |
| > 1000 | 181 | 164 | 10.6 | |
| Tumor Differentiation† | <0.001 | |||
| Well to Moderate | 355 | 261 | 26.2 | |
| Poorly | 139 | 120 | 12.0 | |
| Tumor Response to Therapy‡ | <0.001 | |||
| PR/SD | 225 | 146 | 35.8 | |
| PD | 36 | 35 | 9.3 | |
| Tumor Resection | <0.001 | |||
| Yes | 275 | 179 | 35.9 | |
| No | 431 | 389 | 12.0 | |
| Biochemical Index* | 0.008 | |||
| 0–2 | 303 | 230 | 18.9 | |
| 3–6 | 362 | 302 | 16.0 | |
| 7–9 | 41 | 36 | 12.9 |
MST, median survival time; CI, confidence interval; HR, hazard ratio; CA 19-9, carbohydrate antigen 19-9; PR, partial response; SD, stable disease; PD, progressive disease.
This information was available for patients with cytological diagnosis only.
Tumor response to therapy was evaluated in patients received preoperative chemoradiotherapy by CT at restaging. Node and margin status was evaluated in surgical patients only.
Biochemical index represents the number of serum markers with abnormal value. The markers include aspartate aminotransferase, lactic dehydrogenase, alkaline phosphatase, alanine aminotransferase, amylase, creatinine, hemoglobin, albumin, bilirubin, and fasting glucose.
Genotype Distribution and Allele Frequency
The observed MAF among the patients were comparable to the reported frequency in general population (Table 1). The distribution of 41 SNPs followed the Hardy-Weinberg equilibrium (P>0.05) except for IRS2 Ex2+750A>G, IRS4 A20A (P=0.001). Genotype distribution differed according to sex and race, e.g., men had a higher frequency of IRS1 IVS1-10949GG and IRS2 P829P CC/TC genotype than women had (P≤0.007); white patients had a higher frequency of IGF2 *4352AA and IGF1R IVS2-35846TT/TC genotype than non-white patients had (P<0.001). The haplotype diversity and the linkage disequilibrium data of the 41 SNPs are summarized in supplemental Tables 1 and 2, respectively.
Association of Genotype with Overall Survival
The association of each genotype with OS was first evaluated in the training set of 333 patients with resectable tumors and then analyzed in the validation set of 373 patients with advanced disease (Table 3). To increase power, data from the training set and validation set was also analyzed in combination. IGF1 *8470T>C, IGF1R IVS2+46329T>C, IGFBP3 A32G, and IRS1 G972R in patients with localized disease; IGF1R IVS20-3431A>G, IGF1R T766T, IGFBP3 -202A>C, IRS1 IVS1+4315C>G and IRS1 G972R in patients with advanced disease; and IGF1R T766T, IGF2R L252V, IGFBP3 -202A>C, IRS1 IVS1+4315C>G, IRS1 G972R, and IRS2 IVS1+5687T>C in all patients were significantly associated with OS after adjusting for clinical factors (P ≤ 0.007). Two of the four SNPs identified in the training set, i.e. IGF1 *8470T>C and IGFBP3 A32G genotype showed significant associations with OS in patients with localized disease but not in patients with advanced disease. The IGF1R T766T, IGFBP3 -202A>C, IRS1 G972R and IRS2 IVS1+5687T>C genotype showed consistent associations with OS in both training set and validation set and in the combined dataset. The IRS1 IVS1+4315C>G GG genotype and the IGF2R L252V GG genotype was associated with much reduced OS in different patient groups but the frequency of these homozygous variants was extremely low (<2%).
Table 3.
Association of Genotype with Overall Survival
| Genotype | Training |
Validation |
Combined dataset |
||||||||
|---|---|---|---|---|---|---|---|---|---|---|---|
| No. of Patients/No. of Deaths | MST | HR† (95%CI) | P† | No. of Patients/No. of Deaths | MST | HR† (95%CI) | P† | MST | HR† (95% CI) | P† | |
| IGF1 *8470T>C | |||||||||||
| CC | 150/94 | 28.7 | 1.0 | 161/145 | 11.4 | 1.0 | 16.5 | 1.0 | |||
| CT | 142/110 | 29.8 | 1.38 (1.04–1.83) | .02 | 169/149 | 12.5 | 0.97 (0.77–1.22) | .80 | 17.7 | 1.08 (0.90–1.29) | .39 |
| TT | 41/33 | 25.7 | 2.01 (1.33–3.03) | <.001 | 38/33 | 13.5 | 0.89 (0.60–1.31) | .55 | 18.0 | 1.22 (0.92–1.61) | .16 |
| IGF1R IVS2+46329T>C | |||||||||||
| CC | 140/89 | 33.3 | 1.0 | 120/109 | 14.5 | 1.0 | 20.5 | 1.0 | |||
| TC | 144/112 | 24.3 | 1.49 (1.12–1.99) | .006 | 178/161 | 11.4 | 1.23 (0.96–1.58) | .11 | 14.4 | 1.34 (1.11–1.62) | .002 |
| TT | 49/36 | 31.0 | 1.06 (0.71–1.58) | .76 | 72/58 | 14.5 | 0.94 (0.68–1.31) | .73 | 18.7 | 1.06 (0.83–1.37) | .62 |
| CC/TT vs. TC | 1.47 (1.13–1.91) | .004 | 1.26 (1.01–1.57) | .04 | 1.32 (1.11–1.56) | .01 | |||||
| IGF1R IVS20-3431A>G | |||||||||||
| AA | 232/170 | 26.4 | 1.0 | 240/211 | 13.2 | 1.0 | 17.6 | 1.0 | |||
| GA | 89/59 | 33.6 | 0.76 (0.56–1.03) | .07 | 122/109 | 10.4 | 1.36 (1.07–1.72) | .01 | 15.3 | 1.12 (0.94–1.35) | .21 |
| GG | 12/8 | 16.2 | 1.11 (0.54–2.29) | .78 | 10/10 | 4.9 | 1.65 (0.85–3.19) | .14 | 12.0 | 1.30 (0.80–2.10) | .29 |
| AA vs. GG/GA | 0.78 (0.58–1.04) | .09 | 1.40 (1.11–1.77) | .004 | 1.14 (0.95–1.36) | .15 | |||||
| IGF1R T766T | |||||||||||
| CC | 301/211 | 30.6 | 1.0 | 327/287 | 12.6 | 1.0 | 18.2 | 1.0 | |||
| CT | 31/25 | 15.5 | 1.59 (1.04–2.45) | .03 | 43/41 | 8.0 | 1.70 (1.20–2.39) | .002 | 10.3 | 1.61 (1.22–2.12) | <.001 |
| TT | 1/1 | 9.2 | 2.60 (0.32–21.1) | .37 | 3/3 | 7.3 | 3.50 (1.02–12.02) | .046 | 7.3 | 2.50 (0.89–7.02) | .08 |
| CC vs. CT/TT | 1.61 (1.06–2.46) | .02 | 1.77 (1.27–2.47) | <.001 | 1.66 (1.28–2.16) | <.001 | |||||
| IGF2R L252V | |||||||||||
| CC | 256/175 | 30.4 | 1.0 | 288/261 | 12.0 | 1.0 | 17.5 | 1.0 | |||
| CG | 72/57 | 26.2 | 1.20 (0.88–1.64) | .24 | 75/61 | 13.6 | 0.86 (0.65–1.15) | .32 | 16.4 | 1.01 (0.82–1.24) | .95 |
| GG | 5/5 | 11.0 | 2.92 (1.09–7.77) | .03 | 9/8 | 11.1 | 1.67 (0.82–3.42) | .16 | 11.0 | 2.36 (1.31–4.23) | .004 |
| CC vs. GG/CG | 2.81 (1.06–7.47) | .038 | 1.73 (0.85–3.52) | .13 | |||||||
| IGF2R S350S | |||||||||||
| AA | 156/97 | 36.4 | 1.0 | 156/143 | 12.4 | 1.0 | 18.7 | 1.0 | |||
| AG | 139/107 | 21.7 | 1.28 (0.96–1.70) | .09 | 158/139 | 12.0 | 1.00 (0.78–1.26) | .97 | 16.5 | 1.11 (0.92–1.33) | .26 |
| GG | 38/33 | 22.9 | 1.72 (1.13–2.61) | .01 | 59/49 | 12.1 | 1.02 (0.74–1.42) | .89 | 15.1 | 1.25 (0.97–1.62) | .09 |
| IGFBP3 A32G | |||||||||||
| GG | 137/108 | 22.9 | 1.0 | 132/114 | 11.1 | 1.0 | 16.4 | 1.0 | |||
| GC | 145/99 | 29.8 | 0.71 (0.54–0.93) | .01 | 176/157 | 13.9 | 0.89 (0.69–1.13) | .33 | 17.9 | 0.81 (0.67–0.97) | .02 |
| CC | 49/30 | 34.8 | 0.58 (0.38–0.87) | .009 | 65/60 | 11.8 | 1.08 (0.78–1.48) | .65 | 15.3 | 0.88 (0.69–1.13) | .33 |
| GG vs. CC/GC | 0.67 (0.52–0.87) | .003 | 0.93 (0.74–1.18) | .55 | 0.83 (0.70–0.98) | .029 | |||||
| IGFBP3 -202A>C | |||||||||||
| CC | 72/57 | 24.5 | 85/73 | 10.3 | 1.0 | 14.7 | |||||
| AC | 173/119 | 30.1 | 0.72 (0.52–0.99) | .046 | 195/175 | 13.4 | 0.65 (0.49–0.87) | .003 | 17.8 | 0.68 (0.55–0.84) | <.001 |
| AA | 88/61 | 28.5 | 0.69 (0.48–0.99) | .049 | 93/83 | 12.5 | 0.70 (0.50–0.98) | .039 | 17.6 | 0.71 (0.55–0.91) | .006 |
| CC vs. AA/AC | 0.71 (0.52–0.96) | .02 | 0.67 (0.51–0.87) | .003 | 0.69 (0.57–0.84) | <.001 | |||||
| IRS1 IVS1+4315C>G | |||||||||||
| CC | 284/199 | 30.4 | 1.0 | 327/289 | 12.0 | 1.0 | 17.3 | 1.0 | |||
| CG | 46/35 | 18.2 | 1.39 (0.96–2.02) | .08 | 42/38 | 12.3 | 1.15 (0.8–1.65) | .44 | 17.2 | 1.22 (0.94–1.57) | .13 |
| GG | 3/3 | 9.2 | 4.26 (1.25–14.5) | .02 | 2/2 | 3.2 | 22.8 (5.21–99.4) | <.001 | 3.5 | 5.63 (2.25–14.0) | <.001 |
| CC vs. CG/GG | 1.47 (1.02–2.11) | .03 | 1.23 (0.87–1.74) | .24 | 1.29 (1.01–1.65) | .04 | |||||
| IRS1 G972R | |||||||||||
| GG | 292/204 | 30.4 | 1.0 | 314/277 | 12.7 | 1.0 | 18.2 | 1.0 | |||
| GA | 38/30 | 12.9 | 1.65 (1.11–2.46) | .01 | 54/51 | 8.5 | 1.42 (1.05–1.93) | .02 | 10.1 | 1.50 (1.18–1.91) | .001 |
| AA | 3/3 | 6.2 | 3.25 (1.01–10.4) | .047 | 5/3 | 3.8 | 1.43 (0.44–4.58) | .55 | 6.2 | 2.26 (1.00–5.11) | .05 |
| GG vs. GA/AA | 1.74 (1.19–2.54) | .005 | 1.49 (1.10–2.01) | .009 | 1.53 (1.21–1.94) | <.001 | |||||
| IRS2 IVS1+5687T>C | |||||||||||
| TT | 205/140 | 31.2 | 1.0 | 132/112 | 13.6 | 1.0 | 20.7 | 1.0 | |||
| CT | 101/80 | 25.1 | 1.42 (1.06–1.89) | .01 | 179/164 | 12.0 | 1.24 (0.97–1.59) | .08 | 15.1 | 1.24 (1.03–1.49) | .02 |
| CC | 20/14 | 28.5 | 1.56 (0.89–2.73) | .12 | 43/39 | 10.1 | 1.45 (0.99–2.11) | .05 | 12.5 | 1.46 (1.07–1.98) | .01 |
| TT vs. CT/CC | 1.44 (1.09–1.89) | .009 | 132/112 | 11.8 | 1.28 (1.01–1.62) | .04 | 1.27 (1.07–1.52) | .007 | |||
| IRS4 A20A | |||||||||||
| GG | 244/167 | 30.1 | 275/238 | 12.2 | 17.5 | ||||||
| GA | 43/35 | 28.1 | 1.20 (0.80–1.80) | .37 | 54/50 | 11.8 | 1.31 (0.81–1.59) | .48 | 14.7 | 1.13 (0.87–1.46) | .35 |
| AA | 37/28 | 25.0 | 1.55 (1.01–2.39) | .048 | 41/40 | 12.8 | 1.10 (0.77–1.56) | .61 | 18.1 | 1.25 (0.96–1.64) | .10 |
| GG vs. GA/AA | 1.52 (1.00–2.34) | .05 | 1.11 (0.86–1.44) | .41 | 1.19 (0.97–1.44) | .09 | |||||
MST, median survival time (months); CI, confidence interval; HR: hazard ratio; CA19-9, carbohydrate antigen 19-9.
HR was estimated from multivariate Cox regression models including sex, race, clinical stage, tumor resection, CA 19-9, biochemical index and performance status
We analyzed the combined effect of individual SNPs on OS by including the unfavorable genotypes that were associated with reduced survival and had a P < 0.05 in the multivariable Cox regression model, i.e. IGF1R IVS2+46329T>C TC, T766T CT/TT, IGF2R L252V GG/CG, IGFBP3 A32G GC/CC, -202A>C CC, IRS1 IVS1+4315C>G CG/GG, G972R GA/AA, and IRS2 IVS1+5687T>C CT/CC. A strong association between having two or more unfavorable-genotypes and reduced OS in all patients was observed. Patients with 0–1 (n=247), 2 (n=237), 3 (n=145), 4 (n=60) and 5–8 (n=17) unfavorable-genotypes had MSTs of 24.2, 16.4, 14.4, 9.6 and 7.4 months, respectively (P < 0.001). Compared to patients with 0–1 unfavorable-genotype, for those carrying 2, 3, 4 or 5–8 unfavorable-genotypes, adjusted HR (95% CI) were 1.35 (1.09–1.67), 1.74 (1.38–2.20), 3.15 (2.28–4.34) and 6.79 (3.80–12.1), respectively.
Associations of Haplotype Diversity with OS
Eight haplotypes of IGF2R, IGFBP3, IGFBP5, IRS1 and IRS2 were associated with reduced or better OS in 706 patients in Cox regression after adjusting for clinical factors (P ≤ 0.05, Table 4). Two haplotypes CAGG and GGGG containing IRS1 G972R A allele and IVS1-10949G>A G allele, respectively, and one haplotype (AGCGCC) of IRS2 containing Ex2+750A>G A allele, G1057D G allele and IVS1+5687T>C C allele remained significant at the level of FDR < 10% (P ≤ 0.007).
Table 4.
Association of Haplotype Diversity with OS in All Patients
| Haplotype* | Frequency | MST | HR† (95% CI) | P |
|---|---|---|---|---|
| IGF2R | ||||
| ACAC | 0.3287 | 18.7 | 1.0 | |
| GTGC | 0.0577 | 16.5 | 1.28 (1.00–1.64) | 0.05 |
| IGFBP3 | ||||
| CGAT | 0.3748 | 16.3 | 1.0 | |
| ACAT | 0.2825 | 17.7 | 0.87 (0.77–0.99) | 0.04 |
| IGFBP5 | ||||
| CA | 0.538 | 17.5 | 1.0 | |
| TC | 0.01 | 5.0 | 2.73 (1.02–7.34) | 0.046 |
| IRS1 | ||||
| CGGG | 0.8243 | 18.1 | 1.0 | |
| CAGG | 0.072 | 10.3 | 1.41 (1.13–1.76) | 0.002 |
| GGGG | 0.033 | 13.3 | 1.76 (1.28–2.42) | <0.001 |
| IRS2 | ||||
| GACGTC | 0.2399 | 18.5 | 1.0 | |
| AGCGCT | 0.0595 | 14.3 | 1.35 (1.02–1.77) | 0.03 |
| GGCGTC | 0.0439 | 14.7 | 1.43 (1.04–1.96) | 0.03 |
| AGCGCC | 0.0405 | 14.3 | 1.67 (1.21–2.29) | 0.001 |
MST, median survival time (months); CI, confidence interval; HR: hazard ratio; CA19-9, carbohydrate antigen 19-9 HR values were from multivariate Cox regression models including sex, race, clinical stage, tumor resection, CA 19-9, biochemical index and performance status.
Haplotype of IGF2R T713T, L2222L, S350S, L252V; IGFBP3 -202A>C, A32G, H164P, Ex5-411A>T; IGFBP5 R138W, IVS1-6727A>C; IRS1 IVS1+4315C>G, G972R, IVS1-10949G>A, A512P; IRS2 Ex2+750A>G, G1057D, P829P, IVS1+2498G>A, IVS1+5687T>C, IVS1+166T>C. Those haplotypes with P>0.05 in Cox regression models were not shown.
Associations of Genotype with Tumor Characteristics
We examined the associations between genotypes with response to therapy, tumor stage and tumor resection status (Table 5). IGF1R IVS2-70184A>G, IGF2R L2222L and IRS1 G972R were associated with a poor tumor response to preoperative chemoradiotherapy and remained as significant predictors in logistic regression after adjusting for clinical factors (P ≤ 0.007). IGF1 Ex4+2776G>A, IGF1R IVS2-70184A>G, and IRS2 IVS1+5687T>C correlated with tumor stage (P ≤ 0.007). IGF1 Ex4+2776G>A, IGF1R IVS2-70184A>G, T766T, and IRS2 IVS1+5687T>C correlated with tumor resectability (P ≤ 0.007).
Table 5.
Association of Genotypes with Tumor Characteristics in All Patients
| Variable | Genotype | No. (%) | No. (%) | P (χ2) | OR† (95% CI) | P† |
|---|---|---|---|---|---|---|
| Response to Therapy | PR/SD | PD | ||||
| IGF1R IVS2-70184A>G | .001 | |||||
| AA | 108 (90.8) | 11 (9.2) | 1.0 | |||
| GA/GG | 116 (75.8) | 37 (24.2) | 4.81 (2.02–11.4) | <.001 | ||
| IGF1R IVS15+1950A>G | .001* | |||||
| GG | 51 (98.1) | 1 (1.9) | 1.0 | |||
| GA/AA | 186 (79.8) | 47 (20.2) | 14.3 (1.77–115) | .01 | ||
| IGF2R L252V | .01* | |||||
| CC/CG | 237 (84.0) | 45 (16.0) | 1.0 | |||
| GG | 1 (25.0) | 3 (75.0) | 23.8 (1.98–287) | .01 | ||
| IGF2R L2222L | .001 | |||||
| CC | 198 (86.8) | 30 (13.2) | 1.0 | |||
| TC/TT | 40 (69.0) | 18 (31.0) | 3.58 (1.59–8.06) | .002 | ||
| IRS1 G972R | <.001 | |||||
| GG | 217 (86.1) | 35 (13.9) | 1.0 | |||
| GA/AA | 21 (61.8) | 12 (36.2) | 3.71 (1.43–9.59) | .007 | ||
| Tumor Stage | Localized | Advanced | ||||
| IGF1R IVS2-70184A>G | <.001 | |||||
| AA | 162 (62.1) | 99 (37.9) | 1.0 | |||
| GA | 122 (41.4) | 173 (58.6) | 2.31 (1.57–3.39) | <.001 | ||
| GG | 33 (28.9) | 81 (71.1) | 4.23 (2.48–7.19) | <.001 | ||
| IGF1 Ex4+2776G>A | <.001 | |||||
| GG | 178 (58.2) | 128 (41.8) | 1.0 | |||
| GA | 100 (42.7) | 134 (57.3) | 1.82 (1.24–2.66) | .002 | ||
| AA | 23 (37.1) | 39 (62.9) | 2.62 (1.40–4.89) | .003 | ||
| IRS2 Ex2+750A>G | .004 | |||||
| AA/GG | 141 (41.7) | 197 (58.3) | 1.0 | |||
| GA | 192 (52.5) | 174 (47.5) | 0.66 (0.47–0.92) | .01 | ||
| IRS2 IVS1+5687T>C | <.001 | |||||
| TT | 205 (60.8) | 132 (39.2) | 1.0 | |||
| CT/CC | 121 (35.3) | 222 (64.7) | 2.51 (1.78–3.55) | <.001 | ||
| Tumor Resectability | Resectable | Unresectable | ||||
| IGF1R IVS2-70184A>G | .002 | |||||
| AA | 119 (45.6) | 142 (54.4) | 1.0 | |||
| GA | 112 (38) | 183 (62) | 1.20 (0.82–1.77) | .34 | ||
| GG | 30 (26.3) | 84 (73.7) | 2.16 (1.26–3.70) | .005 | ||
| IGF1 Ex4+2776G>A | .002 | |||||
| GG | 143 (46.7) | 163 (53.3) | 1.0 | |||
| GA/AA | 102 (34.5) | 194 (65.5) | 1.63 (1.13–2.36) | .007 | ||
| IRS2 IVS1+5687T>C | <.001 | |||||
| TT | 164 (48.7) | 173 (51.3) | 1.0 | |||
| CT/CC | 104 (30.3) | 239 (69.7) | 1.83 (1.29–2.60) | .001 | ||
| IGF1R T766T | .002 | |||||
| CC | 257 (40.9) | 371 (59.1) | 1.0 | |||
| CT/TT | 18 (23.1) | 60 (76.9) | 2.48 (1.33–4.63) | .004 | ||
OR, odds ratio; CI, confidence interval; PR, partial response; SD, stable disease; PD, progressive disease; CA19-9, carbohydrate antigen 19-9.
P value from Fisher’s exact (2-sided) test.
OR was calculated from logistic regression adjusted sex, race, clinical stage, tumor resection, CA 19-9, biochemical index and performance status when appropriate.
DISCUSSION
In this study, we found significant associations between IGF-axis gene variants and clinical outcome of patients with pancreatic cancer. IGF1 *8470T>C, IGF1R IVS2+46329T>C, IGFBP3 A32G, IRS1 G972R in patients with localized disease; IGF1R IVS20-3431A>G, IGF1R T766T, IGFBP3 -202A>C, IRS1 IVS1+4315C>G, IRS1 G972R in patients with advanced disease; and IGF1R T766T, IGF2R L252V, IGFBP3 -202A>C, IRS1 IVS1+4315C>G, IRS1 G972R, IRS2 IVS1+5687T>C in all patients were significantly associated with OS (P ≤ 0.007). A strong association between having two or more of the predictive genotypes and having poorer OS was observed among all patients. Significant associations between genotypes and response to preoperative chemoradiotherapy, tumor stage, and tumor resectability were detected as well. For the first time to our knowledge, we have demonstrated a potential role of gene variations along the IGF-axis in determining the clinical outcome of patients with pancreatic cancer.
Among the 41 SNPs, the IGF1 *8470T>C TT and IGFBP3 A32G CC genotypes were predictors for worse or better OS, respectively in patients with localized tumors only. A recent study has shown that these two gene variants were significantly associated with circulating level of their coded proteins18. IGFBP3 prolongs the half-life of IGFs by binding with the circulating IGFs and altering their interactions with cell surface receptors. As a regulator of cell survival, IGFBP-3 is involved in cytokine-mediated apoptosis in insulin-secreting cells 19. Because IGFBP3 plays an important role in regulating the bioavailability of IGF120, these observations suggest that the IGF1 level or the ratio of IGF1/IGFBP3 may play a more critical role in tumor progression in the early stages of pancreatic cancer. This would be a beneficial area for further research.
In patients with advanced diseases and in all patients, the IGFBP3 promoter region SNP -202A>C, which is in LD with the A32G SNP, was significantly associated reduced OS. None of the IGFBP1 and IGFBP5 SNPs in this study showed significant association with OS, even though both genes have been suggested to play a role in pancreatic cancer 21–23.
The IGF1R T766T, IRS1 G972R and IRS2 IVS1+5687T>C genotype showed consistent associations with OS in patients with localized disease and in patients with advanced disease. These genotypes were also significantly associated with tumor response to therapy or tumor stage and resectability. The IGF1R T766T is a synonymous SNP without changing amino acid. Although functional analysis by bioinformatics’ predicted that the variant allele may lead to alternative mRNA splicing and abnormal protein functions16, no direct evidence is available at present. The IRS1 G972R genotype and 972R-containing haplotype were predictive for reduced OS in all patients. The functional effect of the IRS1 972R variant has been investigated previously. Cells with the 972R variant allele have reduced insulin secretion24, 25 and insulin sensitivity26, impaired glucose transport and glycogen synthesis27, increased insulin resistance26, and impaired β-cell survival24, 28. IRS1 972R can phosphorylate and upregulate AKT in a PI3K-independent manner, possibly through stress and hypoxia, to activate downstream mTOR pathways to promote cell proliferation and survival29. These factors may help explain the association between IRS1 972R variant and reduced OS in pancreatic cancer. Our data suggest the IRS1 G972R genotype may be a useful marker to help patient selection for the IGF1R-targeted therapy. Activated IGF1R phosphorylates the IRSs to interact with PI3K/AKT and RAS/MAPK/ERK signaling transducers, send mitogenic, anti-apoptotic, and dedifferentiation signals7–10. Activation of the signaling pathways plays an important role in promoting pancreatic cancer development and progression30–33. IRS2 IVS1+5687C allele was predictive for worse OS in all patients. This intronic SNP is in linkage disequilibrium with IRS2 G1057D, a nonsynonymous SNP that was predicted to affect splicing, transcriptional regulation, and post-translational modification (16); and IRS2 Ex2+750A>G, a 3′UTR SNP. Even though the latter two SNPs were not individually significantly associated with OS, IRS2 AGCGCC haplotype containing the IRS2 Ex2+750A, G1057, IVS1+5687C allele showed strong associations with reduced OS.
IGF2R is a receptor for both IGF2 and mannose 6-phosphate (M6P), which is a tumor suppressor. It reduces IGF2 bioactivity by sequestering it away from IGF1R6. Loss of IGF2R is associated with tumor progression through impaired trafficking of lysosomal enzymes, reduced availability of TGF-β, inhibited apoptosis, and activated proteolytic processes34. We observed that the homozygous mutant of IGF2R L252V was significantly associated with OS in all patients. The variant allele of this nonsynonymous SNP was predicted to be deleterious to the protein-coding 3D conformation (through causing the loss of hydrophobic effect and creation of a cavity) and/or regulate gene splicing16. However, there were only 14 patients with the homozygous mutant genotype in this study; this association needs to be confirmed in a larger study.
We did not observe any association between SNPs in the IGF2 gene and clinical outcomes in pancreatic cancer. The lack of such an association could be due to the limited number of SNPs examined or the relatively less-important role of IGF2 in tumor progression.
Because of the large number of SNPs examined in this study, we considered a P ≤ 0.007 as significant to keep the FDR < 10%. Many of the SNPs had P <0.05 but >0.007, however, when we calculated the number of unfavorable-genotypes, we observed dramatic combined-genotype association with OS, suggesting that genes involved in the IGF-axis function synergistically and that the combined effect of several genes may have a greater influence on the phenotype, e.g., OS, than do individual genes.
The strengths of this study include a large sample size, detailed clinical information, and hypothesis-driven selection of genes. The limitations of this study included the limited number of genes and SNPs examined and the potential false-positive findings related to multiple comparisons. Nevertheless, the study findings provide supporting evidence for the importance of genes from the IGF-axis in pancreatic cancer. Because of the difficulties in obtaining the target tissues for gene expression profiling in most patients with pancreatic cancer, the genetic markers described in this study, which was determined in a DNA sample collected non-invasively, along with well characterized phenotypic significance has great clinical implications. For example, these genotypes might be useful in selecting patients for the IGF1R-targeted therapy, i.e. those carrying the variant alleles that are associated with reduced survival or poor response to therapy might benefit more from such treatment. Whether these genetic markers are predictive to response to IGF1R inhibitors are under current investigations.
Supplementary Material
Acknowledgments
Supported by National Institutes of Health (NIH) RO1 grant CA098380 (DL.), SPORE P20 grant CA101936 (JLA), NIH Cancer Center Core grant CA16672, and a research grant from the Lockton Research Funds (DL).
Footnotes
Disclosure: No conflict of interest exists for all the authors of this manuscript.
Xiaoqun Dong contributed to the study concept and design, acquisition of data, analysis and interpretation of data, and drafting of the manuscript.
Milind Javle and Rachan Shroff contributed to data acquisition and interpretation of data.
Kenneth R. Hess contributed to statistical analysis.
James L. Abbruzzese contributed to critical revision of the manuscript for important intellectual content, obtained funding.
Donghui Li contributed to the study concept and design, analysis and interpretation of data, study supervision, drafting of the manuscript, and obtained funding.
Publisher's Disclaimer: This is a PDF file of an unedited manuscript that has been accepted for publication. As a service to our customers we are providing this early version of the manuscript. The manuscript will undergo copyediting, typesetting, and review of the resulting proof before it is published in its final citable form. Please note that during the production process errors may be discovered which could affect the content, and all legal disclaimers that apply to the journal pertain.
References
- 1.Jemal A, Siegel R, Ward E, et al. Cancer statistics. CA Cancer J Clin. 2009;59:225–49. doi: 10.3322/caac.20006. [DOI] [PubMed] [Google Scholar]
- 2.Morgan MA, Parsels LA, Maybaum J, et al. Improving gemcitabine-mediated radiosensitization using molecularly targeted therapy: a review. Clin Cancer Res. 2008;14:6744–50. doi: 10.1158/1078-0432.CCR-08-1032. [DOI] [PMC free article] [PubMed] [Google Scholar]
- 3.Withers DJ, Burks DJ, Towery HH, et al. Irs-2 coordinates Igf-1 receptor-mediated beta-cell development and peripheral insulin signalling. Nat Genet. 1999;23:32–40. doi: 10.1038/12631. [DOI] [PubMed] [Google Scholar]
- 4.Dong X, Park S, Lin X, et al. Irs1 and Irs2 signaling is essential for hepatic glucose homeostasis and systemic growth. J Clin Invest. 2006;116:101–14. doi: 10.1172/JCI25735. [DOI] [PMC free article] [PubMed] [Google Scholar]
- 5.Samani AA, Yakar S, LeRoith D, et al. The role of the IGF system in cancer growth and metastasis: overview and recent insights. Endocr Rev. 2007;28:20–47. doi: 10.1210/er.2006-0001. [DOI] [PubMed] [Google Scholar]
- 6.Pollak M. Insulin and insulin-like growth factor signalling in neoplasia. Nat Rev Cancer. 2008;8:915–28. doi: 10.1038/nrc2536. [DOI] [PubMed] [Google Scholar]
- 7.Buck E, Eyzaguirre A, Rosenfeld-Franklin M, et al. Feedback mechanisms promote cooperativity for small molecule inhibitors of epidermal and insulin-like growth factor receptors. Cancer Res. 2008;68:8322–32. doi: 10.1158/0008-5472.CAN-07-6720. [DOI] [PubMed] [Google Scholar]
- 8.Guix M, Faber AC, Wang SE, et al. Acquired resistance to EGFR tyrosine kinase inhibitors in cancer cells is mediated by loss of IGF-binding proteins. J Clin Invest. 2008;118:2609–19. doi: 10.1172/JCI34588. [DOI] [PMC free article] [PubMed] [Google Scholar]
- 9.Cui X, Kim HJ, Kuiatse I, et al. Epidermal growth factor induces insulin receptor substrate-2 in breast cancer cells via c-Jun NH(2)-terminal kinase/activator protein-1 signaling to regulate cell migration. Cancer Res. 2006;66:5304–13. doi: 10.1158/0008-5472.CAN-05-2858. [DOI] [PubMed] [Google Scholar]
- 10.Bauer TW, Somcio RJ, Fan F, et al. Regulatory role of c-Met in insulin-like growth factor-I receptor-mediated migration and invasion of human pancreatic carcinoma cells. Mol Cancer Ther. 2006;5:1676–82. doi: 10.1158/1535-7163.MCT-05-0175. [DOI] [PubMed] [Google Scholar]
- 11.Skolnik EY, Batzer A, Li N, et al. The function of GRB2 in linking the insulin receptor to Ras signaling pathways. Science. 1993;260:1953–5. doi: 10.1126/science.8316835. [DOI] [PubMed] [Google Scholar]
- 12.Bertrand FE, Steelman LS, Chappell WH, et al. Synergy between an IGF-1R antibody and Raf/MEK/ERK and PI3K/Akt/mTOR pathway inhibitors in suppressing IGF-1R-mediated growth in hematopoietic cells. Leukemia. 2006;20:1254–60. doi: 10.1038/sj.leu.2404217. [DOI] [PubMed] [Google Scholar]
- 13.Knowlden JM, Jones HE, Barrow D, et al. Insulin receptor substrate-1 involvement in epidermal growth factor receptor and insulin-like growth factor receptor signalling: implication for Gefitinib (‘Iressa’) response and resistance. Breast Cancer Res Treat. 2008;111:79–91. doi: 10.1007/s10549-007-9763-9. [DOI] [PubMed] [Google Scholar]
- 14.Mitsiades CS, Mitsiades NS, McMullan CJ, et al. Inhibition of the insulin-like growth factor receptor-1 tyrosine kinase activity as a therapeutic strategy for multiple myeloma, other hematologic malignancies, and solid tumors. Cancer Cell. 2004;5:221–30. doi: 10.1016/s1535-6108(04)00050-9. [DOI] [PubMed] [Google Scholar]
- 15.Dong X, Jiao L, Li Y, et al. Significant associations of mismatch repair gene polymorphisms with clinical outcome of pancreatic cancer. J Clin Oncol. 2009;27:1592–9. doi: 10.1200/JCO.2008.20.1111. [DOI] [PMC free article] [PubMed] [Google Scholar]
- 16.Lee PH, Shatkay H. F-SNP: computationally predicted functional SNPs for disease association studies. Nucleic Acids Res. 2008;36:D820–4. doi: 10.1093/nar/gkm904. [DOI] [PMC free article] [PubMed] [Google Scholar]
- 17.Pounds S, Morris SW. Estimating the occurrence of false positives and false negatives in microarray studies by approximating and partitioning the empirical distribution of p-values. Bioinformatics. 2003;19:1236–42. doi: 10.1093/bioinformatics/btg148. [DOI] [PubMed] [Google Scholar]
- 18.Patel AV, Cheng I, Canzian F, et al. IGF-1, IGFBP-1, and IGFBP-3 polymorphisms predict circulating IGF levels but not breast cancer risk: findings from the Breast and Prostate Cancer Cohort Consortium (BPC3) PLoS One. 2008;3:e2578. doi: 10.1371/journal.pone.0002578. [DOI] [PMC free article] [PubMed] [Google Scholar]
- 19.Shim ML, Levitt Katz LE, Davis J, et al. Insulin-like growth factor binding protein-3 is a novel mediator of apoptosis in insulin-secreting cells. Growth Horm IGF Res. 2004;14:216–25. doi: 10.1016/j.ghir.2003.12.009. [DOI] [PMC free article] [PubMed] [Google Scholar]
- 20.Chen W, Wang S, Tian T, et al. Phenotypes and genotypes of insulin-like growth factor 1, IGF-binding protein-3 and cancer risk: evidence from 96 studies. Eur J Hum Genet. 2009;17:1668–75. doi: 10.1038/ejhg.2009.86. [DOI] [PMC free article] [PubMed] [Google Scholar]
- 21.Wolpin BM, Michaud DS, Giovannucci EL, et al. Circulating insulin-like growth factor binding protein-1 and the risk of pancreatic cancer. Cancer Res. 2007;67:7923–8. doi: 10.1158/0008-5472.CAN-07-0373. [DOI] [PubMed] [Google Scholar]
- 22.Johnson SK, Dennis RA, Barone GW, et al. Differential expression of insulin-like growth factor binding protein-5 in pancreatic adenocarcinomas: identification using DNA microarray. Mol Carcinog. 2006;45:814–27. doi: 10.1002/mc.20203. [DOI] [PubMed] [Google Scholar]
- 23.Johnson SK, Haun RS. Insulin-like growth factor binding protein-5 influences pancreatic cancer cell growth. World J Gastroenterol. 2009;15:3355–66. doi: 10.3748/wjg.15.3355. [DOI] [PMC free article] [PubMed] [Google Scholar]
- 24.Hribal ML, Tornei F, Pujol A, et al. Transgenic mice overexpressing human G972R IRS-1 show impaired insulin action and insulin secretion. J Cell Mol Med. 2008;12:2096–106. doi: 10.1111/j.1582-4934.2008.00246.x. [DOI] [PMC free article] [PubMed] [Google Scholar]
- 25.Porzio O, Federici M, Hribal ML, et al. The Gly972-->Arg amino acid polymorphism in IRS-1 impairs insulin secretion in pancreatic beta cells. J Clin Invest. 1999;104:357–64. doi: 10.1172/JCI5870. [DOI] [PMC free article] [PubMed] [Google Scholar]
- 26.Clausen JO, Hansen T, Bjorbaek C, et al. Insulin resistance: interactions between obesity and a common variant of insulin receptor substrate-1. Lancet. 1995;346:397–402. doi: 10.1016/s0140-6736(95)92779-4. [DOI] [PubMed] [Google Scholar]
- 27.Hribal ML, Federici M, Porzio O, et al. The Gly-->Arg972 amino acid polymorphism in insulin receptor substrate-1 affects glucose metabolism in skeletal muscle cells. J Clin Endocrinol Metab. 2000;85:2004–13. doi: 10.1210/jcem.85.5.6608. [DOI] [PubMed] [Google Scholar]
- 28.McGettrick AJ, Feener EP, Kahn CR. Human insulin receptor substrate-1 (IRS-1) polymorphism G972R causes IRS-1 to associate with the insulin receptor and inhibit receptor autophosphorylation. J Biol Chem. 2005;280:6441–6. doi: 10.1074/jbc.M412300200. [DOI] [PubMed] [Google Scholar]
- 29.Sentinelli F, Filippi E, Cavallo MG, et al. The G972R variant of the insulin receptor substrate-1 gene impairs insulin signaling and cell differentiation in 3T3L1 adipocytes; treatment with a PPARgamma agonist restores normal cell signaling and differentiation. J Endocrinol. 2006;188:271–85. doi: 10.1677/joe.1.06290. [DOI] [PubMed] [Google Scholar]
- 30.Bergmann U, Funatomi H, Kornmann M, et al. Increased expression of insulin receptor substrate-1 in human pancreatic cancer. Biochem Biophys Res Commun. 1996;220:886–90. doi: 10.1006/bbrc.1996.0500. [DOI] [PubMed] [Google Scholar]
- 31.Asano T, Yao Y, Shin S, et al. Insulin receptor substrate is a mediator of phosphoinositide 3-kinase activation in quiescent pancreatic cancer cells. Cancer Res. 2005;65:9164–8. doi: 10.1158/0008-5472.CAN-05-0779. [DOI] [PubMed] [Google Scholar]
- 32.Kwon J, Stephan S, Mukhopadhyay A, et al. Insulin receptor substrate-2 mediated insulin-like growth factor-I receptor overexpression in pancreatic adenocarcinoma through protein kinase Cdelta. Cancer Res. 2009;69:1350–7. doi: 10.1158/0008-5472.CAN-08-1328. [DOI] [PMC free article] [PubMed] [Google Scholar]
- 33.Neid M, Datta K, Stephan S, et al. Role of insulin receptor substrates and protein kinase C-zeta in vascular permeability factor/vascular endothelial growth factor expression in pancreatic cancer cells. J Biol Chem. 2004;279:3941–8. doi: 10.1074/jbc.M303975200. [DOI] [PubMed] [Google Scholar]
- 34.Schiller HB, Szekeres A, Binder BR, et al. Mannose 6-phosphate/insulin-like growth factor 2 receptor limits cell invasion by controlling alphaVbeta3 integrin expression and proteolytic processing of urokinase-type plasminogen activator receptor. Mol Biol Cell. 2009;20:745–56. doi: 10.1091/mbc.E08-06-0569. [DOI] [PMC free article] [PubMed] [Google Scholar]
Associated Data
This section collects any data citations, data availability statements, or supplementary materials included in this article.