

Abstract
Assembly of dsRNA bacteriophage ϕ6 involves packaging of the three mRNA strands of the segmented genome into the procapsid, an icosahedrally symmetric particle with recessed vertices. The hexameric packaging NTPase (P4) overlies these vertices, and the monomeric RNA-dependent RNA polymerase (RdRP, P2) binds at sites inside the shell. P2 and P4 are present in substoichiometric amounts, raising the questions of whether they are recruited to the nascent procapsid in defined amounts and at specific locations, and whether they may co-localize to form RNA-processing assembly lines at one or more “special” vertices. We have used cryo-electron tomography to map both molecules on individual procapsids. The results show variable complements that accord with binomial distributions with means of 8 (P2) and 5 (P4), suggesting that they are randomly incorporated in copy numbers that simply reflect availability, i.e. their rates of synthesis. Analysis of the occupancy of potential binding sites (20 for P2; 12 for P4) shows no tendency to cluster nor for P2 and P4 to co-localize, suggesting that the binding sites for both proteins are occupied in random fashion. These observations indicate that although P2 and P4 act sequentially on the same substrates there is no direct physical coupling between their activities.
Keywords: Electron cryo-tomography, RNA-dependent RNA polymerase, Packaging motor, Procapsid, Cystovirus
1. Introduction
Virus assembly proceeds through a series of well-coordinated steps to produce viable virions. In the case of cystovirus ϕ6, a bacteriophage infecting Pseudomonas syringae, a procapsid is first assembled and then packaged sequentially with three segments of ssRNA. The procapsid has an icosahedral shell composed of 120 copies of the P1 protein, and lesser amounts of proteins P2, P4 and P7. P4 is an NTPase responsible for packaging the RNA segments (Pirttimaa et al., 2002); organized as hexamers, it is bound to the outer surface of the procapsid at its recessed five-fold vertices (de Haas et al., 1999). P2 is the RNA-dependent RNA polymerase required for the synthesis of the minus strand, as well as plus-strand transcripts (Mindich, 1999). P2 resides on the inner surface of the procapsid shell at sites close to the icosahedral three-fold axes (Sen et al., 2008). The location and function of P7 have still to be defined in ϕ6, although a possible location has been suggested based on a single particle reconstruction of the related ϕ12 virion (Wei et al., 2009).
The packaging of an RNA strand by P4 is thought to occur through a pore at a five-fold vertex, and at some point the RNA engages P2 for minus-strand synthesis (Qiao et al., 1997). A special vertex for this process was proposed by Pirttimaa et al. (2002), based on a P4 mutant that assembled only about one P4 hexamer per procapsid without adverse effect on packaging and minus strand synthesis. The coordination of multiple activities at the same vertex is practiced by other dsRNA viruses, such as rotavirus and reovirus, where translocation of the multi-segment genomic RNA and second-strand synthesis take place in well-orchestrated fashion within the 120-subunit inner shell (Patton and Spencer, 2000). Significantly, in these viruses, the number of RNA segments per genome, while usually greater than the three of ϕ6, never exceeds 12, the number of five-fold vertices (Patton and Spencer, 2000). If such a special vertex (or vertices) exists for ϕ6, some mechanism should exist to ensure co-localization of P2 and P4.
Two sets of procapsid-associated densities visualized in cryo-EM reconstructions have been attributed to P4 (de Haas et al., 1999) and P2 (Sen et al., 2008). These densities are lower than that in the P1 shell, indicating that both proteins are substoichiometric, consistent with evidence from quantitative SDS-PAGE (Sen et al., 2008). However, both kinds of data result from global averaging over large populations of procapsids and do not reveal whether P2 and P4 are present in fixed or variable numbers, nor whether they associate with particular subsets of binding sites. This information is potentially accessible from electron cryo-tomography, which yields three-dimensional density maps of individual particles, uncompromised by averaging or symmetrization. Here we report such a study, in which we developed an algorithm that makes it possible to determine on a quantitative objective basis which sites are occupied, and thus to count individual P2 and P4 molecules and map their locations.
2. Materials and Methods
2.1 Preparation of ϕ6 procapsids
Procapsids were produced in Escherichia coli strain LM756, using the high copy plasmid pLM687 to co-express P1, P2, P4 and P7 in copy numbers similar to that of intact virions in its natural host (Day and Mindich, 1980). The resulting particles were purified as described (Sen et al., 2008). Briefly, cells were lyzed with a French press and the procapsids purified by zone and equilibrium centrifugations in 10-30% and 25-50% linear sucrose gradients, then stored until use at a protein concentration of ~15 mg/mL in buffer A (10 mM potassium phosphate, 1 mM MgCl2, pH 7.5) and 50% sucrose (w/v) at 4 °C. Prior to EM specimen preparation, sucrose was removed by using Zeba micro desalt spin columns (7 kDa cutoff; Thermo Scientific, Rockford, IL) equilibrated with buffer A.
2.2 Electron tomography and image processing
Procapsid samples were mixed with 10-nm colloidal gold particles (AURION, Wageningen, The Netherlands) and vitrified as described (Harris et al., 2006). A Tecnai-12 electron microscope (FEI, Hillsboro, OR) operating at 120 kV with a LaB6 source and equipped with an energy filter (GIF 2002; Gatan, Pleasanton, CA) was used to collect tilt series at ~ 4-[m defocus, covering the range ±70° in 1° increments. The data were acquired using the SerialEM package (Mastronarde, 2005), for a total dose of ~75 electrons/Å2 per series. Images were recorded on a 2048×2048-pixel CCD camera (Gatan, Pleasanton, CA) at 38500× magnification (7.8 Å/pixel). Data were processed using the Bsoft package (Heymann et al., 2008). Projections were aligned using gold particles as fiducial markers and tomograms were reconstructed. The tomograms were denoised by 100 iterations of anisotropic non-linear diffusion (Frangakis & Hegerl, 2001). Individual procapsids were extracted from tomograms in bshow and aligned to a single particle reconstruction from a previous study (Sen et al., 2008) and using an appropriate missing wedge mask. The in-plane resolution of the full tomograms was estimated as ~ 65 Å by the NLOO-2D method (Cardone et al., 2005) with 0.5 cutoff, whereas by the same criterion, the resolution of individual procapsids was ~ 50 Å (see Results).
2.3 Determination of locations occupied by P2 and P4
Extracted procapsids were normalized to the same average and standard deviation before analyzing densities at the nominal locations of P2 (inside the procapsid at a radius of 104 Å on the 3-fold axes) and P4 (overlying the vertices at a radius of 219 Å on the 5-fold axes). The actual locations were refined by cross-correlation in a box centered on the nominal location (8×8×8 voxels for P2 and 12×12×12 voxels for P4) with a spherical template, 31 Å in diameter for P2 and 47 Å for P4. While the cross-correlation box size limited shifts from the nominal location, the following further constraints were also imposed: (i) the best location by cross-correlation still overlapped with its nominal location (i.e., the distance between the expected and refined locations was less than the sphere diameter) and (ii) did not overlap with an adjacent location. Additionally, partial shifts into the edge of the P1 shell that occurred in cases where the cross-correlation volume did not contain any P2 and P4 density (unoccupied sites) were rejected.
2.4 Determination of occupancy of P2 and P4 locations
To assess density present at these locations, a threshold was calculated for each particle that included 100% of the expected mass of the procapsid (~12.6 MDa), using a standard protein density of 0.74 Da/Å3. A location was designated as occupied or unoccupied based on the percentage of voxels within the spherical probe whose densities exceeded that threshold. Cutoff values from 30% to 70% were found to give robust criteria for occupancy; accordingly, the mid-range value of 50% was adopted.
2.5 Fits of models to occupancy distributions
If the binding of P2 and P4 are random, their distributions should be binomial in nature. For n locations in the procapsid (n = 20 for P2 and n = 12 for P4) and a probability p that a location is occupied, the probability Pk that k locations are occupied is given by:
| (1) |
In the case of more than one population of procapsids (i.e., each population with a different p), the resultant model is a sum of M binomial distributions with relative weights wi:
| (2) |
Binomial distributions were fitted to the distributions of P2 and P4 occupancy by a least-square algorithm using the downhill simplex method (Press et al., 2002b). Standard deviations of the fitted parameters were determined from Monte Carlo simulations of many (50) synthetic datasets (Press et al., 2002a). The significance of fitted binomial distributions was determined using the G-test for goodness-of-fit (Sokal and Rohlf, 1994), while classes (k) with low frequencies (<10 counts) were pooled together.
2.6. Implementation of the occupancy analysis
The localization of single molecules and the analysis of the occupancy distribution was implemented in the program, dcount, available as part of Bsoft 1.6 (http://bsoft.ws).
3. Results and Discussion
We imaged bacteriophage ϕ6 procapsids produced in E. coli, previously shown to be infectious when incubated with the P8 protein (Olkkonen et al., 1990). The high copy plasmid used here yields amounts of P2 (7-10, Sen et al., 2008) and P4 (60-72, data not shown) approaching that reported for intact virions (Day and Mindich, 1980). From these indications our procapsids represent viable assemblies reflecting the properties of those produced in its natural host.
3.1 Tomograms of individual ϕ6 procapsids
The cryo-electron tomograms depict fields of well-separated procapsids in various orientations, although there is some preference for near-five-fold views (Supplementary Figure S1). A representative 1 nm-thick slice is shown in Figure 1A. It reveals that some procapsids (~ 20%) have visible gaps in their surface lattices (black arrows), indicative of missing P1 molecules. Such lesions are not readily apparent in untilted micrographs of procapsids (data not shown), but they are easily recognized in the tomograms. These particles - which presumably represent incomplete particles or ones that were damaged during isolation - were excluded from further analysis. The magnified views in Figure 1B reveal high densities at some internal locations (white arrows) and at the external locations occupied by P4 (black arrows).
Figure 1.
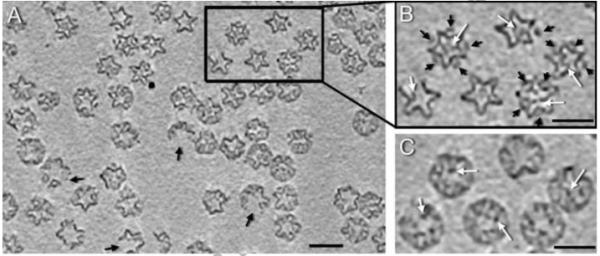
(A) Section through a cryo-tomogram of ϕ6 procapsids. About 20% of procapsids are incomplete, with their shells interrupted at icosahedral 2-fold axes (black arrows). Scale bar = 400 Å. (B) The tomograms reveal strong densities at internal sites associated with P2 (white arrows) and external sites associated with P4 (black arrows). (C) A section shifted by 80 Å through the same particles as in (B), showing internal densities taken to be P2 molecules (white arrows). Bars: 500 Å.
A set of 560 procapsids were extracted from three tomograms and rotated into a standard orientation in which each particle is viewed along an axis of 2-fold icosahedral symmetry by correlating them against a single particle reconstruction (Sen et al., 2008). The 315 procapsids with the highest correlation coefficients, which we take to represent the best-preserved particles, were analyzed further. The in-plane resolution of individual particle maps was ~ 50 Å by the NLOO-2D method (Cardone et al., 2005). After averaging the aligned procapsids and icosahedral symmetrization, a density map was obtained that closely resembled the single particle reconstruction (Figure 2). Its resolution was estimated to be ~ 37 Å, according to the FSC criterion (see Methods). In the averaged tomogram, the densities at the P4 and P2 locations are lower than in the P1 shell, confirming that these molecules are present in substoichiometric amounts (de Haas et al., 1999; Sen et al., 2008).
Figure 2.

(A) Central sections through icosahedrally symmetrized ϕ6 procapsids obtained by single particle analysis (Sen et al., 2008; left) and from averaged tomograms (right). White arrows: P2; black arrows: P4; white arrowhead: central diffuse density. (B) Isosurface representations of the procapsids in (A) segmented into the different protein components, showing the P1 shell in grey and the P4 hexamers in red. (C) Same as (B) but cut through the center to show the P2 monomers in yellow. (The thresholds for the P2 and P4 densities were adjusted to approximately match the P1 shell). The single particle reconstruction was normalized to have the same reciprocal space amplitude profile as the tomographic average map, and band-limited to the same resolution (37 Å). Bar: 100 Å.
3.2 P4 and P2 bind close to but not on the 5-fold and 3-fold symmetry axes
There is a symmetry mismatch implicit in the binding of P4 hexamers over the 5-fold axes at procapsid vertices (Juuti et al., 1998; de Haas et al., 1999). In icosahedrally symmetric reconstructions, discoid P4-related densities appear to hover over the vertices of the P1 shell (Butcher et al., 1997; Huiskonen et al., 2006). Our tomograms show that each P4 hexamer does, in fact, make contact with the procapsid at one of five symmetry-related points at the vertex where it is bound (Supplementary Figure S2). Once one of these connections is established, the other five subunits of the hexamer cannot make the same contact with the P1 shell. As the subunit that makes this contact varies randomly from vertex to vertex, the contacting density is diluted to the point of invisibility by 5-fold averaging, as in icosahedrally symmetrized single particle reconstructions (Fig. 2A). The tomograms, on the other hand, show the mode of binding individual P4 hexamers at the vertex sites, and reveal that the 6-fold axis of the P4 hexamer generally does not coincide with the 5-fold axis of the procapsid vertex (see below). This agrees with the findings of Huiskonen et al. (2007) that the P4 hexamers of the related ϕ8 bacteriophage are displaced from the 5-fold axis in the RNA-packaged procapsid.
Previous icosahedral reconstructions show P2-associated densities inside the procapsid on the 3-fold axes, nestled between the recessed 5-fold vertices (Sen et al., 2008). Most of the internal densities seen in our tomograms are quite close to these “nominal” locations and we interpret them as P2 monomers. We therefore define a density occurring at or close to this site as a P2 molecule (Figure 3A). There is some variability in the apparent locations of these densities, but this may simply be a reflection of the low resolution and other distortions in the tomograms. Alternatively, the P2 molecules may not all be tightly bound to the P1 shell. Other interior densities (~20%) are not in visible contact with the P1 shell at all and do not even overlap with the assigned P2 sites. These are either P2 monomers that became detached from their initial binding sites but remained trapped inside the procapsid shell, or other proteins, presumably of cellular origin. SDS-PAGE (not shown) showed that the major components of these procapsids are P1, P2, P4 and P7 but did not rule out the possibility that they also contain small amounts of other proteins. Such diffuse densities have also been seen in single particle reconstructions of the procapsid map (Sen et al., 2008) as well as the icosahedrally averaged tomographic map (Figure 2A, arrowhead).
Figure 3.

(A) Central sections through cryo-tomograms of four ϕ6 procapsids aligned to standard icosahedral orientation. The first row shows the nominal locations of P2 (yellow circles) and P4 (red circles) molecules, and the second row refined positions for P2 (green circles) and P4 (blue circles). Smaller diameters of some circles in the second row indicate refinements in the z-direction. Only one contact between each P4 hexamer and the P1 shell is observed (black arrowheads). Some internal densities (white arrowheads) are not close to any P2 site and contribute to the density in the center of the averaged and symmetrized density map (Figure 2A). The sections show variations in density in both the contiguous P1 shell and in the associated densities on account of missing wedge effects and low signal-to-noise ratio. (B) Histogram of the displacement of P2 molecules from their nominal sites. (C) Histogram of the displacement of P4 hexamers from their nominal sites. (D) The nominal site for P2 (yellow sphere) encased in a mesh generated by 25 Å shifts to indicate the extent of variability in the location of P2. (E) The central P4 with a mesh generated by 25 Å shifts of P4 to indicate the extent of variability in the location of P4. Bar: 100Å.
3.3 Counting P2 and P4 molecules
In principle, the binding sites for P2 and P4 that are occupied in a given procapsid may be determined from the tomograms. However, as the tomograms are inevitably noisy, a quantitative objective method is needed to determine which sites are occupied. Our analysis proceeded as follows. First we refined the locations of putative P2- or P4-associated densities rather than accepting their “nominal” sites on the 3-fold (P2) or 5-fold (P4) symmetry axes. We found the most likely representative density for P2 or P4 near each nominal location in each procapsid by cross-correlation with a sphere of uniform density and refined the resulting offsets so that each refined location: (i) still overlapped with its nominal location; (ii) did not overlap with the P1 shell; and (iii) did not overlap with an adjacent refined location for a P2 or P4 molecule (see Methods). Figure 3A illustrates a few P2 and P4 locations pre- and post-refinement. The peak in offsets for both P2 and P4 densities are at ~25 Å (Figures 3B,C). Those attributed to P4 are somewhat larger than those reported for RNA-packaged ϕ8 procapsids (~8 Å) (Huiskonen et al., 2007).
Ideally, the density values inside spheres centered on the refined P2 and P4 locations should distinguish clearly between occupied and unoccupied sites. Average densities were measured at each of the 20 potential P2 locations (Figure 4A) and 12 potential P4 locations (Figure 4B) on each of the 315 procapsids. Both sets of measurements observe bimodal distributions, consistent with there being two kinds of sites (occupied/unoccupied). However, there is considerable spread in the data and a priori it is not clear how to set the threshold to separate the two sets, particularly for P2 for which the two distributions overlap significantly.
Figure 4.

(A) Histogram of average intensities in the refined P2 locations obtained from the 315 selected procapsids, indicating two populations: occupied (left curve, ~55%) and empty (right curve, ~45%). (b) Histogram of average intensities in the refined P4 locations also indicates two populations: occupied (left curve, ~28%) and empty (right curve, ~72%). (c) Histogram of intensity within the P1 shell of an individual procapsid (light grey), and the background (dark grey), overlaid with the averaged intensities of the 20 refined locations for P2 (black bars).
Facing this ambiguity, we used the following two-step method to assess occupancy: (i) we determined the threshold such that when the whole procapsid is contoured at that density, its volume corresponds to the expected procapsid mass (12.6 MDa); (ii) at each location, we calculated the percentage of voxels in the spherical probe that exceeds this threshold. The site was then classified as occupied or empty based on a given percentage cutoff. We calibrated this approach with the following experiment. Into the map obtained from 315 aligned procapsids, 30 Å spheres of uniform density corresponding to the average density in the P1 shell were inserted at three P2 locations (Figure 5A). A missing wedge was applied to simulate the imaging conditions of the tomograms. Occupancies at all 20 P2 locations were then determined for percentage cutoffs from 1% to 100%. The three locations with inserted density were correctly identified for a broad range of cutoffs between these extremes (Figure 5B). Accordingly, we set the percentage cutoff to 50% to determine occupancy of individual P2 and P4 locations. Because the mean occupancy of P2 and P4 locations in the selected 315 procapsids was still slightly dependent on the selected cutoff (Supplementary Figure S3), we estimated the occupancy at multiple cutoffs in the range of 30–70%, and calculated the average and standard deviation shown in Figures 6.
Figure 5.
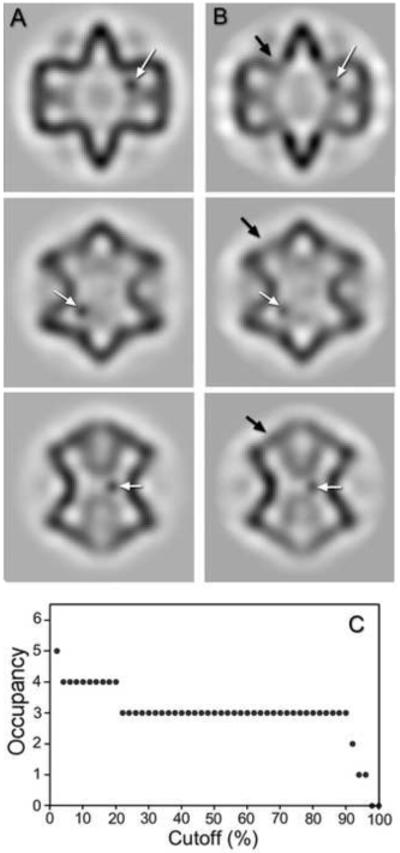
(A) A test case, showing three sections of an average procapsid with spherical densities (white arrows) inserted near the expected P2 locations. (B) The same sections after application of the missing wedge (right column) show smearing of density in the P1 shell (black arrow) and the inserted densities (white arrows). (C) Influence of the cutoff (percentage voxels above threshold) selected to enumerate the occupied P2 locations in the test case, showing a robust region of 22-90%, in which the three inserted densities were correctly identified.
Figure 6.

(A) Unimodal distribution of P2 occupancy, with a peak at 8 P2 subunits per procapsid. A binomial distribution for n = 20 locations was fitted to the P2 occupancy distribution (black line). (B) Distribution of P4 occupancies. The black line represents the sum of two binomial distributions with means of 1 and 5 for n = 12 locations. The error bars indicate one standard deviation and the fit is consistent with the data within the 5% confidence level (p-value = 0.22 for P2 and p-value = 0.39 for P4).
3.4 Distributions of P2 and P4 occupancies
The distribution of P2 occupancies is unimodal, peaking at ~ 8 P2 subunits per procapsid (Figure 6A). Every procapsid contained at least two P2 subunits, while none had more than 13 P2 subunits. The observed distribution is consistent with a binomial distribution with a probability p of 0.39 ± 0.01, corresponding to a mean of eight (~ 20 × 0.39) P2 subunits per procapsid. The same occupancy distribution was found for the procapsids from each of the three tomograms (Supplementary Figure S4A), indicating that it is a property of this preparation and is not biased by optical or computational vagaries of individual tomograms. Thus the average P2 occupancy determined here is in agreement with the value obtained previously by biochemical quantitation (Sen et al., 2008).
The distribution of P4 occupancy (Figure 6B) is broad, suggesting that it has more than one component. It can be fitted as the sum of two binomial distributions (see Methods). One (69%) corresponds to a population of procapsids with a mean of five P4 locations occupied, whereas the other (31%) corresponds to a population with a mean of only one P4 location occupied. Again, the same two populations were detected in procapsids extracted from each of the three tomograms (Supplementary Figure S4B). The most straightforward interpretation of these data is that the first population ([ = 5) represents procapsids as initially assembled, whereas the ([ = 1) population corresponds to the procapsids that shed some P4 subunits during isolation, storage, or vitrification.
Co-association of P2 and P4 molecules at opposing interior and exterior sites was examined by comparing distributions of P2 occupancy at the five P2 locations around each 5-fold vertex (Figure 7). We found no significant difference between occupancy of the P2 locations around empty and around P4-occupied vertices. Distributions for both types of vertices correspond to random occupancy of P2 locations in the procapsid (Figure 6A) that is given by a binomial distribution for 5 locations (n = 5) and the probability of P2 occupying a location (p = 0.39). The distributions are not distinguishable at the 5% confidence level from a random model.
Figure 7.

(A) A scheme of P2 (spheres inside) and P4 (spheres outside) locations in a cut-view through the averaged map of bacteriophage ϕ6 procapsid. The pentagonal rings indicate clusters of P2 molecules around five-fold vertices, each defined as close to the P4 hexamer bound at that vertex. (B) Distributions of occupancy of P2 locations around vertices that are either occupied (black bars) or unoccupied (grey bars) by P4 hexamers. Both distributions correspond to random occupancy of P2 subunits as given by a binomial distribution with a mean of 5 occupied sites (line).
3.5 Packaging of substoichiometric capsid components
It is not unusual for icosahedral capsids, whose major building blocks are present in multiples of 60, to also incorporate smaller numbers of functionally important proteins, and a variety of mechanisms are employed for their selection. For instance, the capsids of tailed phages and herpesviruses have a portal protein dodecamer at a single vertex that appears to initiate assembly of an icosahedral shell (Fu and Prevelige, 2009; Newcomb et al., 2005). Other substoichiometric components may bind at sites that have higher binding affinity than do quasi-equivalent alternatives, e.g. the UL17/UL25 heterodimer on DNA-filled herpesvirus capsids (Trus et al., 2007). In reoviruses, enzymatic activities are associated with vertices and it is hypothesized that each RNA segment associates with and is processed by its own vertex. In cystoviruses, which have only three RNA segments, the packaging activity of P4 and the replication activity of P2 could be coordinated at some level. Pirttimaa et al. (2002) have proposed that this may be accomplished by the co-association of both proteins at one or more special vertices.
However, our results do not support this hypothesis. The copy numbers on individual procapsids may be explained by simple binomial distributions, with means of 8 for P2 (of 20 occupiable sites) and 5 for P4 (of 12 occupiable sites). These observations suggest that procapsids’ complements of both proteins are controlled by simple availability, i.e. at the level of transcription and/or translation, as random samplings of the intracellular pools. In both cases, the mean exceeds the number (3) that would be required if there were to be one special vertex for each RNA segment. However, the distribution of P2 molecules around P4-occupied vertices is not consistent with such three vertices and a random distribution of remaining molecules (not shown). The means are high enough to make it highly unlikely for any procapsid to fail to acquire at least one P2 monomer and one P4 hexamer. Moreover, almost all procapsids (>99%) have at least one P4-occupied vertex with at least one occupied adjacent P2 location (Figure 8) solely due to random distributions of P2 and P4 in the procapsid (the probability of P2 and P4 not co-associating in a procapsid with at least one P4-occupied vertex is ~0.003).
Figure 8.

(A) Histogram of distances between the closest P2 - P4 pairs in procapsids, showing a single population centered at ~120 Å. The distance between the P4 location at the 5-fold axis and the closest P2 location at the 3-fold axis is ~150Å, whereas the distance to the second closest P2 location is ~220 Å. (B) Histogram of distances between P4 and the closest P2 for P4-occupied vertices. The histogram shows two populations of P4-occupied vertices that either have at least one of the five adjacent P2 locations occupied (90%) or that have no adjacent P2 location occupied (10%).
As far as functional coordination is concerned, the interior volume of the procapsid is quite limited, and Figures 7 and 8 indicate that only rarely (≤10% of cases) is there a lack of P2 molecules next to a five-fold vertex occupied by a P4 hexamer. This means there is ample opportunity for a RNA strand being packaged by P4 to interact with a nearby P2. Our results indicate that the assembly of P2 within the procapsid is simply a random placement of the molecule in its binding locations on the three-fold axis between the recessed five-fold vertices. In any case, P2 does not participate in the uptake of RNA as procapsids lacking P2 have been shown to be fully capable of genomic packaging (Juuti and Bamford 1995). Taken together with our observations, it follows that the existence of a special ϕ6 vertex where the functions of packaging and replication are coupled is highly unlikely.
Supplementary Material
Table 1.
Parameters of binomial distributions fitted to the distribution of P4 occupancy in φ6 procapsids. The fits were applied to distributions derived from procapsids in each tomogram separately (TM1, TM2, TM3) and from all procapsids together (ALL). The parameters represent the relative weights (w1, w2) and the probabilities of P4 occupying a location (p1, p2) according to eq. 2. The difference between the two populations is thought to arise from localized increases in the salt concentration due to solvent evaporation during blotting just before plunge-freezing
| Tomogram | w1 | w2 | p1 | p2 |
|---|---|---|---|---|
| TM1 | 0.65 | 0.35 | 0.13 | 0.41 |
| TM2 | 0.36 | 0.64 | 0.08 | 0.38 |
| TM3 | 0.04 | 0.96 | 0.03 | 0.41 |
|
| ||||
| ALL | 0.31 | 0.69 | 0.10 | 0.39 |
Acknowledgments
We thank Dr Dennis C. Winkler for assistance with electron cryo-tomography. This work was supported by the Intramural Research Program of NIAMS and by grant GM34352 to L.M. from the National Institutes of Health.
Footnotes
Publisher's Disclaimer: This is a PDF file of an unedited manuscript that has been accepted for publication. As a service to our customers we are providing this early version of the manuscript. The manuscript will undergo copyediting, typesetting, and review of the resulting proof before it is published in its final citable form. Please note that during the production process errors may be discovered which could affect the content, and all legal disclaimers that apply to the journal pertain.
References
- Butcher SJ, Dokland T, Ojala PM, Bamford DH, Fuller SD. Intermediates in the assembly pathway of the double-stranded RNA virus phi6. EMBO J. 1997;16:4477–87. doi: 10.1093/emboj/16.14.4477. [DOI] [PMC free article] [PubMed] [Google Scholar]
- Butcher SJ, Grimes JM, Makeyev EV, Bamford DH, Stuart DI. A mechanism for initiating RNA-dependent RNA polymerization. Nature. 2001;410:235–40. doi: 10.1038/35065653. [DOI] [PubMed] [Google Scholar]
- Cardone G, Grunewald K, Steven AC. A resolution criterion for electron tomography based on cross-validation. J Struct Biol. 2005;151:117–29. doi: 10.1016/j.jsb.2005.04.006. [DOI] [PubMed] [Google Scholar]
- Day LA, Mindich L. The molecular weight of bacteriophage phi 6 and its nucleocapsid. Virology. 1980;103:376–85. doi: 10.1016/0042-6822(80)90196-8. [DOI] [PubMed] [Google Scholar]
- de Haas F, Paatero AO, Mindich L, Bamford DH, Fuller SD. A symmetry mismatch at the site of RNA packaging in the polymerase complex of dsRNA bacteriophage phi6. J Mol Biol. 1999;294:357–72. doi: 10.1006/jmbi.1999.3260. [DOI] [PubMed] [Google Scholar]
- Frangakis AS, Hegerl R. Noise reduction in electron tomographic reconstructions using nonlinear anisotropic diffusion. J Struct Biol. 2001;135:239–50. doi: 10.1006/jsbi.2001.4406. [DOI] [PubMed] [Google Scholar]
- Fu CY, Prevelige PE., Jr. In vitro incorporation of the phage Phi29 connector complex. Virology. 2009;394:149–53. doi: 10.1016/j.virol.2009.08.016. [DOI] [PMC free article] [PubMed] [Google Scholar]
- Harris A, Cardone G, Winkler DC, Heymann JB, Brecher M, White JM, Steven AC. Influenza virus pleiomorphy characterized by cryoelectron tomography. Proc Natl Acad Sci U S A. 2006;103:19123–7. doi: 10.1073/pnas.0607614103. [DOI] [PMC free article] [PubMed] [Google Scholar]
- Heymann JB, Cardone G, Winkler DC, Steven AC. Computational resources for cryo-electron tomography in Bsoft. J Struct Biol. 2008;161:232–42. doi: 10.1016/j.jsb.2007.08.002. [DOI] [PMC free article] [PubMed] [Google Scholar]
- Huiskonen JT, Jaalinoja HT, Briggs JA, Fuller SD, Butcher SJ. Structure of a hexameric RNA packaging motor in a viral polymerase complex. J Struct Biol. 2007;158:156–64. doi: 10.1016/j.jsb.2006.08.021. [DOI] [PubMed] [Google Scholar]
- Huiskonen JT, de Haas F, Bubeck D, Bamford DH, Fuller SD, Butcher SJ. Structure of the bacteriophage phi6 nucleocapsid suggests a mechanism for sequential RNA packaging. Structure. 2006;14:1039–48. doi: 10.1016/j.str.2006.03.018. [DOI] [PubMed] [Google Scholar]
- Juuti JT, Bamford DH. RNA binding, packaging and polymerase activities of the different incomplete polymerase complex particles of dsRNA bacteriophage ϕ6. J. Mol. Biol. 1995;249:545–554. doi: 10.1006/jmbi.1995.0317. [DOI] [PubMed] [Google Scholar]
- Juuti JT, Bamford DH, Tuma R, Thomas GJ., Jr. Structure and NTPase activity of the RNA-translocating protein (P4) of bacteriophage phi 6. J Mol Biol. 1998;279:347–59. doi: 10.1006/jmbi.1998.1772. [DOI] [PubMed] [Google Scholar]
- Koster AJ, Grimm R, Typke D, Hegerl R, Stoschek A, Walz J, Baumeister W. Perspectives of molecular and cellular electron tomography. J Struct Biol. 1997;120:276–308. doi: 10.1006/jsbi.1997.3933. [DOI] [PubMed] [Google Scholar]
- Mastronarde DN. Automated electron microscope tomography using robust prediction of specimen movements. J Struct Biol. 2005;152:36–51. doi: 10.1016/j.jsb.2005.07.007. [DOI] [PubMed] [Google Scholar]
- Mindich L. Precise packaging of the three genomic segments of the double-stranded-RNA bacteriophage phi6. Microbiol Mol Biol Rev. 1999;63:149–60. doi: 10.1128/mmbr.63.1.149-160.1999. [DOI] [PMC free article] [PubMed] [Google Scholar]
- Newcomb WW, Homa FL, Brown JC. Involvement of the portal at an early step in herpes simplex virus capsid assembly. J Virol. 2005;79:10540–6. doi: 10.1128/JVI.79.16.10540-10546.2005. [DOI] [PMC free article] [PubMed] [Google Scholar]
- Olkkonen VM, Gottlieb P, Strassman J, Qiao XY, Bamford DH, Mindich L. In vitro assembly of infectious nucleocapsids of bacteriophage phi 6: formation of a recombinant double-stranded RNA virus. Proc Natl Acad Sci U S A. 1990;87:9173–7. doi: 10.1073/pnas.87.23.9173. [DOI] [PMC free article] [PubMed] [Google Scholar]
- Patton JT, Spencer E. Genome replication and packaging of segmented double-stranded RNA viruses. Virology. 2000;277:217–25. doi: 10.1006/viro.2000.0645. [DOI] [PubMed] [Google Scholar]
- Pirttimaa MJ, Paatero AO, Frilander MJ, Bamford DH. Nonspecific nucleoside triphosphatase P4 of double-stranded RNA bacteriophage phi6 is required for single-stranded RNA packaging and transcription. J Virol. 2002;76:10122–7. doi: 10.1128/JVI.76.20.10122-10127.2002. [DOI] [PMC free article] [PubMed] [Google Scholar]
- Press WH, Teukolsky SA, Vetterling WT, Flannery BP. Numerical Recipes in C: The art of scientific computing. Cambridge University Press; New York: 2002a. Confidence Limits on Estimated Model Parameters; pp. 689–699. [Google Scholar]
- Press WH, Teukolsky SA, Vetterling WT, Flannery BP. Numerical Recipes in C: The art of scientific computing. Cambridge University Press; New York: 2002b. Downhill Simplex Method in Multidimensions; pp. 408–412. [Google Scholar]
- Qiao X, Qiao J, Mindich L. Stoichiometric packaging of the three genomic segments of double-stranded RNA bacteriophage phi6. Proc Natl Acad Sci U S A. 1997;94:4074–9. doi: 10.1073/pnas.94.8.4074. [DOI] [PMC free article] [PubMed] [Google Scholar]
- Richards FM. The interpretation of protein structures: total volume, group volume distributions and packing density. J Mol Biol. 1974;82:1–14. doi: 10.1016/0022-2836(74)90570-1. [DOI] [PubMed] [Google Scholar]
- Sen A, Heymann JB, Cheng N, Qiao J, Mindich L, Steven AC. Initial location of the RNA-dependent RNA polymerase in the bacteriophage Phi6 procapsid determined by cryo-electron microscopy. J Biol Chem. 2008;283:12227–31. doi: 10.1074/jbc.M710508200. [DOI] [PMC free article] [PubMed] [Google Scholar]
- Sokal RR, Rohlf FJ. Biometry: the principles and practice of statistics in biological research. 3rd edition. Freeman; New York: 1994. ed. [Google Scholar]
- Trus BL, Newcomb WW, Cheng N, Cardone G, Marekov L, Homa FL, Brown JC, Steven AC. Allosteric signaling and a nuclear exit strategy: binding of UL25/UL17 heterodimers to DNA-Filled HSV-1 capsids. Mol Cell. 2007;26:479–89. doi: 10.1016/j.molcel.2007.04.010. [DOI] [PMC free article] [PubMed] [Google Scholar]
- Wei H, Cheng RH, Berriman J, Rice WJ, Stokes DL, Katz A, Morgan DG, Gottlieb P. Three-dimensional structure of the enveloped bacteriophage phi12: an incomplete T = 13 lattice is superposed on an enclosed T = 1 shell. PLoS One. 2009;4:e6850. doi: 10.1371/journal.pone.0006850. [DOI] [PMC free article] [PubMed] [Google Scholar]
Associated Data
This section collects any data citations, data availability statements, or supplementary materials included in this article.