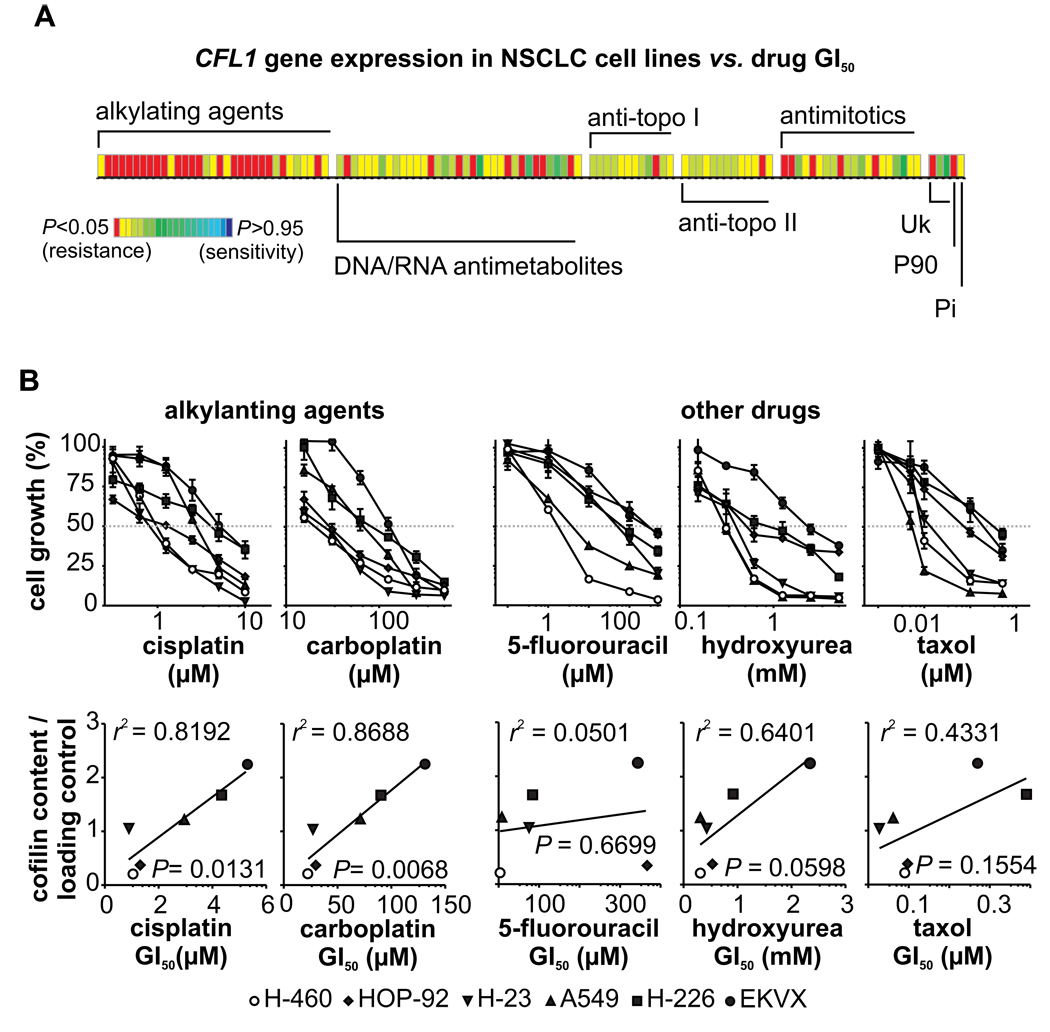
FIGURE 4. CFL1 mRNA and protein levels vs. drug sensitivity/resistance profile.
(A) Microarray meta-data of the cell lines are crossed against GI50 values of 118 standard chemotherapy agents (from NCI-60 drug discovery pipeline). P values have been color coded according to the scale shown; P < 0.05 indicates a significant negative correlation (resistance) while P > 0.95 indicates a significant positive correlation (sensitivity). The major mechanism of drug action is shown (the term “alkylating agents” is used broadly to include platinating agents; Uk: unknown; P90: hsp90 binder; Pi: protein synthesis inhibitor). Each column within the matrix represents the Spearman correlation between gene expression and toxicity of an individual drug. (B) In vitro validation of the citotoxicity for selected drugs assayed by the sulforhodamine B (SRB) method (upper plots). The obtained drug GI50 values were correlated with cofilin immunocontent (lower plots).

