

Abstract
Introduction:
Researchers have used breath carbon monoxide (CO) cutoff values ranging from 4 to 10 ppm to define abstinence in cigarette-smoking cessation research and reductions in CO as a measure of acute abstinence in laboratory research. The current study used a reversal design to investigate effects of exhalation speed on CO output in four groups (non-, light, moderate, and heavy smokers; n = 20 per group).
Methods:
In one condition, participants were instructed to empty their lungs as quickly as possible (fast), whereas in a different condition, participants were instructed to empty their lungs at a slow pace (slow). Conditions were counterbalanced and repeated twice for each participant.
Results:
For all groups, speed of exhalation was significantly lower during the slow condition than during the fast condition, and CO output was significantly higher during the slow condition than during the fast condition. Sensitivity and specificity analyses revealed that the optimal CO cutoff for smoking abstinence was 3 ppm during the fast condition versus 4 ppm during the slow condition. Additionally, when heavy smokers switched from exhaling slow to exhaling fast, they showed an approximately 30% reduction in CO.
Discussion:
The results suggest that exhalation speed should be monitored when CO is used as a measure of smoking status for laboratory and smoking cessation research. If exhalation speed is not monitored when using CO to verify smoking cessation, then more conservative CO cutoff values should be used to avoid false negative CO readings.
Introduction
Breath carbon monoxide (CO) is a simple and noninvasive method for evaluating smoking status and is often used in laboratory and clinical settings to verify acute and chronic abstinence from smoking (Chivers, Higgins, Heil, Proskin, & Thomas, 2008; Dallery, Glenn, & Raiff, 2007; Rose, Salley, Behm, Bates, & Westman, 2010). When CO is used to measure smoking abstinence, researchers identify a cutoff value to categorize individuals as either positive or negative for smoking. The Society for Research on Nicotine and Tobacco recommends a cutoff of 8–10 parts per million (ppm; Benowitz et al., 2002). More recent findings suggest that cutoff values should be lower, around 3 or 4 ppm (e.g., Javors, Hatch, & Lamb, 2005). A CO cutoff that is too high will allow smokers to meet the criterion, even if they have reduced, rather than quit, smoking. Unfortunately, the health benefits of reducing smoking are not well understood (Pisinger & Godtfredsen, 2007); thus, current guidelines recommend complete abstinence (Fiore, 2000). Alternatively, a CO cutoff that is too low might incorrectly classify individuals as smokers, even if they have abstained. These concerns become more pronounced when consequences are delivered for smoking abstinence (e.g., contingency management for smoking cessation; Dunn et al., 2010). Additionally, laboratory studies often use CO to verify acute abstinence, where reductions in CO are required (e.g., 33% reduction = overnight abstinence; Dallery & Raiff, 2007; Rose et al., 2010).
To measure CO, smokers are typically instructed to take a deep breath and hold it for 15–20 s, after which they exhale into a CO monitor. Despite the importance of CO as a measure of smoking status, little research has been conducted regarding the best practices for collecting a CO sample (Rea & Williams, 2002; West, 1984) and how this might affect decisions for verifying acute and chronic smoking abstinence. To our knowledge, no experiment has investigated how speed of emptying the lungs affects CO output. Thus, the current study experimentally manipulated exhalation speed and explored how it affected CO output, as well as decisions about CO cutoff criterions. Participants were divided into four groups based on smoking status (non-, light, moderate, and heavy smokers) to assess a range of CO values. All groups were exposed to two experimental conditions. In the slow condition, participants were instructed to exhale at a slow pace. In the fast condition, participants were instructed to exhale as quickly as possible.
Methods
Participants
Participants were recruited via undergraduate psychology classes, telephone screenings, and in person. Participants were divided into four groups based on their self-reported smoking (n = 20 per group): nonsmokers (never smoked cigarettes, marijuana, or other tobacco products), light smokers (1–10 cigarettes/day), moderate smokers (11–20 cigarettes/day), and heavy smokers (21+ cigarettes/day). Participants were ineligible if they reported smoking marijuana or other tobacco products within the previous 24 hr or if they were not between the ages of 18 and 65. The University of Florida Institutional Review Board approved all procedures.
Materials
Breath samples were collected using a piCO+ CO monitor, which is accurate within ±2% (Bedfont Scientific USA, Williamsburg, VA). CO monitors were calibrated at least every 6 months, per the manufacturer’s recommendations. Digital timers were used to measure exhalation speed and time between samples. Research assistants (RA) began timing exhalations when participants placed their lips onto the CO monitor mouthpiece and ended timing when participants removed their lips from the mouthpiece. Seventy-four percent of sessions were recorded using a digital web camera (QuickCam 8.0; Logitech, Fremont, CA). All videos that clearly showed the beginning and end of an exhalation were reviewed by an RA for calculating interobserver agreement on exhalation speed.
Procedures
Assessments
Sessions began by obtaining informed consent, after which participants completed the Fagerström Test for Nicotine Dependence (FTND; Heatherton, Kozlowski, Frecker, & Fagerström, 1991) and reported their demographics, smoking history, and smoking status.
Experimental conditions
The session consisted of two conditions where participants were instructed to take a deep breath and hold it for 15 s. During the “fast” condition, participants were instructed to empty their lungs into the CO monitor as fast as possible, whereas in the “slow” condition, they were instructed to empty their lungs at a slow pace. A counterbalanced ABAB reversal design was employed. Participants were randomly assigned to one of two orders (fast–slow–fast–slow or slow–fast–slow–fast). Each condition was separated by a minimum of 2 min, and sessions were approximately 15 min. At the end of the session, participants either received course credit (students) or randomly selected a prize consisting of $10.00 to Walmart, $5.00 to Publix grocery, or discount coupons.
Interobserver agreement
Interobserver agreement (IOA) was collected to verify exhalation speed. An RA (different from the one who conducted the session) viewed the videos. IOA was calculated by taking the smaller observed speed, dividing it by the larger speed, and multiplying by 100 (Cooper, Heron, & Heward, 2007). Mean IOA was 91%.
Data analysis
Analyses of variance (ANOVAs) were conducted to verify that there was a significant difference between groups for number of cigarettes smoked per day and FTND scores. Repeated measures ANOVAs assessed whether there were differences in CO and exhalation speed across conditions and groups and whether there was an effect of condition order. When main effects were found, Bonferroni post-hoc analyses were performed. Results were deemed statistically significant at p < .05. All measures of variance are SDs, unless otherwise noted.
Finally, to identify an optimal CO cutoff, sensitivity and specificity were calculated at various CO levels for the slow and fast conditions. All participants in the nonsmoking, and three participants in the light smoking group who reported smoking a cigarette greater than 24 hr from the session, were classified as nonsmokers for this analysis. The remaining 17 light smokers reported smoking within the previous 24 hr and were classified as smokers (mean time since last cigarette 5.5 hr). Because of the half-life of breath CO (approximately 2–8 hr; Benowitz et al., 2002), a 24-hr window was adequate for classifying individuals as either a smoker or a nonsmoker. Light smokers were used for the analysis because the purpose was to identify a sensitive CO cutoff that would ensure that people who are trying to quit will be unable to meet the cutoff, even if they smoke a few cigarettes per day.
Sensitivity, defined as the ability of a particular CO cutoff to accurately detect smoking when smoking has taken place (Javors et al., 2005), was calculated by assessing the correspondence between smokers and their obtained CO level at CO cutoffs ranging from 1 to 10 ppm. For example, if a participant reported smoking and blew a CO of 5 ppm, then all CO cutoff values of 1, 2, 3, or 4 ppm would accurately categorize the individual as a smoker, whereas all CO cutoffs at or above 5 ppm would incorrectly categorize the individual as a nonsmoker. For each cutoff, the proportion of participants with CO values above that cutoff, out of all participants who reported smoking, were calculated. For example, 34 (out of 80) samples involved participants who reported smoking cigarettes and only 18 of those samples were 10 ppm or higher during the slow condition (i.e., 18/34 = 0.53), whereas 34 samples were 5 ppm or lower (i.e., 34/34 = 1.00).
Specificity, defined as the ability of a CO cutoff to accurately detect smoking abstinence when no smoking has taken place (Javors et al., 2005), was calculated by assessing the correspondence between nonsmokers and their obtained CO levels at each CO cutoff. If an abstinent participant blew a CO of 5 ppm, then all CO cutoffs at or above 5 ppm would accurately categorize the individual as a nonsmoker, whereas all CO cutoffs below 5 ppm would inaccurately categorize the individual as a smoker. For example, 46 (out of 80) samples involved participants who reported not smoking and only one of those samples were 1 ppm during the slow condition (i.e., 1/46 = 0.02), whereas 43 samples were 5 ppm or lower (i.e., 43/46 = 0.94).
Results
Participant characteristics
Participants in the nonsmoker group were 65% female, 18–21 years old, and 45% Caucasian. The light, moderate, and heavy smokers were comprised 70%, 60%, and 30% females; 18–54, 19–55, and 27–62 years old; and 70%, 90%, and 85% Caucasian, respectively. As intended, there were significant differences between smoking groups for number of cigarettes smoked per day, F(3, 57) = 6420.4, and FTND scores, F(3, 57) = 267.6. Participants in the light group smoked fewer cigarettes (mean = 6.31 ± 3.4) and had lower FTND scores (mean = 1.7 ± 1.8) than those in the moderate group (mean cigarettes per day = 18.0 ± 2.5; FTND = 5.0 ± 1.8), who smoked fewer cigarettes and had lower FTND scores than those in the heavy group (mean cigarettes per day = 31.6 ± 6.2; FTND = 6.8 ± 2.0).
CO values and exhalation speed
Figure 1 shows CO values obtained for the non-, light, moderate, and heavy smokers across the fast (gray) and slow (white) conditions. There was a significant difference between conditions, F(3, 216) = 97.9, groups, F(3, 72) = 33.7, and a Condition × Group interaction, F(9, 216) = 17.7. Post hocs showed that CO values during both fast conditions were significantly lower than during both slow conditions (mean 16.2 vs. 23.4 ppm, respectively); however, there were no significant differences between the first and second fast, or the first and second slow, conditions. Furthermore, CO values for the non- and light smokers were not different from each other (mean = 2.5 vs. 9.0 ppm), but they were lower than the moderate and heavy smokers, which were not different from each other (mean = 27.7 vs. 40.7 ppm). The difference in CO between fast and slow increased as cigarette consumption increased (mean difference: nonsmoker = 1.2, light = 3.4, moderate = 10.1, and heavy = 14.3 ppm). There was no difference in CO between orders of exposure to conditions.
Figure 1.

Mean (+SD) carbon monoxide levels obtained for fast (gray bars) and slow (white bars) conditions across the non-, light, moderate, and heavy smokers. Significant differences (p < .05) are indicated by an asterisk.
As with CO, there was a significant difference between exhalation speed across conditions, F(3, 216) = 247.1, groups, F(3, 72) = 4.0, and a Condition × Group interaction, F(9, 216) = 3.3. Post hocs showed that exhalation speed during both fast conditions were lower than during both slow conditions (mean fast = 4.4 vs. slow = 15.0 s); however, there were no differences between the first and second fast, or the first and second slow, conditions. The moderate group exhaled slower than nonsmokers, but neither group was significantly different from any of the other groups. There was a marginally significant difference for order, F(1, 72) = 4.2, p = .05, with slightly faster exhalation speeds for individuals exposed to the slow–fast–slow–fast order.
Sensitivity and specificity
Table 1 shows sensitivity and specificity proportions at CO cutoffs ranging from 1 to 10 ppm for the non- and light smoker groups. During the fast condition, a CO cutoff of 3 ppm maximized the likelihood of correctly identifying a smoker while also correctly identifying a nonsmoker (sensitivity + specificity, Table 1). During the slow condition, a CO cutoff value of 4 ppm was required to accurately classify smokers and nonsmokers. Two participants who self-reported not smoking in the previous 24 hr (one non- and one light smoker) were categorized as smokers during both exposures to the slow condition, with a cutoff of 4 ppm (i.e., 9% false positive), and one participant who self-reported smoking was incorrectly categorized as a nonsmoker during both exposures to the fast condition (i.e., 6% false negative).
Table 1.
Specificity and sensitivity measures for the fast and slow conditions (non- and light smoker groups only)
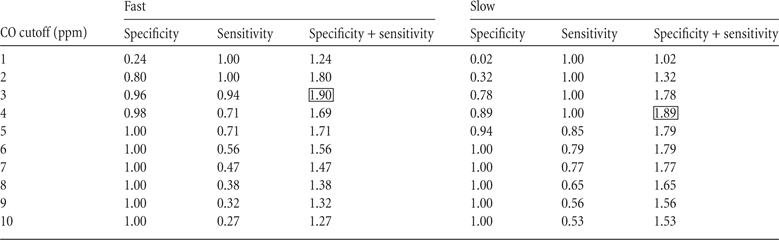 |
Note. The cutoff value for a CO test indicates that a value at or below the cutoff would be considered negative for smoking. Sensitivity + specificity was calculated to identify the cutoff level that would have the highest combined sensitivity plus sensitivity (shown by the box).
Discussion
The current study demonstrated that experimentally manipulating exhalation speed resulted in significantly different CO outcomes. Regardless of smoking status (non-, light, moderate, or heavy smokers), participants submitted higher CO values when they exhaled at a slow pace compared with when they exhaled at a fast pace. This pattern was reliable, with approximately 90% of participants submitting a lower CO when blowing fast versus when blowing slow during both exposures to the conditions.
For researchers using CO as a measure of acute abstinence, where percentage reductions in CO are required, it is imperative that exhalation speed remains consistent across CO samples. When participants in the heavy group changed their exhalation speed from slow to fast (there was only a 2-min delay between samples), it resulted in a 30% lower CO value (i.e., mean fast = 33.65 vs. slow = 47.9 ppm). As long as participants are consistent across samples, such discrepancies should not arise. However, few studies report controlling or monitoring exhalation speed when collecting CO samples (Javors et al., 2005). Thus, researchers and clinicians may wish to collect exhalation speed to ensure procedural integrity.
For researchers and clinicians using CO as a measure of chronic abstinence, recall that a CO cutoff of 8–10 ppm is currently recommended (Benowitz et al., 2002). In the current study, 8–10 ppm would have only classified 27%–65% of smokers as positive. Furthermore, based on the sensitivity and specificity analyses, a lower cutoff might more accurately classify smokers and nonsmokers if participants exhale quickly versus slowly. If exhalation speed is not monitored, a more conservative CO cutoff value of 3 ppm may be warranted. Other studies have successfully used cutoffs within this range (e.g., Cropsey et al., 2008). Importantly, in the current study, increasing the cutoff from 3 to 4 ppm during the fast condition resulted in an increase in the false negative rate from 6% to 29% (Table 1). If higher cutoff values are used, minimum exhalation speeds should be considered. In the current study, the median for the fast condition was 4 s (interquartile range = 3–5 s) and the median for the slow condition was 14 s (interquartile range = 10–18 s). Only 3% of exhalations during the fast condition were ≥10 s; thus, a minimum exhalation speed of 10 s would be reasonable when a higher CO cutoff is used. Maximum speeds are not recommended because if individuals with larger lung capacities need longer to empty their lungs, ending too early would underestimate their CO levels.
The current study used the piCO+ monitor. To determine the generality of the current findings, we conducted a pilot test, using the same procedure with two different CO monitors (Micro+ and COmpact, Bedfont Scientific USA). Two moderate smokers were counterbalanced to which monitor and condition they tested first. For both participants, their CO was consistently higher during both slow conditions than during both fast conditions (Micro+ mean fast = 21.3 ± 3.0 and slow = 30.5 ± 3.7 ppm; COmpact mean fast = LEVEL 4.8 ± 0.5; slow = LEVEL 6 ± 0.0) regardless of the monitor and condition order.
Finally, there may be individual subject variables that affect CO but were not systematically investigated in the current study. For example, lung volume is positively associated with CO output (r = .64; Terheggen-Lagro, Bink, Vreman, & van der Ent, 2003). Participants with greater lung volume would be expected to take longer to empty their lungs. Lung functioning is also negatively related to smoking severity (Beck, Doyle, & Schachter, 1981; Gold et al., 1996). Lactose intolerance has also been associated with CO output (McNeill, Owen, Belcher, Sutherland, & Fleming, 1990). Finally, factors that affect the half-life of CO (e.g., physical activity), as well as time since last cigarette, can influence CO outcomes (Benowitz et al., 2002). Fortunately, the finding in the current study, that speed of exhalation affects CO output, could not be accounted for by differences in lung volume, lung function, lactose intolerance, or CO half-life because all participants were exposed to both conditions.
Funding
This work was supported by the National Institutes of Drug Abuse at the National Institutes of Health (R01DA019580).
Declaration of Interests
None declared.
Acknowledgments
We thank Whitney Dunham and Zaday Sanchez for assisting with data collection. We thank Jin Yoon, Steven Meredith, Jeb Jones, Rachel Cassidy, Alana Rojewski, and Jennifer Rusak for their helpful comments during the development of this manuscript. Finally, we thank Eric Donny for the conversation that set the occasion for this experiment.
References
- Beck GJ, Doyle CA, Schachter EN. Smoking and lung function. American Review of Respiratory Disease. 1981;123:149–155. doi: 10.1164/arrd.1981.123.2.149. [DOI] [PubMed] [Google Scholar]
- Benowitz NL, Jacob P, Ahijevych K, Jarvis MJ, Hall S, LeHouezec J, et al. Biochemical verification of tobacco use and cessation. Nicotine & Tobacco Research. 2002;4:149. [Google Scholar]
- Chivers LL, Higgins ST, Heil SH, Proskin RW, Thomas CS. Effects of initial abstinence and programmed lapses on the relative reinforcing effects of cigarette smoking. Journal of Applied Behavior Analysis. 2008;41:481–497. doi: 10.1901/jaba.2008.41-481. [DOI] [PMC free article] [PubMed] [Google Scholar]
- Cooper JO, Heron TE, Heward WL. Applied behavior analysis. 2nd ed. Upper Saddle River, NJ: Pearson Prentice Hall; 2007. [Google Scholar]
- Cropsey K, Eldridge G, Weaver M, Villalobos G, Stitzer M, Best A. Smoking cessation intervention for female prisoners: Addressing an urgent public health need. American Journal of Public Health. 2008;98:1894–1901. doi: 10.2105/AJPH.2007.128207. [DOI] [PMC free article] [PubMed] [Google Scholar]
- Dallery J, Glenn IM, Raiff BR. An Internet-based abstinence reinforcement treatment for cigarette smoking. Drug and Alcohol Dependence. 2007;86:230–238. doi: 10.1016/j.drugalcdep.2006.06.013. [DOI] [PubMed] [Google Scholar]
- Dallery J, Raiff BR. Delay discounting predicts cigarette smoking in a laboratory model of abstinence reinforcement. Psychopharmacology. 2007;190:485–496. doi: 10.1007/s00213-006-0627-5. [DOI] [PubMed] [Google Scholar]
- Dunn KE, Sigmon SC, Reimann EF, Badger GJ, Heil SH, Higgins ST. A contingency-management intervention to promote initial smoking cessation among opioid-maintained patients. Experimental and Clinical Psychopharmacology. 2010;18:37–50. doi: 10.1037/a0018649. [DOI] [PMC free article] [PubMed] [Google Scholar]
- Fiore MC. US public health service clinical practice guideline: Treating tobacco use and dependence. Respiratory Care. 2000;45:1200–1262. [PubMed] [Google Scholar]
- Gold DR, Wang X, Wypij D, Speizer FE, Ware JH, Dockery DW. Effects of cigarette smoking on lung function in adolescent boys and girls. New England Journal of Medicine. 1996;335:931–937. doi: 10.1056/NEJM199609263351304. [DOI] [PubMed] [Google Scholar]
- Heatherton TF, Kozlowski LT, Frecker RC, Fagerström KO. The Fagerström Test for Nicotine Dependence: A revision of the Fagerström Tolerance Questionnaire. British Journal of Addiction. 1991;86:1119–1127. doi: 10.1111/j.1360-0443.1991.tb01879.x. [DOI] [PubMed] [Google Scholar]
- Javors MA, Hatch JP, Lamb RJ. Cut-off levels for breath carbon monoxide as a marker for cigarette smoking. Addiction. 2005;100:159–167. doi: 10.1111/j.1360-0443.2004.00957.x. [DOI] [PubMed] [Google Scholar]
- McNeill AD, Owen LA, Belcher M, Sutherland G, Fleming S. Abstinence from smoking and expired-air carbon monoxide levels: Lactose intolerance as a possible source of error. American Journal of Public Health. 1990;80:1114–1115. doi: 10.2105/ajph.80.9.1114. [DOI] [PMC free article] [PubMed] [Google Scholar]
- Pisinger C, Godtfredsen NS. Is there a health benefit of reduced tobacco consumption? A systematic review. Nicotine & Tobacco Research. 2007;9:631–646. doi: 10.1080/14622200701365327. [DOI] [PubMed] [Google Scholar]
- Rea J, Williams D. Shaping exhale durations for breath CO detection for men with mild mental retardation. Journal of Applied Behavior Analysis. 2002;35:415–418. doi: 10.1901/jaba.2002.35-415. [DOI] [PMC free article] [PubMed] [Google Scholar]
- Rose J, Salley A, Behm F, Bates J, Westman E. Reinforcing effects of nicotine and non-nicotine components of cigarette smoke. Psychopharmacology. 2010;210:1–12. doi: 10.1007/s00213-010-1810-2. [DOI] [PMC free article] [PubMed] [Google Scholar]
- Terheggen-Lagro SW, Bink MW, Vreman HJ, van der Ent CK. End-tidal carbon monoxide corrected for lung volume is elevated in patients with cystic fibrosis. American Journal of Respiratory and Critical Care Medicine. 2003;168:1227–1231. doi: 10.1164/rccm.200302-248OC. [DOI] [PubMed] [Google Scholar]
- West RJ. The effect of duration of breath-holding on expired air carbon monoxide concentration in cigarette smokers. Addictive Behaviors. 1984;9:307–309. doi: 10.1016/0306-4603(84)90026-1. [DOI] [PubMed] [Google Scholar]