

Abstract
Objective The factorial validity and measurement equivalence/invariance of scales used to measure social-cognitive correlates of physical activity among adolescent girls were examined. Methods Confirmatory factor analysis was applied to questionnaire responses obtained from a multi-ethnic sample (N = 4885) of middle-school girls from six regions of the United States. A cohort of 1893 girls completed the scales in both sixth and eighth grades, allowing longitudinal analysis. Results Theoretically and statistically sound models were developed for each scale, supporting the factorial validity of the scales in all groups. Multi-group and longitudinal invariance was confirmed across race/ethnicity groups, age within grade, BMI categories, and the 2-year period between grades. Conclusions The scores from the scales provide valid assessments of social-cognitive variables that are putative mediators or moderators of change in physical activity. The revised scales can be used in observational studies of change or interventions designed to increase physical activity among girls during early adolescence.
Keywords: African American, Asian American, confirmatory factor analysis, Hispanic/Latina, measurement equivalence/invariance, mediators, physical activity
The cumulative evidence supports that regular physical activity is strongly associated with positive health outcomes among adolescents (Strong et al., 2005; U.S. Department of Health and Human Services, 2008). However, their participation (Grunbaum et al., 2004) is below recommended levels (Strong et al., 2005). Girls have twice the rate of decline in physical activity during adolescence compared to boys (Grunbaum et al., 2004). Point-prevalence estimates indicate that leisure time physical activity among girls in the U.S. declines by 45% between ages 12 and 17 (Caspersen, Pereira, & Curran, 2000). Evidence also suggests that activity levels are lowest among girls of African American or Hispanic/Latino ancestry or who have high body mass index (BMI) (Gordon-Larsen, Adair, & Popkin 2002; Kimm et al., 2002; Sulemana, Smolensky, & Lai, 2006).
The search for mediators and moderators of change in physical activity that can guide interventions to increase physical activity levels among adolescent girls (e.g., Luban, Foster, & Biddle, 2008) has been hampered by the absence of validated instruments that have measurement equivalence across time and between girls who differ in age, race/ethnicity, or BMI. Mediators are variables in a causal sequence that transmit the relation or effect of an independent variable on a dependent variable. Moderators are variables not in a causal sequence but which modify the relation or effect between an independent variable and a dependent variable (MacKinnon, Fairchild, & Fritz, 2007).
Only a few studies of putative mediators and moderators of change in physical activity have established the factorial validity and invariance of self-report measurement instruments to ensure that their underlying constructs were each being measured similarly in different groups of people or at separate times (e.g., Dishman et al., 2002; Dishman, Saunders, Motl, Dowda, & Pate, 2008; Motl et al., 2000). Factorial validity is the degree to which the structure of a measure conforms to the theoretical definition of its construct (Messick, 1995). Multi-group factorial invariance is the degree to which factor structure (i.e., configural), factor loadings (i.e., metric), factor variances/covariances, item intercepts or means (i.e., scalar), and item errors (i.e., uniquenesses) are similar between different types of people (e.g., Friedman, Bryant, & Holmbeck, 2007; Vandenberg & Lance, 2000). Longitudinal factorial invariance is the degree to which those measurement properties are similar across points in time and is necessary for the proper interpretation of change across time in tests of mediation or moderation (Mackinnon et al., 2007). Without evidence for factorial invariance, differences between groups or across time in scores on a measure might reflect differences in the measurement properties of the self-report instrument (i.e., a change in meaning of the items and their relations) used rather than true differences in the latent variable.
Social-cognitive variables are putative moderators and mediators of self-initiated change in health behaviors such as physical activity (Bandura, 2004). For example, efficacy beliefs about the ease or difficulty of overcoming personal and environmental barriers to physical activity moderated the relation between naturally occurring change in perceived social support and declines in physical activity during high school among girls (Dishman et al., 2008). They also partially mediated the positive effect of a school-based intervention to increase ninth grade girls’ physical activity, regardless of outcome-expectancy values (Dishman et al., 2004). Consistent with social-cognitive theory (Bandura, 1997), other research found that self-management strategies, perceived barriers to physical activity, and enjoyment partially mediated relations between efficacy beliefs and physical activity participation among girls (Dishman, Motl, Sallis, et al., 2005; Dishman, Motl, Saunders et al., 2005).
Very few studies have examined whether these variables similarly help explain physical activity among younger girls (e.g., Garcia et al., 1995). The Trial of Activity for Adolescent Girls (TAAG) was a randomized controlled multi-center trial sponsored by the National Heart, Lung, and Blood Institute (NHLBI) designed to implement and evaluate a school and community linked intervention aimed to reduce by half the decline in physical activity in middle school girls between the sixth and eighth grades (Stevens et al., 2005; Webber et al., 2008). The intervention, based on the social ecological model, was intended to affect physical and social environments through programs in health education and physical education that link schools with community organizations (Elder et al., 2007).
Several social-cognitive variables were included in TAAG as possible mediators of change in physical activity. These included: self-efficacy for overcoming barriers to physical activity; self-management strategies, perceived barriers to physical activity; outcome-expectancy value of physical activity; enjoyment of physical activity, and social support of physical activity. The validity of the measures had not been reported among sixth grade girls, so in a pilot study prior to the TAAG trial we used confirmatory factor analysis to establish the factorial validity and multi-group (i.e., between grades) and longitudinal (i.e., 2 weeks) invariance of the measures (with the exception of social support) in separate samples of sixth (n = 309) and eighth (n = 296) grade girls (Dishman, Motl, Sallis, et al., 2005). The sample sizes in the pilot study were too small to permit tests of the measurement equivalence/invariance of the measures according to age, race/ethnicity or BMI, and longitudinal invariance was limited to the 2-week test-retest stability of the measures.
Here, we report on the factorial validity in each grade and the multi-group (i.e., White, Black, Hispanic/Latina in each grade; age levels within grade; and low, average, and high BMI) and longitudinal (i.e., 2-year period) invariance of scales used to measure these putative social-cognitive mediators of change in physical activity among a large, diverse sample of sixth and eighth grade girls who were students at schools participating in the TAAG trial.
Methods
Participants
The multi-ethnic sample included 4,885 adolescent girls representing six geographically diverse areas of the US who were recruited from schools participating in TAAG. Cross-sectional samples included all volunteers who completed the study's measurement protocol in the sixth grade (N = 2818; mean age = 12 ± 0.5) and in the eighth grade (N = 3960; mean age 14 ± 0.5). The sample included girls randomly selected from TAAG schools for the purpose of evaluating the TAAG intervention and adventitious recruits who participated but were not included in the test of intervention outcomes (Webber et al., 2008). Sixty-one percent of the girls included here were in the sixth grade random sample used to evaluate the intervention. Eight-eight percent were in the eighth grade random sample. The race/ethnicity proportions in the sixth and eighth grades were: 44.1% and 45.8% White, 24.3% and 22.2% Black, 20.4% and 21.0% Hispanic/Latina, 3.7% and 4.6% Asian, 0.7% and 0.4% American Indian and 6.8% and 6.1% other (e.g., multi-ethnic). BMI was significantly higher for eighth grade girls (22.8 ± 5.3 vs. 20.8 ± 4.9), but the proportion of girls with BMI values above the age-specific 95th percentile did not change from sixth grade (15%) to eighth (14.2%) grade. Sample sizes (n) in sub-groups analyzed in this report were: Race/Ethnicity [White sixth (1,235) eighth (1814), Black sixth (679) eighth (878), Hispanic/Latina sixth (571) eighth (830), Asian sixth (104) eighth (181)]; Age (years) within grade 6 [11–11.5 (278), 11.5–12 (818), 12–12.5 (614)]; Age within grade 8 [13–13.5 (558), 13.5–14 (1,623), 14–14.5 (1,231), 14.5–15 (290)]; BMI [< 85th percentile sixth (1308) eighth (2821), 85th to 95th sixth (306) eighth (510), > 95th sixth (285) eighth (553)].
Among the eighth grade girls, 1,893 completed measures in the sixth grade, providing an adventitious cohort which permitted longitudinal analysis of repeated measures across 2 years. This prospective cohort was generally representative of the TAAG sample. Half the cohort was assigned to treatment and half was in the random samples from TAAG schools in the sixth grade (49%) and the eighth grade (51%). The race/ethnicity proportions were: 50.7% White, 21.9% Black, 17.9% Hispanic/Latina, 4% Asian, 0.3% American Indian, and 5.3% other. The cohort did not differ (p > .05 adjusted for multiple comparisons) from other TAAG participants on physical activity, BMI, or the social-cognitive variables, with the exception that in the eighth grade the cohort had lower mean scores (95% CI) on perceived barriers, 2.06 (2.05, 2.06) versus 2.13 (2.12, 2.14) and higher scores on perceived family support, 3.2 (3.15, 3.25) versus 3.1 (3.06, 3.14). Differences in all comparisons were small (ω2 < 0.01).
Study Design
TAAG involved collaboration among six field centers (the Universities of Arizona, Maryland, Minnesota, and South Carolina, San Diego State University, and Tulane University), the coordinating center at the University of North Carolina, Chapel Hill, and the NHLBI. A Data and Safety Monitoring Board provided oversight. Six schools per field center (n = 36 schools) were randomized to intervention or control conditions. Schools eligible for participation in the trial were publicly funded schools with no magnet or special populations and had less than 28% student drop-out rate. The measurement design consisted of sequential, cross-sectional measurements which provided baseline and follow-up data (Stevens et al., 2005).
Data Collection Procedures
All measurement protocols were reviewed and approved by the respective Institutional Review Boards at each of the seven universities involved in the study. Girls participated in measurement only after they provided written parental consent and signed an assent form. A student was excluded if she had limited English-speaking skills or was unable to participate in physical education classes because of a medical condition or disability. Data collection documents were pre-labeled prior to field use with either a unique identification (ID) number for each student or a bar code representing the ID. Student enrollment lists and ID labels were generated by the Coordinating Center through the TAAG Data Management System (DMS). All data were collected by TAAG staff trained according to standardized protocols and certified for data collection only after practice administrations.
Measures
Each girl responded to two questions about race/ethnicity. The first asked whether the girl thought of herself as Hispanic or Mexican American or of Spanish origin. The second asked whether the girl thought of herself as White, Black or African American, Asian, Native Hawaiian or other Pacific Islander, American Indian or Alaska Native, or other (e.g., multi-ethnic).
Height and weight were each assessed with two trials using a Shorr height board and a Seca Model 880 weight scale. Height measurements were repeated if the difference between the two measurements was ≥1 cm. Weight measurements were repeated if the difference was ≥0.5 kg. Girls were evaluated in their bare feet or wearing socks after removing all excess clothing and any heavy accessories. BMI was computed as kg/m2.
A Student Questionnaire was developed by a TAAG working group for the purpose of measuring mediators, moderators and secondary outcomes as specified by the TAAG theoretical model. The working group included representatives from all sites, the coordinating center, and NHLBI and was supervised by the TAAG Measurement Sub-Committee and Steering Committee. Based on prior studies (Dishman, Motl, Sallis, et al., 2005) and focus groups (Vu, Murrie, Gonzalez, & Jobe, 2006) of girls, measures of six social-cognitive constructs were included in TAAG as possible mediators of change in physical activity. Items retained from each scale after the analyses reported here can be found in the appendix. All items were rated by the girls using a 5-point Likert-type response format.
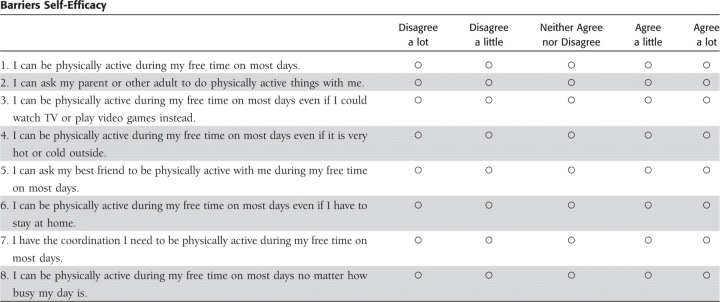
Self-efficacy was measured using an eight-item questionnaire developed for use with fifth, eighth, and ninth grade girls (Dishman et al., 2002; Motl et al., 2000; Saunders et al., 1997). The test-retest stability in sixth and eighth grade girls approximated .84 across 2 weeks in the TAAG pilot study (Dishman, Motl, Sallis, et al., 2005).
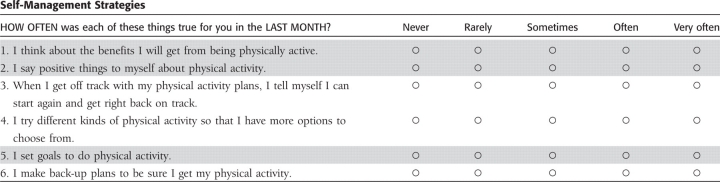
Self-management Strategies were measured using a modified version (Dishman, Motl, Sallis, et al., 2005) of a scale derived from self-management theory for use with college students (Saelens et al., 2000). The scale included four items that represented cognitive strategies and four items that represented behavioral strategies. The correlation between the cognitive and behavior factors approximated .85 test-retest stability of the total score was .84 across 2 weeks in the TAAG pilot study.
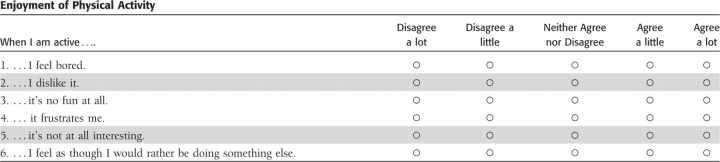
Enjoyment of physical activity was measured using the seven negatively worded items from the modified 16-item version of the Physical Activity Enjoyment Scale (Motl et al., 2001). The test-retest stability approximated .73 across 2 weeks in the TAAG pilot study.
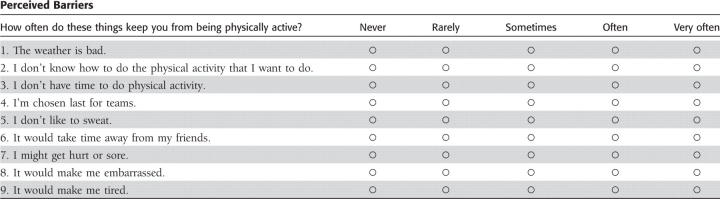
Perceived barriers to physical activity were assessed by an abridged 10-item version of a measure developed for the TAAG pilot study (Dishman, Motl, Sallis, et al., 2005). The test-retest stability approximated .77 across 2 weeks.
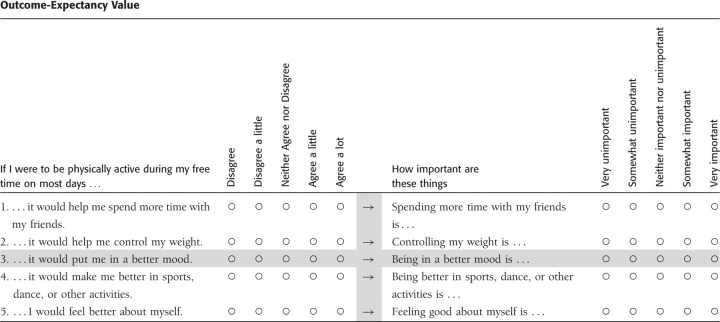
Outcome-expectancy value of physical activity was measured by the product of nine belief statements and their corresponding value statements adapted from previously developed scales for the TAAG pilot study (Dishman, Motl, Sallis, et al., 2005). The test-retest stability approximated .64 across 2 weeks.
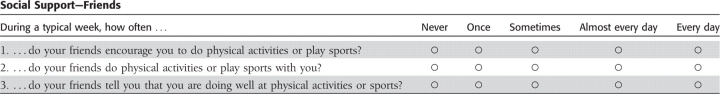
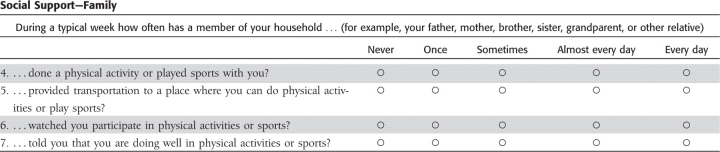
Social Support was measured using two correlated scales from the student survey of the Amherst Health and Activity Study (Sallis, Taylor, Dowda, Freedson, & Pate, 2002) that represented family and friend support for physical activity.
Data Analysis
Confirmatory factor analysis (CFA) models were tested with full-information maximum likelihood (FIML) estimation using Mplus 5.1 (Muthén & Muthén, 1998–2008). The proportion of missing item responses for each scale ranged from 0.1% to 7.1% in sixth grade and 0.2% to 1.5% in eighth grade. Overall missingness was 2.6% (4,439 of 169,080 responses) among sixth graders and 0.79% (1,887 of 237,600 responses) among eighth graders. In contrast to other techniques such as pair wise and list wise deletion of cases, FIML yields accurate fit indices and parameter estimates with up to 25% simulated missing data (Enders & Bandalos, 2001). Covariances could be computed for > 96% and > 98.5% of the variables for sixth and eighth grade girls, respectively. List wise deletion per scale would have retained 90% to 96.5% of sixth girls and 95.9% to 98.3% of eighth grade girls. Item/scale descriptive statistics were obtained using SPSS 16.0. Internal consistency reliability of each scale was estimated by the Cronbach alpha coefficient and by composite reliability based on CFA. Alpha underestimates the reliability of a composite score, especially for a multidimensional scale, because it assumes uncorrelated errors among the indicators (Bollen, 1989). Hence, composite reliability was also estimated from each factor structure [Σ factor loadings]2/[Σ factor loadings]2 + Σ [1 − (factor loading2)]. Mardia's coefficient of multivariate kurtosis was significant for each scale, indicating violations of multivariate normality (Mardia, 1970). The univariate kurtosis values (Table I) indicated that violations of multivariate normality should have minimal effect on model estimates (Kline, 2004). Only two items from the enjoyment scale had kurtosis values greater than 2.0 (“it's no fun at all” and “it's not at all interesting”).
Table I.
Scale means, standard deviations (SD), reliabilities, item kurtosis values, and Mardia's coefficient of multivariate kurtosis
| Sixth grade (N = 2818) |
Eighth grade (N = 3960) |
|||||||||||||
|---|---|---|---|---|---|---|---|---|---|---|---|---|---|---|
| Scale (items) | N | Mean | SD | α (cr) | Item Kurtosis | Mardia (z) | n | Mean | SD | α (cr) | Kurtosis | Mardia (z) | ES | p |
| Self-Efficacy (1–8) | 2673 | 3.74 | 0.79 | .809 (.816) | −1.054 to 0.651 | 18.92 (38.67) | 3830 | 3.67 | 0.80 | .830 (.836) | −1.036 to 0.747 | 19.036 (45.57) | −0.09 | <.001 |
| Self-Management | 10.632 (21.59) | 14.349 (34.96) | ||||||||||||
| Cognitive (1,2,3) | 2724 | 3.43 | 0.93 | .657 (.659) | −0.797 to −0.675 | 3866 | 3.44 | 0.89 | .695 (.700) | −0.593 to −0.417 | 0.01 | 0.598 | ||
| Behavioral (4,5,6) | 2737 | 3.24 | 0.97 | .712 (.717) | −0.903 to −0.720 | 3906 | 3.03 | 0.94 | .736 (.741) | −0.789 to −0.609 | −0.21 | <.001 | ||
| Enjoyment (1–6) | 2730 | 1.67 | 0.82 | .862 (.868) | 0.261 to 3.883 | 49.313 (131.22) | 3900 | 1.88 | 0.90 | .895 (.899) | −0.625 to 1.259 | 35.109 (111.79) | 0.23 | <.001 |
| O–E Value (1–5) | 2595 | 17.43 | 5.57 | .828 (.836) | −1.155 to 0.048 | 25.036 (44.75) | 3846 | 17.22 | 5.43 | .834 (.840) | −0.941 to −0.152 | 26.517 (58.05) | −0.04 | 0.397 |
| Perceived Barriers | 2621 | 2.05 | 0.66 | .776 (.930) | 31.426 (57.17) | 3813 | 2.10 | 0.65 | .781 (.898) | 28.606 (62.767) | 0.08 | 0.145 | ||
| Obstacles (1,3,6) | 2729 | 2.30 | 0.78 | .500 (.500) | −0.366 to.207 | 3900 | 2.44 | 0.78 | .529 (.525) | −0.602 to −0.147 | 0.18 | <.001 | ||
| Social Evaluation (2,4,8) | 2713 | 1.76 | 0.77 | .615 (.615) | 0.418 to 1.693 | 3879 | 1.78 | 0.74 | .613 (.615) | −0.035 to 1.764 | 0.03 | 0.187 | ||
| Outcomes (5,7,9) | 2717 | 2.11 | 0.89 | .648 (.665) | −0.316 to 0.265 | 3886 | 2.09 | 0.91 | .708 (.719) | −0.391 to 0.413 | 0.02 | 0.033 | ||
| Social Support | 13.650 (30.61) | 15.877 (43.911) | ||||||||||||
| Friends (1,2,3) | 2614 | 3.10 | 0.97 | .748 (.747) | −0.756 to −0.274 | 3903 | 2.85 | 0.98 | .796 (.795) | −0.411 to 0.724 | −0.25 | <.001 | ||
| Family (4,5,6,7) | 2576 | 3.41 | 0.93 | .808 (.812) | −0.509 to −0.346 | 3884 | 3.15 | 1.02 | .856 (.860) | −0.732 to −0.569 | −0.27 | <.001 | ||
Internal consistency calculated as Cronbach α reliability; c.r. = composite reliability; Mardia = Mardia's coeffient of multivariate kurtosis (z); ES = effect size (SD) for comparison between sixth and eighth grade girls; p = significance of paired samples t-test comparing mean score between sixth and eighth grades in the longitudinal cohort (n = 1717–1819); O-E = outcome-expectancy.
Final factor models were adjusted for nesting effects of girls within schools and schools within sites by using the within-subjects covariance matrix centered on school means and correcting the standard errors of the adjusted parameter estimates for between-site variance using the Huber-White sandwich estimator (Muthén & Muthén, 1998-2008). In models M4–M5 for the multi-group and longitudinal invariance analyses, standard errors were corrected for between-school variance.
Analysis and fit
The root mean square error of approximation (RMSEA), standardized root mean square residual (SRMR), non-normed fit index (NNFI), comparative fit index (CFI) and the chi-square (χ2) statistic were used to evaluate and compare model fit. The χ2 statistic was used to assess absolute fit of the model to the data. This statistic is very sensitive to sample size and suggests rejection of the hypothesized model in most cases (Bollen, 1989). For this reason, it is reported but is not used alone to draw specific conclusions about model fit (Hu & Bentler, 1999). The RMSEA is a standardized estimate that represents closeness of fit of population data to the model and is widely considered one of the most informative fit criteria (Vandenberg & Lance, 2000). Values of the RMSEA ≤0.06 and ≤0.08 reflect close and acceptable fit of the model. (Browne & Cudeck, 1989; Hu & Bentler, 1999) The 90% confidence interval (CI) for the RMSEA is also presented. The SRMR represents the average error between the observed and specified covariances. The CFI and NNFI test the proportionate improvement in fit by comparing the target model to a baseline model (Bentler & Bonett, 1980). Unlike the CFI, the NNFI is affected by model parsimony (more complex models are penalized). Values for the CFI and NNFI around 0.90 are considered acceptable while values ≥0.95 indicate good fit (Bentler & Bonett, 1980; Hu & Bentler, 1999). Concurrent values ≥0.96 for CFI and ≤0.08 for SRMR provide optimal protection against type I and type II error rates, especially in sample sizes ≤250 (Hu and Bentler, 1999). Although factors such as the number of indicators and non-normal distributions affect statistical power, the available sample size was adequate for model tests in the overall sample and for sub-group analyses according to condition (Kaplan & George, 1993).
Nested models were compared based on χ2 difference tests and changes in the values of the CFI, RMSEA, NNFI, and SRMR (Vandenberg & Lance, 2000). Although χ2 difference tests were conducted and reported, their utility is limited because of the large samples used in this analysis. Examining differences in the RMSEA, CFI, and NNFI has been found to be superior to interpretations based strictly on χ2 difference tests (Cheung & Rensvold, 2002). The main criterion used to judge significant model differences was a change in CFI of > .01 between nested models (Cheung & Rensvold, 2002). Overlap in the RMSEA point estimates and 90% CIs between two nested models was also used to judge meaningful change in fit between models.
Models
The factor validity of each scale was examined first by fitting the hypothesized model to the data using CFA. Based on the TAAG pilot study, the measures of self-efficacy for overcoming barriers to physical activity, enjoyment of physical activity, outcome-expectancy value, and perceived barriers were hypothesized to represent single latent factors. Self-management strategies and social support were hypothesized to each include two correlated factors. The social support items indicated family and friend support. The self-management items indicated cognitive and behavioral strategies.
If the hypothesized model was not supported, modification indices, standardized residuals, squared multiple correlations, covariances between items, and exploratory techniques were examined in a random hold out sample (n = 500) to determine if misfit was a function of a problem item or the hypothesized factor structure (Anderson & Gerbing, 1988). The revised model was then tested in the full sample. After establishing a good fitting model, the multi-group and longitudinal factor invariance for each scale was examined. The primary analyses involved testing the factor invariance across White, Black, and Hispanic/Latino girls within each grade level (sixth and eighth) and testing the longitudinal invariance in the sample of girls that completed the questionnaires in both sixth and eighth grade. Secondary analyses were conducted to determine whether the instruments were invariant across age within each grade level (sixth grade: 11–11.5,11.5–12, 12–12.5 years; eighth grade: 13–13.5, 13.5–14, 14–14.5, 14.5–15 years) and across BMI categories (< 85th, 85th to 95th, and > 95th percentile) using sex-specific BMI-for-age growth charts published by the Centers for Disease Control and Prevention (Kuczmarski et al., 2002). Invariance was also tested between girls from the intervention (n = 2021) and control (n = 1935) schools in the eighth grade to determine whether exposure to the TAAG intervention affected the measurement equivalence of the scales. The longitudinal invariance analysis included the multi-group comparison between girls in the control (n = 949) and intervention (n = 944) schools to determine whether the measurement equivalence across time was altered by exposure to the intervention.
Factor invariance for each scale was examined by testing and comparing a series of nested models using standard procedures (Vandenberg & Lance, 2000). The first step was to fit the model for a given instrument to the data from each group separately (e.g. White, Black, and Hispanic/Latina for the race analysis). This allowed the adequacy of the model to be assessed within each group prior to the multi-group invariance analysis. Sample sizes were too small (e.g., <200) to estimate stable parameters for other racial groups (Comrey & Lee, 1992; Kaplan & George, 1993). The invariance analysis involved testing and comparing five models. Each successive model (M1 to M5) included previous model restrictions (i.e., M3 included restrictions from M2) plus additional constraints, resulting in a series of nested models, Model 1 (M1) tested the equivalence of the hypothesized pattern of paths, factor variances, item means, and item errors across groups. In this model, all hypothesized parameters were freely estimated in the groups. Model 2 (M2) had restricted paths from the factor(s) to the observed items (factor loadings). In model 3 (M3), the factor variance and covariance were added to those being held invariant. Model 4 constrained item intercepts (means) to be equal, while in model 5 (M5) the item uniquenesses (errors) were constrained across groups. When model fit is compared across gradually more restrictive models (more parameters constrained to be equal across groups) it can be determined if model fit is affected by constraining sets of parameters to be equal across groups. Item errors reflect random variance or systematic variance otherwise not explained by the factor model. Testing the equivalence of item means and errors is very restrictive, and equivalence of factor structure (configural invariance) and loadings (metric invariance) is conventionally considered a sufficient criterion for concluding factorial invariance across groups (Vandenberg & Lance, 2000).
The general model used to test longitudinal invariance of each instrument was a two-wave (time 1 and 2) single factor model which includes auto-correlated errors (Pitts, West, & Tein. 1996). The measurement error terms (item uniquenesses) are allowed to co-vary because some of the systematic variance unaccounted for by the latent factor should be the same over time. Comparisons of successive, nested models M1–M5 tested the stationarity of the scales (i.e., are measurement properties of the scales equivalent across time?). The stability (do participants remain in the same rank order over time?) was also assessed. The stability coefficient is estimated as the correlation between factor scores at two time points.
Results
General Descriptives
Scale means, standard deviations, reliabilities, and kurtosis values are shown in Table I. The internal consistency reliabilities ranged from 0.50 to 0.90. Most were above 0.70. Values for the perceived barriers subscales were lower (0.50–0.71), but the reliability of the second-order barriers factor was ≥0.90 in both sixth and eighth grade samples. The difference in mean scores between sixth and eighth grade girls was not significant for outcome-expectancy value, the cognitive self-management subscale, and the social evaluation and outcomes factors of the perceived barriers scale. All other mean scale scores were significantly worse for eighth compared to sixth grade girls. The effect size estimates (Cohen's d) were generally small with values around 0.20 SD for the scales having significant mean differences. The scales each had equivalent measurement properties between eighth grade girls in the intervention and control schools (i.e., ΔCFI ≤ 0.01 across nested models M1–M5). Results of the CFA were not substantively different (i.e., fit remained good or acceptable and results of difference tests of nested models were unchanged) after adjustment for the nesting effects of sites and schools, so unadjusted results are presented unless otherwise noted.
Factor Validity and Invariance
The results for each scale are presented separately. Fit of the models in White, Black, Hispanic/Latino, and Asian girls is presented in the text. For each scale, invariance was assessed at each grade (Table II) and across race at each grade (Table III). Asian girls were excluded because of small samples in sixth (n = 104) and eighth (n = 181) grades. Invariance was also tested across age within each grade level and across BMI categories (Table IV). Longitudinal invariance analysis comparing girls in the control and intervention schools is presented in Table V. To conserve space, the fit of all models used in the invariance analyses is not presented. Tables contain the fit of the base model (all parameters free; M1) and the most constrained model judged to be invariant for each analysis (e.g., if factor loadings were invariant but not the factor variance, M2 would be presented). Configural (i.e., factor structure) and metric (i.e., factor loadings) invariance was supported in all multi-group and longitudinal analyses. Factor variances/covariances were also found to be invariant for each scale except enjoyment among sixth grade girls. Although χ2 difference tests comparing the nested models were frequently significant, the median decrease in CFI across the invariant models was only 0.004. In addition, values of RMSEA were very similar across models for a given scale. The median difference between the most constrained model judged to be invariant and the next model (in most cases M3 vs M4) was 0.025.
Table II.
Model fit for girls in sixth and eighth grades
| Scale/Sample | χ2 | df | p-value | NNFI | CFI | RMSEA (90% CI) | SRMR |
|---|---|---|---|---|---|---|---|
| Self-efficacy | |||||||
| Sixth grade n = 2804 | 131.209 | 20 | <.001 | 0.971 | 0.979 | 0.045 (0.037−0.052) | 0.022 |
| Eighth grade n = 3956 | 104.049 | 20 | <.001 | 0.987 | 0.991 | 0.033 (0.027−0.039) | 0.015 |
| Self-management strategies | |||||||
| Sixth grade n = 2804 | 36.953 | 8 | <.001 | 0.987 | 0.993 | 0.036 (0.025−0.048) | 0.013 |
| Eighth grade n = 3956 | 104.276 | 8 | <.001 | 0.973 | 0.986 | 0.055 (0.046−0.065) | 0.017 |
| Enjoyment | |||||||
| Sixth grade n = 2811 | 79.672 | 9 | <.001 | 0.983 | 0.990 | 0.053 (0.043−0.064) | 0.016 |
| Eighth grade n = 3956 | 270.837 | 9 | <.001 | 0.967 | 0.980 | 0.086 (0.077−0.095) | 0.021 |
| Perceived Barriers | |||||||
| Sixth grade n = 2797 | 187.377 | 24 | <.001 | 0.945 | 0.963 | 0.049 (0.043−0.056) | 0.027 |
| Eighth-grade n = 3950 | 372.923 | 24 | <.001 | 0.925 | 0.950 | 0.061 (0.055−0.066) | 0.033 |
| O-E Value | |||||||
| Sixth grade n = 2741 | 35.695 | 5 | <.001 | 0.988 | 0.994 | 0.047 (0.033−0.062) | 0.014 |
| Eighth-grade n = 3926 | 66.907 | 5 | <.001 | 0.984 | 0.992 | 0.056 (0.045−0.069) | 0.015 |
| Social support | |||||||
| Sixth grade n = 2669 | 261.607 | 13 | <.001 | 0.937 | 0.961 | 0.085 (0.076−0.094) | 0.039 |
| Eighth-grade n = 3934 | 273.865 | 13 | <.001 | 0.967 | 0.979 | 0.071 (0.064−0.079) | 0.029 |
χ2 = chi-square test statistic, df = degrees of freedom, p-value = probability value, NNFI = non-normed fit index (i.e., Tucker–Lewis index), CFI = comparative fit index, RSMEA = root mean square error of approximation, SRMR = standardized root mean square residual.
Table III.
Model fit and invariance across Black, White, and Hispanic/Latino girls
| Scale/Grade | Model | χ2 | df | NNFI | CFI | RMSEA (90% CI) | SRMR |
|---|---|---|---|---|---|---|---|
| Self-efficacy sixth | M1 | 149.363 | 58 | 0.971 | 0.980 | 0.044 (0.035−0.052) | 0.025 |
| M3 | 200.440 | 74 | 0.969 | 0.972 | 0.046 (0.038−0.053) | 0.057 | |
| Self-efficacy eighth | M1 | 163.937 | 58 | 0.977 | 0.987 | 0.038 (0.031−0.045) | 0.020 |
| M3 | 205.418 | 74 | 0.981 | 0.984 | 0.039 (0.033−0.045) | 0.057 | |
| SM Strategies sixth | M1 | 60.721 | 24 | 0.982 | 0.990 | 0.043 (0.030−0.057) | 0.018 |
| M3 | 81.063 | 38 | 0.986 | 0.989 | 0.037 (0.026−0.048) | 0.036 | |
| SM Strategies eighth | M1 | 125.726 | 24 | 0.968 | 0.983 | 0.060 (0.050−0.071) | 0.022 |
| M3 | 158.438 | 38 | 0.976 | 0.980 | 0.052 (0.044−0.061) | 0.050 | |
| Enjoyment sixth | M1 | 123.209 | 27 | 0.974 | 0.984 | 0.066 (0.054−0.078) | 0.022 |
| M2 | 172.083 | 37 | 0.973 | 0.978 | 0.066 (0.057−0.077) | 0.042 | |
| Enjoyment eighth | M1 | 278.937 | 27 | 0.965 | 0.979 | 0.089 (0.080−0.099) | 0.022 |
| M4 | 372.125 | 51 | 0.976 | 0.973 | 0.073 (0.066−0.080) | 0.045 | |
| Barriers sixth | M1 | 231.110 | 72 | 0.939 | 0.960 | 0.052 (0.044−0.059) | 0.032 |
| M3 | 282.724 | 94 | 0.945 | 0.952 | 0.049 (0.043−0.056) | 0.042 | |
| Barriers eighth | M1 | 423.394 | 72 | 0.917 | 0.945 | 0.065 (0.059−0.071) | 0.037 |
| M3 | 482.139 | 94 | 0.930 | 0.939 | 0.059 (0.054−0.065) | 0.045 | |
| O-E Value sixth | M1 | 64.977 | 15 | 0.978 | 0.989 | 0.064 (0.049−0.081) | 0.018 |
| M4 | 104.493 | 35 | 0.987 | 0.985 | 0.050 (0.039−0.061) | 0.051 | |
| O−E Value eighth | M1 | 84.021 | 15 | 0.980 | 0.990 | 0.063 (0.050−0.076) | 0.017 |
| M4 | 95.652 | 35 | 0.981 | 0.984 | 0.056 (0.043−0.069) | 0.046 | |
| Social Support sixth | M1 | 257.430 | 39 | 0.936 | 0.960 | 0.085 (0.075−0.095) | 0.040 |
| M3 | 285.039 | 55 | 0.952 | 0.958 | 0.073 (0.065−0.082) | 0.063 | |
| Social Support eighth | M1 | 285.806 | 39 | 0.965 | 0.978 | 0.074 (0.066−0.082) | 0.031 |
| M3 | 333.329 | 55 | 0.972 | 0.976 | 0.066 (0.059−0.073) | 0.042 |
χ2 = chi-square test statistic, df = degrees of freedom, NNFI = non-normed fit index (i.e., Tucker–Lewis index), CFI = comparative fit index, RSMEA = root mean square error of approximation, CI = confidence interval. SRMR = standardized root mean square residual, M1–M4 = nested models 1 through 4 are described in the text.
Table IV.
Model invariance for age within grade level and BMI (body mass index)
| Age |
BMI |
|||||||||||||
|---|---|---|---|---|---|---|---|---|---|---|---|---|---|---|
| Scale/Grade | Model | χ2 | df | NNFI | CFI | RMSEA (90% CI) | SRMR | Model | χ2 | df | NNFI | CFI | RMSEA (90% CI) | SRMR |
| Self-efficacy sixth | M1 | 166.313 | 60 | 0.952 | 0.966 | 0.056 (0.046–0.066) | 0.033 | M1 | 131.579 | 60 | 0.971 | 0.979 | 0.044 (0.033–0.054) | 0.026 |
| M5 | 252.974 | 108 | 0.964 | 0.956 | 0.049 (0.041–0.056) | 0.067 | M5 | 209.085 | 108 | 0.977 | 0.971 | 0.039 (0.031–0.046) | 0.072 | |
| Self-efficacy eighth | M1 | 190.973 | 80 | 0.982 | 0.987 | 0.039 (0.032–0.046) | 0.021 | M1 | 164.292 | 60 | 0.984 | 0.988 | 0.037 (0.030–0.043) | 0.019 |
| M5 | 266.030 | 152 | 0.990 | 0.987 | 0.029 (0.023–0.034) | 0.051 | M5 | 308.623 | 108 | 0.983 | 0.978 | 0.038 (0.033–0.043) | 0.054 | |
| SM Strategies sixth | M1 | 35.730 | 24 | 0.991 | 0.995 | 0.029 (0.000–0.048) | 0.017 | M1 | 38.002 | 24 | 0.990 | 0.995 | 0.030 (0.008–0.048) | 0.017 |
| M5 | 62.344 | 62 | 1.000 | 1.000 | 0.003 (0.000–0.026) | 0.037 | M5 | 87.434 | 62 | 0.993 | 0.991 | 0.026 (0.011–0.037) | 0.049 | |
| SM Strategies eighth | M1 | 127.603 | 32 | 0.972 | 0.985 | 0.057 (0.047–0.067) | 0.020 | M1 | 128.738 | 24 | 0.971 | 0.984 | 0.058 (0.048–0.068) | 0.020 |
| M5 | 198.476 | 89 | 0.988 | 0.983 | 0.037 (0.030–0.043) | 0.049 | M5 | 185.816 | 62 | 0.987 | 0.981 | 0.039 (0.033–0.046) | 0.046 | |
| Enjoyment sixth | M1 | 143.618 | 27 | 0.954 | 0.972 | 0.087 (0.073–0.101) | 0.028 | M1 | 121.179 | 27 | 0.967 | 0.980 | 0.074 (0.061–0.088) | 0.023 |
| M5 | 204.597 | 63 | 0.976 | 0.966 | 0.063 (0.053–0.073) | 0.044 | M4 | 195.382 | 51 | 0.973 | 0.970 | 0.057 (0.057–0.077) | 0.063 | |
| Enjoyment eighth | M1 | 277.169 | 36 | 0.968 | 0.981 | 0.085 (0.076–0.095) | 0.021 | M1 | 291.222 | 27 | 0.966 | 0.980 | 0.087 (0.078–0.096) | 0.021 |
| M5 | 365.509 | 90 | 0.985 | 0.978 | 0.058 (0.052–0.064) | 0.037 | M5 | 431.205 | 63 | 0.980 | 0.972 | 0.067 (0.061–0.073) | 0.047 | |
| Barriers sixth | M1 | 231.159 | 72 | 0.917 | 0.945 | 0.062 (0.054–0.072) | 0.039 | M1 | 220.624 | 72 | 0.926 | 0.951 | 0.057 (0.049–0.066) | 0.035 |
| M3 | 272.291 | 94 | 0.929 | 0.938 | 0.058 (0.050–0.066) | 0.047 | M3 | 246.469 | 94 | 0.942 | 0.949 | 0.051 (0.043–0.059) | 0.040 | |
| Barriers eighth | M1 | 427.245 | 96 | 0.924 | 0.949 | 0.061 (0.055–0.067) | 0.036 | M1 | 444.834 | 72 | 0.918 | 0.945 | 0.063 (0.058–0.069) | 0.036 |
| M5 | 573.795 | 183 | 0.940 | 0.953 | 0.048 (0.044–0.053) | 0.045 | M3 | 508.094 | 94 | 0.930 | 0.939 | 0.058 (0.053–0.063) | 0.044 | |
| O-E Value sixth | M1 | 42.388 | 15 | 0.983 | 0.991 | 0.057 (0.037–0.078) | 0.020 | M1 | 43.435 | 15 | 0.983 | 0.992 | 0.055 (0.037–0.075) | 0.018 |
| M5 | 72.428 | 45 | 0.994 | 0.991 | 0.033 (0.018–0.047) | 0.040 | M3 | 65.039 | 25 | 0.986 | 0.988 | 0.051 (0.036–0.066) | 0.076 | |
| O-E Value eighth | M1 | 86.399 | 20 | 0.981 | 0.991 | 0.060 (0.048–0.074) | 0.018 | M1 | 77.019 | 15 | 0.984 | 0.992 | 0.057 (0.045–0.070) | 0.016 |
| M5 | 147.563 | 65 | 0.993 | 0.988 | 0.037 (0.029–0.045) | 0.046 | M3 | 106.153 | 25 | 0.987 | 0.989 | 0.050 (0.041–0.060) | 0.038 | |
| Social Support sixth | M1 | 215.492 | 39 | 0.924 | 0.953 | 0.091 (0.081–0.099) | 0.044 | M1 | 233.206 | 39 | 0.922 | 0.952 | 0.091 (0.080–0.100) | 0.045 |
| M5 | 259.643 | 83 | 0.964 | 0.953 | 0.063 (0.054–0.071) | 0.064 | M5 | 317.771 | 83 | 0.956 | 0.942 | 0.069 (0.061–0.077) | 0.082 | |
| Social Support eighth | M1 | 334.369 | 52 | 0.961 | 0.976 | 0.077 (0.069–0.085) | 0.032 | M1 | 294.163 | 39 | 0.967 | 0.980 | 0.071 (0.064–0.079) | 0.030 |
| M5 | 433.005 | 118 | 0.981 | 0.973 | 0.054 (0.049–0.059) | 0.059 | M5 | 439.478 | 83 | 0.978 | 0.971 | 0.058 (0.053–0.063) | 0.057 | |
Table V.
Fit for models used to assess longitudinal invariance for each scale between control (n = 949) and intervention (n = 944) groups
| Scale | Model | χ2 | df | NNFI | CFI | RMSEA (90% CI) | SRMR |
|---|---|---|---|---|---|---|---|
| Self-efficacy | M1 | 343.555 | 190 | 0.977 | 0.982 | 0.029 (0.024–0.034) | 0.027 |
| M2 | 360.936 | 211 | 0.980 | 0.982 | 0.027 (0.023–0.032) | 0.032 | |
| M3 | 362.774 | 213 | 0.980 | 0.982 | 0.027 (0.022–0.032) | 0.033 | |
| M4 | 457.823 | 237 | 0.974 | 0.974 | 0.031 (0.027–0.036) | 0.037 | |
| M5 | 562.573 | 261 | 0.968 | 0.965 | 0.035 (0.031–0.039) | 0.047 | |
| SM Strategies | M1 | 218.447 | 88 | 0.971 | 0.981 | 0.040 (0.033–0.046) | 0.022 |
| M2 | 237.956 | 100 | 0.973 | 0.979 | 0.038 (0.032–0.044) | 0.028 | |
| M3 | 240.817 | 112 | 0.977 | 0.981 | 0.035 (0.029–0.041) | 0.030 | |
| Enjoyment | M1 | 349.824 | 94 | 0.969 | 0.978 | 0.054 (0.048–0.060) | 0.027 |
| M2 | 370.103 | 109 | 0.973 | 0.978 | 0.050 (0.045–0.056) | 0.031 | |
| M3 | 396.048 | 112 | 0.971 | 0.976 | 0.052 (0.046–0.057) | 0.050 | |
| M4 | 472.780 | 130 | 0.970 | 0.971 | 0.053 (0.048–0.058) | 0.048 | |
| M5 | 570.090 | 148 | 0.968 | 0.964 | 0.055 (0.050–0.060) | 0.052 | |
| Barriers | M1 | 662.576 | 238 | 0.925 | 0.942 | 0.043 (0.040–0.047) | 0.037 |
| M2 | 709.377 | 262 | 0.928 | 0.939 | 0.042 (0.039–0.046) | 0.041 | |
| M3 | 727.119 | 271 | 0.929 | 0.937 | 0.042 (0.038–0.046) | 0.042 | |
| O-E Value | M1 | 115.217 | 58 | 0.988 | 0.992 | 0.032 (0.024–0.041) | 0.020 |
| M2 | 128.278 | 70 | 0.990 | 0.992 | 0.030 (0.021–0.038) | 0.025 | |
| M3 | 130.883 | 73 | 0.990 | 0.992 | 0.029 (0.021–0.037) | 0.029 | |
| M4 | 220.544 | 88 | 0.981 | 0.982 | 0.040 (0.033–0.047) | 0.036 | |
| M5 | 264.110 | 103 | 0.980 | 0.978 | 0.041 (0.035–0.047) | 0.044 | |
| Social Support | M1 | 423.307 | 128 | 0.962 | 0.974 | 0.049 (0.045–0.055) | 0.034 |
| M2 | 445.099 | 143 | 0.966 | 0.973 | 0.047 (0.042–0.052) | 0.036 | |
| M3 | 487.591 | 155 | 0.965 | 0.970 | 0.048 (0.043–0.053) | 0.056 |
χ2 = chi-square test statistic, df = degrees of freedom, NNFI = non-normed fit index (i.e., Tucker–Lewis index), CFI = comparative fit index, RSMEA = root mean square error of approximation, SRMR = standardized root mean square residual, CI = confidence interval. M1–M5 = nested models 1 through 5 are described in the text.
Self-efficacy
The hypothesized 8-item single factor model provided good fit to the data for both sixth and eighth grade girls (see Table II). The fit of the model for white (sixth: CFI = 0.986, NNFI = 0.980, RMSEA = 0.037, SRMR =0.020; eighth: CFI = 0.986, NNFI = 0.980, RMSEA =0.040, SRMR = 0.018), Black (sixth: CFI = 0.950, NNFI = 0.930, RMSEA = 0.061, SRMR = 0.035; eighth: CFI = 0.991, NNFI = 0.988 RMSEA = 0.029, SRMR =0.019), and Hispanic/Latina (sixth: CFI = 0.996, NNFI =0.994, RMSEA = 0.020, SRMR = 0.019); eighth: CFI =0.980, NNFI = 0.986, RMSEA = 0.043, SRMR = 0.022) girls was also good. Fit was acceptable among Asian girls (CFI > 0.95, NNFI > 0.94, RMSEA < 0.07, SRMR ≤ 0.05). Factor structure (configural), loadings (metric), and factor variance were invariant across race/ethnicity groups in sixth and eighth grades. In addition, item means (scalar) and errors (uniquenesses) were invariant across age groups within grade, BMI levels, and across time between sixth and eighth grades. The stability coefficient (SE) was 0.40 (.024), p < .001.
Self-management
The eight item self-management scale was designed to assess both cognitive and behavioral strategies. The hypothesized two–factor correlated model had acceptable fit for the sixth grade girls (CFI = 0.957, NNFI = 0.919, RMSEA = 0.067), but poor fit for the eighth grade girls (CFI = 0.926, NNFI = 0.860, RMSEA = 0.102). An exploratory analysis revealed a large covariance between items 2 (“I think about the benefits I will get from being physically active”) and 3 (“I try to think more about the benefits of physical activity and less about the hassles of being active”). Because of the similar content and the complex nature of item 3, it was removed from the model. In addition, item 1 (“I do things to make physical activity more enjoyable”) is conceptualized as a behavioral strategy, but cross-loaded significantly with several of the cognitive strategy items and was also removed. The final model contained two correlated factors indicated by three items each. The fit of this model was good for girls in the sixth and eighth grade (Table II). The correlation between the cognitive and behavior factors was 0.87 in both sixth and eighth grade girls. The fit for white, black, and Hispanic/Latino girls was also good in each grade (CFI > 0.97, NNFI > 0.95, RMSEA < 0.06, SRMR < 0.03). Fit was acceptable among Asian girls (CFI > 0.95, NNFI > 0.91, RMSEA < 0.09, SRMR < 0.05). Factor structure, loadings, and factor variances/covariances were invariant across race/ethnicity groups in sixth and eighth grades and across time between sixth and eighth grades. In addition, item means and errors were invariant across age groups within grade and BMI levels. The stability coefficient (SE) was 0.41 (.030) for the cognitive factor and 0.44 (.026) for the behavioral factor, p < .001.
Enjoyment
The enjoyment scale was composed of seven negatively worded items from a modified version of the PACES. Preliminary analysis of item kurtosis suggested that item 4 (“When I am active it makes me depressed”) should be dropped. It had a large kurtosis value (5.622) and more than 76% of girls “Disagree a lot” with the item. The single factor model for the six-item scale fit well for both sixth and eighth grade girls (Table II). Although the fit was adequate or good for each of those models in the groups of black, white and Hispanic/Latino girls (CFI > 0.95, NNFI > 0.920, SRMR < 0.040), the RMSEA suggested some degree of misfit for Hispanic/Latino girls in the sixth (RMSEA = 0.110) and black girls in the eighth grade (RMSEA = 0.108). Adjustment for between-school variation improved fit in each of those groups (RMSEA < 0.07). Results were similar for Asian girls in both sixth and eighth grades (CFI > 0.95, NNFI > 0.920, SRMR < 0.04, RMSEA = 0.130 and 0.102), but RMSEA was <0.08 after adjustment for school. Configural and metric invariance was supported across race in both sixth and eighth grade girls. Factor variance was not equivalent in the sixth grade, but adjustment for between-school variation improved fit of model 3 (CFI = 0.974, NNFI = 0.970, RMSEA = 0.047, SRMR = 0.08) without influencing models 1 and 2. Item means were equivalent across race in the eighth grade. Item means and errors were also invariant across time between the sixth and eighth grades, age groups within grade, and BMI levels, excepting non-equivalent item errors across BMI levels in the sixth grade. The stability coefficient (SE) was 0.30 (.024), p < .001.
Perceived barriers
The hypothesized single factor model of the perceived barriers scale did not adequately fit the data for sixth (CFI = 0.922, NNFI = 0.877, RMSEA = 0.065) or eighth (CFI = 0.893, NNFI = 0.832, RMSEA = 0.082) grade girls. Exploratory analyses revealed that several items having similar content had large covariance values. The items related to obstacles (bad weather, don’t have time, time away from friends), social evaluation (“I don’t know how …”, “… would make me embarrassed”, “I’m chosen last …”), and outcomes (“… don’t like to sweat”, “… get hurt or sore”, “… would make me tired”) tended to load together. Item 1 (“physical activity is boring”) was then excluded because of content. Based on this exploratory analysis, a model of three correlated first-order factors (r = 0.59–0.78) subordinate to a second order factor model was developed that had good fit in sixth and eighth grade girls (Table II). This revised model fit acceptably for Black, White, and Hispanic/Latino girls in each grade (CFI > 0.94, NNFI > 0.91, RMSEA < 0.08, SRMR ≤ 0.04). Fit was similar among Asian girls in the sixth grade (CFI = 0.935, NNFI = 0.902, RMSEA = 0.066, SRMR = 0.057) but not the eighth grade.
Factor structure, factor loadings, and factor variance were equivalent across groups according to race/ethnicity, age within grade, and BMI and across time between the sixth and eighth grades. In addition, item means and errors were equivalent across age groups within the eighth grade. The stability coefficients (SE) were 0.43 (.027), p < .001, for the second order barriers factor and 0.654 (.458), p > .05, 0.33 (.098), p < .001, and 0.352 (.027), p < .001, for the obstacles, social-evaluation, and outcomes subscales, respectively.
Outcome-expectancy value
This scale represents the products of ratings of outcome- expectancy beliefs and the associated value of each belief. The single factor model including all nine items did not fit well for sixth (CFI = 0.920, NNFI = 0.867, RMSEA = 0.114) or eighth (CFI = 0.907, NNFI = 0.845, RMSEA = 0.132) grade girls. An exploratory analysis revealed several large covariance values among similarly worded items. Correlated uniquenesses have been used previously with this scale to account for the covariance among these items (Dishman, Motl, Sallis, et al., 2005). Simply including correlated error terms will always improve model fit, but highly related items within a scale suggest redundancy in item content or a scale that is multidimensional. Because the scale was hypothesized to assess a single latent factor, a revised model of the outcome-expectancy value scale was considered. It included five of the original items (1,3,4,5,9). The four items eliminated from the scale (“it would help get or keep me in shape”, “it would be fun”, “it would make me look better”, “I would make new friends”) had redundant item content and/or large modification indices. Post hoc regression analysis suggested that very little information was lost by omitting these items. The adjusted R-square predicting total score (nine-item scale) from the five selected items was 0.945. The final revised model fit well for sixth and eighth grade girls (Table II). The fit for black (sixth: CFI = 0.993, NNFI = 0.987, RMSEA = 0.043, SRMR = 0.015; eighth: CFI = 0.996, NNFI = 0.993, RMSEA = 0.036, SRMR = 0.011), white (sixth: CFI = 0.984, NNFI = 0.968, RMSEA = 0.080, SRMR = 0.020; eighth: CFI = 0.993, NNFI = 0.987, RMSEA = 0.052, SRMR = 0.014), and Hispanic/Latina (sixth: CFI = 0.996, NNFI = 0.992, RMSEA = 0.039, SRMR = 0.014; eighth: CFI = 0.978, NNFI = 0.956, RMSEA = 0.098, SRMR = 0.024) girls was also good or acceptable. Fit was similar among Asian girls in the eighth grade (CFI = 0.985, NNFI = 0.969, RMSEA = 0.078, SRMR = 0.026) but not the sixth grade.
Factor structure, factor loadings, and factor variance were invariant across BMI levels in each grade. Item means were also equivalent across race/ethnicity groups in both sixth and eighth grades. In addition, item errors were invariant across age within grade groups and across time between the 6 h and eighth grades. The stability coefficient (SE) was 0.17 (.027), p < .001.
Social support
The social support scale was hypothesized to included two correlated factors representing friend and family support for physical activity. The family factor items 4 (“encouraged you …”) and 5 (“done physical activity … with you”) had a large covariance in the sample of eighth grade girls. Based on this covariance, squared multiple correlations, and several significant modification indices, item 4 was removed. The revised two factor model fit well for both sixth and eighth grade girls (Table II). The model fit acceptably for Black, White, and Hispanic/Latino girls in each grade (CFI > 0.95, NNFI > 0.92, RMSEA ≤ 0.08, SRMR < 0.05). Fit was similar among Asian girls in the eighth grade (CFI = .976, NNFI = .962, RMSEA = .079, SRMR = 0.036) but not the sixth grade. The correlation between friend and family support was 0.66 and 0.67 for sixth and eighth grade girls, respectively. Factor structure, factor loadings, and factor variances/covariances were invariant across race/ethnicity groups in both sixth and eighth grades and across time between the sixth and eighth grades. In addition, item means and errors were equivalent across age groups within each grade and BMI levels. The stability coefficient (SE) was 0.41 (.027) for the friends factor and 0.53 (.021) for the family factor, p < .001.
Discussion
The results confirm the factorial validity and the multi-group and longitudinal invariance (at least equal structure and factor loadings) of revised self-report scales used to measure putative social-cognitive mediators of change in physical activity in a large sample of racially/ethnically diverse middle-school girls from six different regions of the US. The scales are thus suitable for use and further evaluation in studies of White, Black, and Hispanic/Latino girls in the sixth and eighth grades and in studies of long-term change between the sixth and eighth grades.
The revised scales were also invariant (usually including equal item means and errors) between age levels within each grade and across levels of BMI. Hence, the scales provide a technology for assessing cross-sectional differences between 6-month age groups in social-cognitive correlates of physical activity among middle-school girls regardless of their BMI.
The present findings improve upon and extend our earlier findings from the TAAG pilot study (Dishman, Motl, Sallis, et al. 2005) to support valid assessment of self-efficacy, self-management, enjoyment, perceived barriers, and outcome-expectancy value. We provide the initial evidence of factor validity for girls’ self-ratings of the social support scales. Not all the initially hypothesized models based on our prior studies fit adequately in all groups, so re-specified models that appeared theoretically and statistically sound were developed in random hold out samples and then confirmed in all groups of the full sample. Two items were dropped from the original self-management scale (“I do things to make physical activity more enjoyable” and “I try to think more about the benefits of physical activity and less about the hassles of being active”) with no loss of information. The strong correlation between the cognitive and behavioral sub-factors suggest a higher order, single factor structure, so it will be important for future studies to determine whether the two scales yield independent results in observational or intervention studies of physical activity. Study logistics and participant burden led to the decision to use only the negative items from the original enjoyment scale (Motl et al., 2001). The item, “When I am active, it makes me depressed” was dropped because of extreme kurtosis; three of four girls disagreed a lot with the item. Our results suggest that further reduction of the six retained items could occur with little loss of information. The adjusted R2 was 0.94 for predicting a total enjoyment score from four items (“I feel bored”, “I dislike it”, “it's not at all interesting”, “I would rather be doing something else”). Redundant items also were dropped from the measures of perceived barriers (“physical activity is boring”), outcome-expectancy value (“… keep me in shape”, “… be fun”, “… make me look better”, and “… make new friends”) and family support (“encourage me …”) with no loss of information. The perceived barriers sub-scales had low internal consistency, but, the composite reliability for the second-order factor was high. Thus, we suggest that the score be summed score across the nine items.
In earlier studies of black and white high school girls, we found that the barriers self-efficacy scale reported here was invariant across one year (Motl et al., 2000) and three years (Dishman et al., 2008) and mean scores did not change during high school. The present results confirm that scores on the scales obtained as long as 2 years apart can be interpreted as having similar meaning. Other studies using different measures have reported shorter-term change in girls’ and boys’ self-efficacy for physical activity (Duncan, Duncan, Strycker, & Chaumeton, 2007; Edmundson et al., 1996; Garcia et al., 1995; Nader et al., 1999; Neumark-Sztainer, Story, Hannan, & Tharp, 2003). However, those reports did not establish the measurement equivalence/invariance of the questionnaires to insure that the same construct was being measured at each time.
The stability of factor scores between the sixth and eighth grades (i.e., the extent to which girls’ rank order of scores stayed the same across time) was moderate for self-efficacy, self-management strategies, perceived barriers, and social support and was low for enjoyment and outcome-expectancy value. Our pilot testing supported the test-retest reliability of the scales (stability R = 0.64–0.84) across 2 weeks (Dishman, Motl, Sallis, et al., 2005). Thus, the lower 2-year stability of the scales shows a considerable amount of naturally occurring change within the girls, making these social-cognitive variables feasible targets for intervention. Family support was more stable over time than friend support. Previous studies of longitudinal change in other measures of family and friend support among adolescents (e.g., Dowda, Dishman, Pfeiffer, & Pate, 2007; Duncan et al., 2007; Garcia et al., 1995) did not report on the longitudinal invariance or stability of the measures they used. Future study should examine whether the measure of friend support is a proxy measure of the girls’ social network or social incentives for physical activity.
In addition to the evidence presented here supporting the factorial validity and invariance of the measures, there is also evidence for their construct validity. In a randomly selected cohort of TAAG participants, we observed direct and indirect relations among these social-cognitive measures, consistent with self-efficacy theory (Bandura, 1997) and hypotheses about the functional network of self-efficacy with perceived social support, self-management, perceived barriers to physical activity, and an objective measure of physical activity (Dishman et al., 2009).
A strength of the study is the good representation of Black and Hispanic/Latino girls, who have been understudied. However, a weakness is the poor representation of other minority populations. The models tested had acceptable fit among Asian girls for all scales except outcome-expectancy value and social support in the sixth grade and perceived barriers in the eighth grade. However, those results are not trustworthy because of the small samples of Asian girls in sixth (n = 104) and eighth (n = 181) grades. Another weakness of the study is the absence of girl-level measures of socio-economic status, so we cannot conclude that the scales have measurement equivalence/invariance across levels of social capital. Additional research is needed to determine whether socio-economic status moderates social-cognitive influences on girls’ physical activity independently of their race/ethnicity.
We conclude that the scores from these revised scales can provide valid assessments of putative social-cognitive mediators, or possibly moderators, of change in physical activity that can be used in observational studies of naturally occurring change or interventions designed to increase physical activity during early adolescence among girls regardless of BMI, especially those who identify themselves as White, Black, or Hispanic/Latina.
Funding
This study was funded by the following collaborative agreements from the National Heart, Lung and Blood Institute: UO1HL066855 (Tulane University), UO1HL066845 (University of Minnesota), UO1HL066852 (University of South Carolina), UO1HL066853 (University of North Carolina-Chapel Hill), UO1HL066856 (San Diego State University), UO1HL066857 (University of Maryland), UO1HL066858 (University of Arizona).
Conflicts of interest: None declared.
Acknowledgment
The authors thank Grayson Holmbeck and the anonymous referees for their helpful comments that led to an improved report.
Appendix A – Social-Cognitive Measures
References
- Anderson JC, Gerbing DW. Structural equation modeling in practice: A review and recommended two-step approach. Psychological Bulletin. 1988;103:411–423. [Google Scholar]
- Bandura A. Health promotion by social cognitive means. Health Education and Behavior. 2004;31:143–164. doi: 10.1177/1090198104263660. [DOI] [PubMed] [Google Scholar]
- Bandura A. Self-efficacy: The exercise of control. New York, NY: W.H. Freeman and Company; 1997. [Google Scholar]
- Bentler PM, Bonett DG. Significance tests and goodness of fit in the analysis of covariance-structures. Psychological Bulletin. 1980;88:588–606. [Google Scholar]
- Bollen KA. Structural equations with latent variables. New York: John Wiley & Sons, Inc; 1989. [Google Scholar]
- Browne MW, Cudeck R. Single sample cross-validation indices for covariance structures. Multivariate Behavioral Research. 1989;24:445–455. doi: 10.1207/s15327906mbr2404_4. [DOI] [PubMed] [Google Scholar]
- Caspersen CJ, Pereira MA, Curran KM. Changes in physical activity patterns in the United States, by sex and cross-sectional age. Medicine and Science in Sports and Exercise. 2000;32:1601–1609. doi: 10.1097/00005768-200009000-00013. [DOI] [PubMed] [Google Scholar]
- Cheung GW, Rensvold RB. Evaluating goodness-of-fit indexes for testing measurement invariance. Structural Equation Modeling. 2002;9:233–255. [Google Scholar]
- Comrey AL, Lee HB. A First Course in Factor Analysis. 2nd ed. Hillsdale, NJ: Lawrence Erlbaum Associates; 1992. [Google Scholar]
- Dishman RK, Dunn AL, Sallis JF, Vandenberg RJ, Pratt CA. Social-cognitive correlates of physical activity in a multi-ethnic cohort of middle-school girls: two-year prospective study. Journal of Pediatric Psychology. 2009 doi: 10.1093/jpepsy/jsp042. doi:10.1093/jpepsy/jsp042 (in press) [DOI] [PMC free article] [PubMed] [Google Scholar]
- Dishman RK, Motl RW, Sallis JF, Dunn A, Birnbaum AS, Welk G, et al. Self-management strategies mediate the association of self-efficacy with physical activity among sixth and eighth grade adolescent girls. American Journal of Preventive Medicine. 2005;29:10–18. doi: 10.1016/j.amepre.2005.03.012. [DOI] [PMC free article] [PubMed] [Google Scholar]
- Dishman RK, Motl RW, Saunders R, Dowda M, Felton G, Ward DS, et al. Factorial invariance and latent mean structure of questionnaires measuring social-cognitive determinants of physical activity among black and white adolescent girls. Preventive Medicine. 2002;34:100–108. doi: 10.1006/pmed.2001.0959. [DOI] [PubMed] [Google Scholar]
- Dishman RK, Motl RW, Saunders R, Felton G, Ward DS, Dowda M, et al. Enjoyment mediates effects of a school-based physical-activity intervention. Medicine and Science in Sports and Exercise. 2005;37:478–487. doi: 10.1249/01.mss.0000155391.62733.a7. [DOI] [PubMed] [Google Scholar]
- Dishman RK, Motl RW, Saunders R, Felton G, Ward DS, Dowda M, et al. Self-efficacy partially mediates the effect of a school-based physical-activity intervention among adolescent girls. Preventive Medicine. 2004;38:628–636. doi: 10.1016/j.ypmed.2003.12.007. [DOI] [PubMed] [Google Scholar]
- Dishman RK, Saunders RP, Motl RW, Dowda M, Pate RR. Self-efficacy moderates the relation between declines in physical activity and perceived social support in high school girls. Journal of Pediatric Psychology, Dec 1. 2008 doi: 10.1093/jpepsy/jsn100. [Epub ahead of print] PMID: 18812410. [DOI] [PMC free article] [PubMed] [Google Scholar]
- Dowda M, Dishman RK, Pfeiffer KA, Pate RR. Family support for physical activity in girls from eighth to 12th grade in South Carolina. Preventive Medicine. 2007;44:153–159. doi: 10.1016/j.ypmed.2006.10.001. [DOI] [PMC free article] [PubMed] [Google Scholar]
- Duncan SC, Duncan TE, Strycker LA, Chaumeton NR. A cohort-sequential latent growth model of physical activity from ages 12 to 17 years. Annals of Behavioral Medicine. 2007;33:80–89. doi: 10.1207/s15324796abm3301_9. [DOI] [PMC free article] [PubMed] [Google Scholar]
- Edmundson E, Parcel GS, Feldman HA, Elder J, Perry CL, Johnson CC, et al. The effects of the Child and Adolescent Trial for Cardiovascular Health upon psychosocial determinants of diet and physical activity. Preventive Medicine. 1996;25:442–454. doi: 10.1006/pmed.1996.0076. [DOI] [PubMed] [Google Scholar]
- Elder JP, Lytle L, Sallis JF, Young DR, Steckler A, Simons-Morton D, et al. A description of the social-ecological framework used in the trial of activity for adolescent girls (TAAG) Health Education Research. 2007;22:155–165. doi: 10.1093/her/cyl059. [DOI] [PMC free article] [PubMed] [Google Scholar]
- Enders CK, Bandalos DL. The relative performance of full information maximum likelihood estimation for missing data in structural equation models. Structural Equation Modeling. 2001;8:430–457. [PubMed] [Google Scholar]
- Friedman D, Bryant FB, Holmbeck GN. Brief report: testing the factorial invariance of the CBCL Somatic Complaints scale as a measure of internalizing symptoms for children with and without chronic illness. Journal of Pediatric Psychology. 2007;32:512–516. doi: 10.1093/jpepsy/jsl051. [DOI] [PubMed] [Google Scholar]
- Garcia AW, Broda MA, Frenn M, Coviak C, Pender NJ, Ronis DL. Gender and developmental differences in exercise beliefs among youth and prediction of their exercise behavior. Journal of School Health. 1995;65:213–219. doi: 10.1111/j.1746-1561.1995.tb03365.x. [DOI] [PubMed] [Google Scholar]
- Gordon-Larsen P, Adair LS, Popkin BM. Ethnic differences in physical activity and inactivity patterns and overweight status. Obesity Research. 2002;10:141–149. doi: 10.1038/oby.2002.23. [DOI] [PubMed] [Google Scholar]
- Grunbaum JA, Kann L, Kinchen S, Ross J, Hawkins J, Lowry R, et al. Youth risk behavior surveillance — United States, 2003. CDC. Morbidity and Mortality Weekly Report. 2004;53:1–96. [PubMed] [Google Scholar]
- Hu L, Bentler PM. Cutoff criteria for fit indices in covariance structure analysis: Conventional criteria versus new alternatives. Structural Equation Modeling. 1999;6:1–55. [Google Scholar]
- Kaplan D, George R. A study of power associated with testing factor mean differences under violations of factorial invariance structural equation modeling. Structural Equation Modeling. 1993;2:101–118. [Google Scholar]
- Kimm SYS, Glynn NW, Kriska AM, Barton BA, Kronsberg SS, Daniels SR, et al. Decline in physical activity in black girls and white girls during adolescence. New England Journal of Medicine. 2002;347:709–715. doi: 10.1056/NEJMoa003277. [DOI] [PubMed] [Google Scholar]
- Kline RB. Principles and practice of structural equation modeling. 2nd. New York: Guilford; 2004. [Google Scholar]
- Kuczmarski RJ, Ogden CL, Guo SS, Grummer-Strawn LM, Flegal KM, Mei Z, et al. 2000 CDC growth charts for the United States: Methods and development. National Center for Health Statistics. Vital Health Statistics. 2002;11:147–148. [PubMed] [Google Scholar]
- Luban DR, Foster C, Biddle SJH. A review of mediators of behavior in interventions to promote physical activity among children and adolescents. Preventive Medicine. 2008;47:463–470. doi: 10.1016/j.ypmed.2008.07.011. [DOI] [PubMed] [Google Scholar]
- Mardia KV. Measures of multivariate skewness and kurtosis with applications. Biometrika. 1970;57:519–530. [Google Scholar]
- MacKinnon DP, Fairchild AJ, Fritz MS. Mediation analysis. Annual Review of Psychology. 2007;58:593–614. doi: 10.1146/annurev.psych.58.110405.085542. [DOI] [PMC free article] [PubMed] [Google Scholar]
- Messick S. Validity of psychological assessment. Validation of inferences from persons’ responses and performances as scientific inquiry into score meaning. American Psychologist. 1995;50:741–749. [Google Scholar]
- Motl RW, Dishman RK, Saunders R, Dowda M, Felton G, Pate RR. Measuring enjoyment of physical activity in adolescent girls. American Journal of Preventive Medicine. 2001;21:110–117. doi: 10.1016/s0749-3797(01)00326-9. [DOI] [PubMed] [Google Scholar]
- Motl RW, Dishman RK, Trost SG, Saunders R, Dowda M, Felton G, et al. Factorial validity and invariance of questionnaires measuring social-cognitive determinants of physical activity in adolescent girls. Preventive Medicine. 2000;31:584–594. doi: 10.1006/pmed.2000.0735. [DOI] [PubMed] [Google Scholar]
- Muthén LK, Muthén BO. Mplus: Statistical Analysis with Latent Variables. 5.1. Los Angeles: Muthén and Muthén; 1998–2008. [Google Scholar]
- Nader PR, Stone EJ, Lytle L, Perry CL, Osganian SK, Kelder S, et al. Three-year maintenance of improved diet and physical activity, the CATCH cohort. Archives of Pediatric and Adolescent Medicine. 1999;153:695–704. doi: 10.1001/archpedi.153.7.695. [DOI] [PubMed] [Google Scholar]
- Neumark-Sztainer D, Story M, Hannan PJ, Tharp T. Factors associated with changes in physical activity – a cohort study of inactive adolescent girls. Archives of Pediatric and Adolescent Medicine. 2003;157:803–810. doi: 10.1001/archpedi.157.8.803. [DOI] [PubMed] [Google Scholar]
- Pitts SC, West SG, Tein J. Longitudinal measurement models in evaluation research: examining stability and change. Evaluation and Program Planning. 1996;19:333–350. [Google Scholar]
- Saelens BE, Sallis JF, Calfas KJ, Sarkin JA, Caparosa S. Use of self-management strategies in a 2-year cognitive-behavioral intervention to promote physical activity. Behavior Therapy. 2000;31:365–379. [Google Scholar]
- Sallis JF, Taylor WC, Dowda M, Freedson PS, Pate RR. Correlates of vigorous physical activity for children in grades 1 through 12: Comparing parent-reported and objectively measured physical activity. Pediatric Exercise Science. 2002;14:30–44. [Google Scholar]
- Saunders RP, Pate RR, Felton G, Dowda M, Weinrich MC, Ward DS, Parsons MA, Baranowski T. Development of questionnaires to measure psychosocial influences on children's; physical activity. Preventive Medicine. 1997;26:241–247. doi: 10.1006/pmed.1996.0134. [DOI] [PubMed] [Google Scholar]
- Stevens J, Murray DM, Catellier DJ, Hannan PJ, Elder JP, Young DR, et al. Design of the Trial of Activity in Adolescent Girls (TAAG) Contemporary Clinical Trials. 2005;26:223–233. doi: 10.1016/j.cct.2004.12.011. [DOI] [PMC free article] [PubMed] [Google Scholar]
- Strong WB, Malina RM, Blimkie CJ, Daniels SR, Dishman RK, Gutin B, et al. Evidence based physical activity for school-age youth. Journal of Pediatrics. 2005;146:732–737. doi: 10.1016/j.jpeds.2005.01.055. [DOI] [PubMed] [Google Scholar]
- Sulemana H, Smolensky MH, Lai D. Relationship between physical activity and body mass index in adolescents. Medicine and Science in Sports and Exercise. 2006;38:1182–1186. doi: 10.1249/01.mss.0000222847.35004.a5. [DOI] [PubMed] [Google Scholar]
- U.S. Department of Health Human Services. Physical Activity Guidelines Advisory Committee Report. Washington, DC: U.S. Department of Health and Human Services.; 2008. Physical Activity Guidelines Advisory Committee; pp. 499–531. [Google Scholar]
- Vandenberg RJ, Lance CE. A review and synthesis of the management invariance literature: Suggestions, practices, and recommendations for organizational research. Organizational Research Methods. 2000;3:4–69. [Google Scholar]
- Vu MB, Murrie D, Gonzalez V, Jobe JB. Listening to girls and boys talk about girls' physical activity behaviors. Health Education & Behavior. 2006;33:81–96. doi: 10.1177/1090198105282443. [DOI] [PMC free article] [PubMed] [Google Scholar]
- Webber LS, Catellier DJ, Lytle LA, Murray DM, Pratt CA, Young DR, et al. Promoting physical activity in middle school girls: Trial of activity for adolescent girls. American Journal of Preventive Medicine. 2008;34:173–184. doi: 10.1016/j.amepre.2007.11.018. [DOI] [PMC free article] [PubMed] [Google Scholar]