

Abstract
Background
The ability of cancer to infiltrate along nerves is a common clinical observation in pancreas, head and neck, prostate, breast, and gastrointestinal carcinomas. For these tumors, nerves may provide a conduit for local cancer progression into the central nervous system. Although neural invasion is associated with poor outcome, the mechanism that triggers it is unknown.
Methods
We used an in vitro Matrigel dorsal root ganglion and pancreatic cancer cell coculture model to assess the dynamic interactions between nerves and cancer cell migration and the role of glial cell-derived neurotrophic factor (GDNF). An in vivo murine sciatic nerve model was used to study how nerve invasion affects sciatic nerve function.
Results
Nerves induced a polarized neurotrophic migration of cancer cells (PNMCs) along their axons, which was more efficient than in the absence of nerves (migration distance: mean = 187.1 μm, 95% confidence interval [CI] = 148 to 226 μm vs 14.4 μm, 95% CI = 9.58 to 19.22 μm, difference = 143 μm; P < .001; n = 20). PNMC was induced by secretion of GDNF, via phosphorylation of the RET-Ras–mitogen-activated protein kinase pathway. Nerves from mice deficient in GDNF had reduced ability to attract cancer cells (nerve invasion index: wild type vs gdnf+/−, mean = 0.76, 95% CI = 0.75 to 0.77 vs 0.43, 95% CI = 0.42 to 0.44; P < .001; n = 60–66). Tumor specimens excised from patients with neuroinvasive pancreatic carcinoma had higher expression of the GDNF receptors RET and GRFα1 as compared with normal tissue. Finally, systemic therapy with pyrazolopyrimidine-1, a tyrosine kinase inhibitor targeting the RET pathway, suppressed nerve invasion toward the spinal cord and prevented paralysis in mice.
Conclusion
These data provide evidence for paracrine regulation of pancreatic cancer invasion by nerves, which may have important implications for potential therapy directed against nerve invasion by cancer.
CONTEXT AND CAVEATS
Prior knowledge
Several types of tumor cells can move along nerves, but the mechanism for this movement is unknown.
Study design
In vitro and in vivo models were used to examine movement of pancreatic cancer cells along nerves and the role of glial cell-derived neurotrophic factor (GDNF) in this process.
Contribution
The movement of tumor cells along nerves was greater than movement in the absence of nerves. Movement along nerves was mediated by GDNF secretion, and the ability of nerves from GDNF-deficient mice to attract tumor cells was reduced compared with nerves from wild-type mice. Mice treated with an inhibitor of the pathway regulating GDNF expression had reduced nerve invasion. Tumors from patients with pancreatic cancer that had invaded nerves expressed more GDNF receptors than normal tissue.
Implications
Pancreatic cancer invasion along nerves is regulated by a paracrine pathway that involves GDNF. This pathway may be a target for preventing nerve invasion in pancreatic cancer.
Limitations
The generalizability of the findings to human disease is unknown. The in vitro and in vivo models used did not encompass all of the possible interactions between cancer cells and nerves.
From the Editors
The local extension of cancer cells along nerves toward the central nervous system is a frequent clinical finding for a variety of tumors. Neural invasion by cancer occurs in 80% of pancreatic and in up to 30% of head and neck, breast, cervix, or prostate cancer patients (1,2). These patients may develop neurological deficits and unresectable disease by the time of diagnosis.
Nerves secrete chemokines and growth factors that play a role in neural guidance and proliferation (3). Tumor cells may potentially be attracted by a neurotrophic factor gradient to facilitate its local spread into adjacent nerves. A prominent group of proteins secreted by nerves is the glial cell–derived neurotrophic factor (GDNF) family of ligands, which signals through a multicomponent receptor complex involving glycosyl-phosphatidylinositol–anchored GDNF family receptor-α (GFRα) and its cognate receptor RET (4). GDNF is a potent chemoattractant that has been implicated in development and migration of nerves and epithelial cells (5–7). GDNF can activate its tyrosine kinase receptor RET (8), inducing invasion by pancreatic cancer cells (9,10).
We hypothesized that peripheral nerves in a tumor’s microenvironment may influence the biological behavior of cancer cells, contributing to tumor progression. If a secreted protein that triggers polarized neurotrophic migration of cancer cells (PNMCs) can be identified, then its activity may theoretically be targeted pharmacologically in an attempt to prevent cancer spread along nerves. Our approach was based on an in vitro assay that allows the dynamic imaging of cancer cell migration along nerve axons and on an in vivo model that allows monitoring of nerve invasion using high-resolution imaging modalities and neurophysiological tests.
Materials and Methods
Cell Culture and Reagents
Human carcinoma cell lines included pancreatic adenocarcinoma (MiaPaCa2 and Panc1), head and neck squamous cell carcinoma (QLL2 and SCC25), salivary and lung mucoepidermoid carcinoma (H3118 and H292), and human cervical cancer (HeLa) cell lines. MiaPaCa2, Panc1, and SCC25 were purchased from the American Type Culture Collection (Manassas, VA). H3118 and H292 were gifts from Dr Frederic Kaye (National Cancer Institute). HeLa was provided by Dr Christopher Moskaluk (University of Virginia). QLL2 was derived from a patient at Memorial Sloan-Kettering Cancer Center (MSKCC). Cells were grown in vitro in Dulbecco's modified Eagle medium (DMEM), Eagle modified essential medium, or RPMI-1640 containing 10% fetal calf serum (FCS), penicillin and streptomycin, and incubated in a 5% CO2-humidified incubator at 37°C.
Dorsal root ganglia (DRG) from newborn male Balb/c mice were isolated as previously described (11). DRG were removed rapidly, placed in phosphate-buffered saline (PBS contains [in grams/liter]: NaCl [8]; KCl [0.2]; Na2HPO4 [1.44]; KH2PO4 [0.24], pH 7.4), and digested in 0.125% collagenase for 45 minutes followed by 20 minutes in 0.25% trypsin at 37°C. The DRG were then washed in media and gently dissociated with a pipette. The cell suspension was centrifuged through a 15% FCS solution (Sigma, St Louis, MO). The cell pellet was resuspended in cultured media containing Neurobasal, B-27 serum-free (Invitrogen Corporation, Carlsbad, CA), 2 mmol/L glutamine, 100 U/mL penicillin, and 100 μg/mL streptomycin. Neurons were then plated on 24-well culture plates precoated with poly-ornithine, fibronectin, and laminin (Falcon Plastics, Franklin Lakes, NJ). Neurons were incubated for 10 days in the bottom well of a Boyden chamber with Neurobasal, B-27 media, or with DMEM supplemented with 10% FCS. Dissociated neurons survived well without adding neurotrophic factors. Before the migration assay, neurons were incubated overnight with serum-free DMEM. We detected no morphological changes or neural cell death when neurons were incubated up to 3 days with serum-free DMEM.
Neural Invasion In Vitro Model for Assessment of Nerve–Cancer Cell Interactions
The in vitro PNMC model is based on a technique originally described for prostate cancer cells (12). Mice (Balb/c, 2–4 weeks old, n = 60) were killed using CO2 euthanasia according to MSKCC institutional guidelines, and their excised DRG were implanted approximately 500 μm adjacent to a colony of carcinoma cells in growth factor–depleted Matrigel matrix (BD Biosciences, Bedford, MA). Cultures were grown in DMEM, RPMI-1640, or MEM containing 10% FCS in 37°C and 5% CO2 incubation conditions. The FCS was removed as soon as cancer cells made contact with the DRG neurites (∼5 days after implantation). In experiments with HeLa cells, 3% FCS was added to support cell survival. The neural invasion index was calculated by dividing the distance traversed by the invading cancer cells at day 10 along the DRG neurites (α) by the total distance measured between the tumor colony and the DRG (β).
Immunoblotting
For expression of phospho-ERK1/2, total ERK1/2, phospho-MEK-1/2, and total MEK-1/2, cells were grown in Matrigel with and without contact with the DRG for 10 days. Following 24 hours of incubation with serum-free media, cells were released without enzymatic digest using cell recovery solution (BD Biosciences) at 4°C. Cancer cells were mechanically dissociated gently under the microscope and isolated from the DRG without disrupting its integrity. Cell pellets were sonicated for 10 seconds and clarified by centrifugation. Proteins (20–50 μg) were subjected to electrophoresis in 7.5% or 10% Tris–HCl gels (Bio-Rad, Hercules, CA) and transferred to polyvinylidene difluoride membranes, blocked with TBS-T (20 mM Tris–HCl, pH 7.6; 154 mM NaCl; and 0.1% Tween 20), containing 5% nonfat dry milk (Bio-Rad), and exposed to primary antibody followed by a secondary antibody conjugated to horseradish peroxidase. Protein–antibody complexes were visualized using an ECL Plus detection system (Amersham, Piscataway, NJ). Density was quantified using a computer-controlled carge coupled device camera (AlphaImager Imaging Systems; Alpha Innotech, San Leandro, CA).
Immunofluorescence
Glass dishes containing DRG and cancer cells grown in Matrigel were washed once with PBS and fixed with −20°C methanol for 10 minutes followed by brief exposure to −20°C acetone. Cells were then washed with PBS for 5 minutes at room temperature. Polyclonal rabbit anti-cytokeratin 8/18 or mouse anti-neurofilament primary antibodies were used for staining of cancer cells and nerves. Secondary antibodies included goat anti-mouse Cy5 and Alexa Fluor 488 and goat anti-rabbit: Cy5, Alexa Fluor 488, Alexa Fluor 633, and Alexa Fluor 568 (Molecular Probes, Eugene, OR). Preparations were incubated overnight with primary antibodies at 1:250 dilution or saline as control at 4°C. Cells were washed with PBS for 15 minutes and incubated with a secondary antibody at room temperature for 25 minutes at 1:200 and 1:1000 dilutions. Slides were mounted and examined by confocal microscopy (LSM510; Carl Zeiss, Oberkochen, Germany).
Immunohistochemistry of Murine Sciatic Nerves to Differentiate Between Nerve and Cancer Cells
Sciatic nerve specimens were excised 50 days after tumor injection, frozen in OCT, and cut into 8-μm-thick sections on glass slides. Some of the slides were fixed and stained with hematoxylin and eosin. To differentiate between nerve tissue and cancer cells, the sciatic nerve preparation was immunostained with polyclonal rabbit anti-cytokeratin 8/18 antibody (Santa Cruz Biotechnology, Santa Cruz, CA). Slides were fixed with 2% formaldehyde and 0.2% glutaraldehyde, quenched, blocked, and incubated with primary antibodies (1:100 and 1:200 dilutions) overnight at 4°C. Slides were incubated with a biotinylated secondary antibody and visualized with an avidin–biotin complex kit (Santa Cruz Biotechnology). Slides were counterstained with hematoxylin and reviewed in a blinded fashion by two of the authors (Z. Gil and A. Rein).
Immunohistochemistry of Human Pancreatic Cancers to Assess Expression of RET and GFRα1
The study population included randomly selected pancreatic adenocarcinomas case patients who had been identified through a search of the MSKCC Departments of Surgery and Pathology Tissue Bank after approval by the Institutional Review Board. Archival samples of pancreatic adenocarcinoma from tumors that had been surgically resected between January 1, 1980, and December 31, 2006, at MSKCC were selected for analysis. Only samples from previously untreated patients with available paraffin-embedded primary tumor tissue were obtained. All selected tumors demonstrated histological evidence of neural invasion. The demographic and pathological details of the patients are shown in Supplementary Table 1 (available online). A detailed histopathologic review of all cancers was performed by an experienced pathologist (D. L. Carlson). Tumor was identified and marked on representative sections stained with hematoxylin and eosin for each patient. Sections of 5 μm thickness were cut from paraffin blocks and placed on charged polylysine-coated slides. Representative sections were stained with hematoxylin and eosin and analyzed to confirm the presence of nerve invasion. Immunostaining was performed with a Ventana automated staining system (Ventana Medical Systems, Tucson, AZ). Monoclonal mouse anti-human RET and GFRα1 antibodies (Santa Cruz Biotechnology) were used at a dilution of 1:100 to 1:500. Brain tissue known to express RET and GFRα1 was used as the positive control, whereas normal connective tissue (fibroblasts and fat tissue) was used as the negative control. Relative protein expression was estimated using dedicated software (MetaMorph; Molecular Devices, Union City, CA), which analyzed the intensity and area of fluorescence.
Migration Assays for Studying the Effects of GDNF on Cancer Cells
Polyethylene terephthalate 8.0-μm pore transparent inserts (BD Biosciences, Bedford, MA) were used in 24-well plates. Cancer cells were incubated in FCS-free media overnight, and 1 × 10⁵ cells were added to each of the inserts in 0.5 mL of media without FCS. Below the inserts, 0.7 mL of FCS-free media was added with GDNF (1–100 ng/mL) or DRG into each of the wells. FCS-free media alone was used as a control. In additional experiments, dissociated neurons were treated with anti-GDNF antibodies (0.5 or 4 μg/mL), or MiaPaCa2 cells were incubated with pyrazolopyrimidine-1 (PYP1, 2 μmol/L). The polyethylene terephthalate inserts were removed after 24 hours. The nonmigrating cells were wiped off from the superior aspect of the membranes using a cotton swab. The migrating cells present on the undersurface of the membrane were fixed in 100% alcohol and stained with 1% methylene blue in 1% borax. The circular membranes were then excised using a scalpel and mounted on glass slides. Migrating cells were quantified by counting stained cells in five high-power fields at predetermined areas on the membrane.
Cytotoxicity Assays for Assessing Cancer Cell Viability With Small-Molecule Inhibitors
Pancreatic cancer cells (MiaPaCa2) were plated at 2 × 10⁴ cells per well in 12-well plates in 2 mL medium. After incubation for 24 hours, PD98059 (25 μmol/L) or PYP1 (2 μmol/L) was added to each well. Cell viability was tested at daily intervals by lactate dehydrogenase assays. On day 4, fresh medium with the same drug concentration was added to the wells to feed remaining viable cells. Cells were washed with PBS and lysed with Triton X (1.35%) to release intracellular lactate dehydrogenase, which was quantified from cell lysates with a Cytotox 96 kit (Promega, Madison, WI) at 450 nm on a spectrophotometer (EL321e; Bio-Tek Instruments, Winooski, VT). Results are expressed as the ratio of surviving cells. This ratio was determined by comparing the measured lactate dehydrogenase of each infected sample relative to control untreated cell samples, which were considered 100% viable. All samples were analyzed in triplicate.
Lentiviral Gene Transduction and RNA Interference for Inhibition of GDNF Expression by DRG
Lentiviral pLKO.1 vectors expressing short hairpin RNA against murine GDNF (NM_010275) were purchased from Open Biosystems (Huntsville, AL) and from OriGene Technologies (Rockville, MD). pLKO.1 empty vector was used as a negative control. High-titer lentiviral vector stock was produced in 293T cells by using calcium phosphate–mediated transient transfection and cotransfection with pCMV and pUC19 packaging vectors as described previously (13). The efficiency of the transfection was evaluated using fluorescence microscopy to monitor enhanced green fluorescent protein expression that was typically greater than 90%. Supernatants were harvested after 24 hours. DRG neurons (∼2 × 10⁵ in 24-well dishes) were transduced with virus plus 4 μg/mL polybrene. A second infection was performed 24 hours after the first infection and the medium changed 24 hours later. Protein expression was determined 48 hours later by immunoblotting. DRG treated with anti-GDNF short hairpin RNA was used for migration experiments but not for the Matrigel DRG experiments because infection of the DRG through the Matrigel was inefficient.
Small interfering RNA (siRNA) oligonucleotides directed against human RET (Stealth Select RNAi) were custom-designed and validated by Invitrogen Corporation (Carlsbad, CA). Cells were transfected with three different transcripts of RET siRNA (UniGeneID: Hs.350321, Cat. No. HSS109180, HSS109181, HSS109182) or with a nontargeting siRNA used as control (Stealth RNAi Negative control Low GC, No. 12935-200). MiaPaCa2 cells were cotransfected with 600 pmol siRET or control siRNA using Lipofectamine 2000 (Invitrogen) according to the manufacturer's protocol. Green fluorescent protein cDNA was used to optimize transfection efficiency before siRNA transfection. After 72 hours, cells were harvested, and RET expression was assessed with immunoblotting.
The siRNA transcripts that induced maximal block of RET expression (HSS109180, 5′-GGCGGAAGAUGAAGAUUUCGGAUUU-3′) were also used for the nerve invasion DRG assays. siRET-transfected MiaPaCa2 cells were harvested 24 hours after transfection and plated in Matrigel DRG assays for subsequent experiments.
Video Microscopy and Computer-Assisted Time-Lapse Analysis for In Vitro Migration Assays
Cancer cells and DRG were maintained in Delta T 0.17 mm culture dishes (Bioptechs, Inc, Butler, PA) containing a buffered medium. During live video microscopy imaging, the dish was placed in a closed environment at a mean ± SD temperature of 37 ± 0.1°C and 5% CO2 (Tokai Hit, Fujinomiya, Japan). Cells were recorded by using a carge coupled device camera (CoolSNAP; Photometrics, Tucson, AZ) placed on a microscope (Axiovert 200M; Zeiss, Göttingen, Germany). Cells were imaged at days 7–10. Digitized images were recorded every 10 minutes for up to 24 hours to follow cell locomotion. In each experiment, three to six different cells were imaged simultaneously and up to seven focus planes were acquired for each cell. Data acquisition and analysis were performed using specialized software (MetaMorph 7; MDC, Sunnyvale, CA) for off-line quantitative measures of migrating cells. This software determines the xy coordinates of a cell at any given time, along with the cell trajectory, distance from origin, and speed of motion. The maximal distance from origin was calculated as the greatest linear distance between a cell's origin and its final position. The mean velocity was calculated by measuring the travel distance between subsequent positions in 10-minute intervals. The accuracy of the measurements was reviewed and confirmed for each cell independently.
In Vivo Model of Sciatic Nerve Function
Nude athymic mice (n = 14) were anesthetized using isoflurane (1%–3% for maintenance and up to 5% for induction), and their left sciatic nerve was exposed (Supplementary Figure 2, available online). The nerve could be easily identified deep to the femoro coccygeous and biceps femoris muscles. Carcinoma cell lines (MiaPaCa2 or QLL2) were microscopically injected into the sciatic nerve, distal to the bifurcation of the tibial and common peroneal nerves. Microinjection of 3 μL of cell suspension at a concentration of 1 × 10⁵ cells per microliter was performed using a 10-μL Hamilton syringe for a 2-minute period. Sciatic nerve function was measured weekly as described previously (14). The sciatic nerve innervates the hind limb paw muscles. Sciatic nerve function was monitored by using the following measurements: 1) gross behavior––signs of motor weakness or repetitive biting of the hind limb were monitored for 10 minutes; 2) sciatic neurological score––nerve function was graded according to hind limb paw response to manual extension of the body, from 4 (normal) to 1 (total paw paralysis) (15); 3) sciatic nerve function index––this was calculated as the spread length (in millimeters) between the first and fifth toes of the mouse hind limbs. Sciatic nerve function was normal in all mice after the operation (n = 21).
Imaging of Neural Invasion In Vivo
A dedicated 55-MHz high-resolution small animal ultrasound system (Vevo 770; VisualSonic, Toronto, Canada) was used to measure nerve and tumor diameters once a week (n = 14 mice). The sciatic nerve diameter was measured 5 mm proximal to the cancer cell injection site, just before it enters the spinal column. Using this method, we were able to identify neural invasion at a spatial resolution of 50–100 μm (16). Eight mice were subjected to magnetic resonance imaging, performed on a Bruker USR 4.7-T 40-cm bore scanner (Bruker Biospin MRI, Inc, Billerica, MA) using a custom-designed active decoupled radiofrequency surface coil (Stark MRI Contrast Research, Erlangen, Germany) to improve signal to noise ratio and spatial resolution. The total imaging time was 90 minutes for each mouse. For each mouse, three scan sequences were acquired in the following order: a coronal T2-weighted fast spin-echo image and a coronal T1-weighted gradient-echo image pre- and postcontrast (gadolinium-diethylenetriamine penta-acetic acid) injection. T2-imaging parameters included TE = 40.2 milliseconds, TR = 2000 milliseconds, field of view 3.0 × 3.0 cm, matrix 256 × 192, number of acquisitions = 12, slice thickness of 800 μm, interslice spacing of 800 μm, and in-plane resolution of 117 × 156 μm. T1-imaging parameters included TE = 2.3 milliseconds, TR = 1180 milliseconds, flip angle 30°, field of view 3.0 × 3.0 cm, matrix 126 × 126, number of acquisitions = 8, slice thickness of 800 μm, and interslice spacing of 800 μm. Dynamic contrast-enhanced scans were obtained after injection of gadolinium-diethylenetriamine penta-acetic acid, 0.1 mmol/kg, every 2 minutes after injection with an in-plane resolution of 234 × 234 μm. Mouse respiration was monitored during the imaging session (model 1025; Small Animal Instruments, Inc, Stony Brook, NY).
Measurement of Toxicity of PYP1 on Mice
The toxicity of PYP1 was estimated using the following parameters: body weight, change in behavior pattern (grooming and general activity), skin condition (wounds and infections), and mortality. All protocols were approved by the MSKCC institutional animal care committee.
Statistical Analysis
Student t test and analysis of variance test with multiple range tests adjusted for contrast with control were used for statistical analysis as appropriate. All P values were calculated using two-sided tests. Mantel–Haenszel and Fisher exact tests were used for evaluating differences in drug toxicity between groups. SPSS (SPSS, Inc, Chicago, IL) and Origin (OriginLab Corporation, Northampton, MA) were used for graphs and statistical analysis. Differences were considered statistically significant if P was less than .05. Error bars in the graphs represent 95% confidence intervals (CIs). All experiments were repeated at least three times. Data from representative experiments are shown.
Results
In Vitro Model of Nerve Invasion by Cancer
To identify tumors that have a propensity to invade nerves, we first tested various carcinoma cell lines with histologies that are clinically known to favor neural invasion. A panel of candidate human cancer cell lines was grown in Matrigel adjacent to preparations of cultured DRG. In two pancreatic adenocarcinoma cell lines (MiaPaCa2 and Panc1) and one cervical cancer cell line (HeLa), cells that were dissociated from colonies formed clusters that migrated in a unidirectional fashion along the nerve toward the ganglion (Figure 1; Supplementary Figure 1, available online). Over time, these cells formed bridgeheads to facilitate more extensive PNMCs. Cancer cells did not disperse from their colony in areas without nerve contact, and therefore, PNMC occurred only in regions adjacent to nerves. Immunofluorescence staining confirmed that these were carcinoma cells invading nerves (Figure 1, F). In contrast, the other carcinoma cell lines tested (head and neck squamous cell carcinoma-QLL2, SCC25, lung adenocarcinoma-H292, and salivary gland mucoepidermoid adenocarcinoma-H3118) were unable to invade nerves, suggesting that neuro–neoplastic interactions are dependent on specific cancer cell characteristics.
Figure 1.

Polarized cancer cell invasion along dorsal root ganglion (DRG) neurons. A) Confocal laser scanning immunofluorescence image of a DRG using anti-neurofilament antibodies. Nerves arising from the DRG are shown in green (scale bar = 25 μm). B) MiaPaCa2 pancreatic carcinoma cells invading a nerve 5 days after implantation (scale bar = 25 μm). The black box indicates the magnified area in (C). Tumor cells are indicated in the left upper corner by a green asterisk; the ganglion is indicated by a white asterisk. C) High-magnification image showing a column of cancer cells migrating in a single file along the nerve (scale bar = 5 μm). D) Neural invasion of MiaPaCa2 cancer cells at day 9 showing more extensive neural invasion. Black arrows indicate cancer cell migration along the nerves. E) Ten days after implantation, squamous cell carcinoma (QLL2) cells did not invade nerves (scale bars = 25 μm). F) A confocal microscope image of MiaPaCa2 cells invading nerves. Cancer cells are labeled with anti-cytokeratin 8/18 antibodies (magenta, scale bar = 5 μm). G) A confocal image of non–neuroinvasive QLL2 cells unable to cross the tumor–nerve barrier at day 14 after implantation. Tumor cells are labeled with anti-cytokeratin 8/18 antibodies (magenta, scale bar = 25 μm). For each experiment, n = 35–50, except for immunofluorescence, where n = 10 each. H) Tumor–nerve microenvironment influences cancer cell morphology before invasion. Images taken at times 3, 12, and 16 hours show morphological change of tumor cells (left upper corner) in response to neurite growth (right lower corner) and close proximity (scale bar = 5 μm). Green arrows indicate the change in cancer cell morphology before neural contact.
Induction of Cancer Cell Morphological Changes by the Nerve Microenvironment Before Invasion
If PNMC is mediated by a protein secreted by nerves, then morphological changes of cancer cells should be detected before nerve invasion. Time-lapse images of a colony of cancer cells and an adjacent growing nerve at varying time points showed that neuroinvasive cancer cells undergo marked morphological changes in the vicinity of nerves, where they become elongated and polarized toward the nerves (Figure 1, H). We compared the number of spindle-shaped cancer cells close to the nerve (<50 μm) with the number of spindle-shaped cells far (>500 μm) from the nerve. We found a higher number of spindle-shaped cells close to nerves (mean = 5.80 spindle cells, 95% CI = 4.71 to 6.89 spindle cells) than far from nerves (mean = 0.28 spindle cells, 95% CI = 0.06 to 0.5 spindle cells; P < .001; n = 13). The non–neuroinvasive cell lines did not show morphological changes in the nerves’ vicinity (n = 25).
Dynamic Unidirectional Migration of Cancer Cells Along Nerves
The dynamic process by which cancer cells invade nerves was evaluated using time-lapse microscopy (Figure 2; Supplementary Movie 1, available online). Migration was linear, nerve-dependent, and polarized toward the ganglion. Although migrating cells exhibited unidirectional motility along the nerve, cancer cells without nerve contact exhibited random movement. Time-lapse analysis showed that the mean velocity of invading and noninvading cells was similar (12.5 μm, 95% CI = 11.23 to 13.77 μm/hour vs 11.4 μm/hour, 95% CI = 10.87 to 11.93 μm/hour; P = .7; n = 20). However, because of their unidirectional motion, cells migrating along nerves traveled to a 13-fold greater distance as compared with cells not in contact with nerves (mean distance = 187.1, 95% CI = 148 to 226 μm vs 14.1 μm, 95% CI = 9.58 to 19.22 μm, difference = 143 μm; P < .001; n = 20).
Figure 2.

Time-lapse analysis of cancer cell migration along nerves. A) Time-lapse image analysis reveals migration of two MiaPaCa2 cells along the nerve from 0 to 14 hours. Red and green asterisks indicate first and second migrating cells, respectively (scale bar = 25 μm). B) A coordinate graph depicting the migration path of a cancer cell in contact with the nerve (red) and without neural contact (black). The Y and X coordinates are shown. C) Analysis of distance from origin of migrating cells with axonal contact (n = 20) and (D) without axonal contact (n = 19). The direction of migration was constantly toward the nerve ganglion, as indicated by the black arrow on the far right.
Cancer Cell Invasion of Peripheral Nerves In Vivo
Because an in vitro model cannot completely mimic the natural tumor microenvironment, we evaluated the ability of representative neuroinvasive (MiaPaCa2) and non–neuroinvasive (QLL2) cell lines to invade nerves in vivo. Nerve cell bodies for the sciatic nerve are located in the DRG; therefore, extracted murine DRG cells are representative of the murine sciatic nerve model. Cancer cells were implanted in a distal part of the sciatic nerve (Supplementary Figure 2, available online). We evaluated the ability of tumors to invade along the nerve toward the spinal cord. Histological evaluation of these nerves at week 7 revealed extensive proximal nerve invasion toward the spinal cord in seven of seven mice with MiaPaCa2 tumors (Supplementary Figure 3, available online). In contrast, none of the nerves with QLL2-derived tumors had nerve invasion. The degree of nerve invasion was determined by measuring the tumor diameter at the implantation site (“tumor growth”) and the nerve diameter 5 mm proximal along the sciatic nerve (“cancer nerve invasion”). The mean diameter of control nerves injected with saline was 0.54 mm (95% CI = 0.47 to 0.61 mm, n = 7). The tumor diameter at the implantation site was smaller in the MiaPaCa2 group compared with the QLL2 group (2.25 mm, 95% CI = 1.81 to 2.69 mm vs 3.61 mm, 95% CI = 2.53 to 4.69 mm, difference = 1.36 μm; P = .04; n = 7); however, the proximal nerve diameter was statistically significantly larger in the MiaPaCa2 group than in the QLL2 group (1.95 mm, 95% CI = 1.5 to 2.4 mm vs 0.71 mm, 95% CI = 0.56 to 0.86 mm, difference = 1.24 mm; P < .001; n = 7) because of massive cancer invasion. Nerve invasion was verified by immunohistochemical staining with anti-cytokeratin 8/18 antibodies. These in vivo data confirm the propensity of MiaPaCa2-derived tumors to invade along nerves, as predicted by the in vitro model.
GDNF-Mediated Nerve Invasion
PNMC may occur in response to a protein secreted from nerves. GDNF is a strong chemoattractant (5,17), which has been associated with poor prognosis in several types of human cancers (18–21). The high conservation between mouse and human GDNF also suggests the existence of interregulatory elements between murine nerves and human cancer cells in this model (22,23). We therefore first evaluated the effect of soluble GDNF on cancer cell migration using a dual chamber migration assay. All cell lines migrated in response to 15% serum (data not shown). GDNF induced MiaPaCa2 cells migration in a dose-dependent manner but had no effect on the non–neuroinvasive cell lines (Figure 3; Supplementary Figure 4, A, available online). A similar effect on migration of MiaPaCa2 cells was found when DRG were grown in the lower chamber as the attractant (Figure 3, A). We detected secretion of GDNF by immunoblotting in the recovered media at 48 hours after incubation with serum-free DMEM (Figure 3, B). The ability of RET and GDNF antibodies to block GDNF activity and RET receptors was described previously (9,16,24–26). Adding anti-GDNF antibodies to the lower chamber of cultured DRG neurons reduced migration of cancer cells compared with control antibodies (Figure 3, A). Lentiviral gene transduction of DRG nerve cells with short hairpin RNA directed against GDNF also suppressed cancer cell migration, whereas infection with an empty vector had no effect (Figure 3, A and B).
Figure 3.

Glial cell-derived neurotrophic factor–induced cancer cell invasion. A) Serum-starved MiaPaCa2 cells were plated in the upper chamber, and GDNF (1–100 ng/mL) was added to the lower chamber of transwell plates and cultured for 24 hours (white bars). In another experiment, dorsal root ganglion (DRG) nerve cells were grown on the lower plate instead of adding GDNF (the condition is indicated below the graph). While nerves induced cancer cell migration (control—blue bar), adding anti-GDNF antibodies to the lower chamber suppressed it (red bars). Nonimmune Igs were used for control (n = 10). Yellow bars: lentiviral gene transduction of neurons with short hairpin RNA (shRNA) targeting GDNF expression (shGDNF) also inhibited cancer cell migration toward the neurons (n = 6). An empty viral vector served as the control (shControl). B) Immunoblots of conditioned media from dissociated DRG nerve cell cultures. Conditioned media was recovered at 24–48 hours after incubation. Protein analysis showed detection of a protein band, which corresponds to the secreted form of GDNF. C) Immunoblots of GDNF protein recovered from nerve cell lysates after lentiviral gene transduction with shRNA directed against GDNF (n = 3–6 experiments in each condition). Empty vector lentivirus was used as control (shControl). D) Cancer cells (green asterisk) were grown in Matrigel adjacent to DRG (white asterisk). Pictures show representative experiments of neural invasion by MiaPaCa2 cells taken at day 10 in control conditions allowing for neural invasion (left); with anti-GDNF antibodies inhibiting invasion (middle) and of a DRG from a heterozygous mouse deficient of GDNF (gdnf−/+). The black arrows indicate the invading cancer cells. E) An illustration showing the calculation of nerve invasion index (α/β). F) Dose–response curves showing the effect of anti-GDNF antibodies on invasion index at day 10 (P < .001; n = 5–15 experiments in each condition). Nonimmune Igs served as control (open circle). G) Nerve invasion index in wild-type (WT; white bar) and gdnf−/+ mice (gray bar) at day 10 (n = 60–66). P values in (A, F, and G) were calculated by two-sided Student t test. DMEM = Dulbecco's modified Eagle medium; hpf = high-power field.
DRG were then grown in Matrigel, and the ability of MiaPaCa2 cells to invade their nerves was measured by calculating the neural invasion index (Figure 3, E). Anti-GDNF antibodies decreased nerve invasion in a dose-dependent manner compared with no treatment using rabbit IgG as control (Figure 3, D and F). To confirm these results, we used DRG from mice deficient of GDNF (7,27). Homozygous GDNF-null mice die at birth. Because the handling of DRG from tiny murine embryos is technically challenging, we performed the DRG experiments using heterozygous gdnf−/+ mice with normal-sized DRG. Enzyme-linked immunosorbent assay (ELISA) confirmed a reduction in GNDF expression in DRG of gdnf−/+ mice compared with wild-type mice (32.5 pg/mL, 95% CI = 29.3 to 35.7 pg/mL vs 47.6 pg/mL, 95% CI = 41.2 to 54 pg/mL, difference = 15.1 pg/mL; P = .003; n = 6). Using nerve invasion assays, we found a statistically significant reduction of PNMC in GDNF-deficient mice compared with wild-type mice (Figure 3, D and G; nerve invasion index: wild type vs gdnf+/−, mean = 0.76, 95% CI = 0.68 to 0.84 vs 0.43, 95% CI = 0.35 to 0.53, difference = 0.33; P < .001; n = 60–66). Overall, these data show that DRG secrete GDNF and provide a scaffold to facilitate cancer invasion along nerves.
Activation of RET in Neuroinvasive Cancer Cells
The cell surface receptor to GDNF is a GFRα1, which interacts with its transmembrane coreceptor RET after ligand binding (3,4,8). We examined the expression of RET and GFRα1 in various carcinoma cell lines.
Immunoblotting showed that all of the cell lines tested expressed the RET gene product. However, only three cell lines (MiaPaCa2, Panc1, and HeLa) expressed GFRα1 (Figure 4, A; see Supplementary Figure 5 for positive and negative controls, available online). Importantly, the same cell lines expressing both GFRα1/RET were also the ones that demonstrated neuroinvasiveness.
Figure 4.

Activation of RET and mitogen-activated protein kinase in neuroinvasive cancer cells. A) Expression of RET (170/150 kDa) and GFRα1 (53 kDa) in various cancer cell lines, as determined by immunoblotting. Expression of β-actin (42 kDa) was used as a control for loading and transfer. B) Cancer cell colonies (green asterisk) were grown in Matrigel adjacent to dorsal root ganglion (DRG) (white asterisk). When the DRG neurites made contact with the cancer colony, anti-RET antibodies (1 μg/mL) or recombinant mouse RET-Fc chimera (5 μg/mL) were added to the media. Pictures show representative experiments of neural invasion by MiaPaCa2 cells taken at day 10. Nonimmune antibodies were used as control (n = 8–12). C) The effect of small interfering RNA (siRNA) directed against RET (siRET) on invasion of pancreatic cancer cells along DRG nerves. siRET reduced RET expression within 72 hours after transfection (immunoblotting—lower panel), whereas noncoding siRNA served as control (siControl) and had no impact on RET expression. Nerve invasion was measured in vitro on day 7 (n = 11–17). D) Dose–response effect of the RET inhibitor pyrazolopyrimidine-1 (PYP1) on MiaPaCa2 cell invasion index. Inset: effect of PYP1 on cell migration toward DRG nerve cells in dual chamber migration assays (high-power field [hpf], n = 10). E) Dose–response curves of the effect of the MEK-1 inhibitor PD98059 on MiaPaCa2 nerve invasion index (P < .001; n = 5–15 experiments in each condition). F) Effect of PYP1 and PD98059 on invasion index of another human pancreatic adenocarcinoma cell line—Panc1, and on a human cervical cancer cell line—HeLa (*P < .001; n = 10 experiments in each condition). G) Cell viability was measured after treatment with PD98059 (25 μM) and PYP1 (2 μM) (n = 3 in each condition). H) Immunoblotting to assay GDNF expression by the DRG after treatment with PD98059 and PYP1. P values were calculated by using a two-sided Student t test.
We next evaluated whether RET is necessary for PNMC. When anti-RET antibodies (1 μg/mL) were added to the media, the neural invasion index decreased (Figure 4) (control vs Anti-RET, mean = 0.9, 95% CI = 0.75 to 1.05 vs 0.22, 95% CI = 0 to 0.44, difference = 0.69; P < .001; n = 8). We confirmed this observation by using recombinant mouse RET-Fc chimera protein (5 μg/mL) that is able to block GDNF activity (28,29). Adding 5 μg/mL RET-Fc to the media inhibited nerve invasion by approximately 70% (Figure 4, B) (control vs RET-Fc, mean = 0.91, 95% CI = 0.75 to 1.05 vs 0.25, 95% CI = 0.03 to 0.47, difference = 0.66; P < .001; n = 12). To further characterize the specific role of RET in nerve invasion, we used siRNA targeting RET expression in this same model. RET expression was lower at 72 hours after transfection with RET siRNA than that of cells transfected with siControl (Figure 4, C, lower panel). At day 7, the neural invasion index in siRET-treated cancer cells was reduced compared with siControl cancer cells (mean = 0.82, 95% CI = 0.7 to 0.94 vs 0.39, 95% CI = 0.27 to 0.49, difference = 43; P < .001; n = 11–17). Consistent with these findings, treatment of neuroinvasive cancer cells with PYP1, a potent RET inhibitor (28,29), also effectively inhibited cancer cell migration toward DRG neurons in dual chamber assays in a dose-dependent manner (Figure 4, D; Supplementary Figure 4, C, available online). PYP1 did not inhibit the migration of cancer cells when 15% FCS was used as the chemoattractant (data not shown).
To study downstream signaling pathways following RET activation, we treated cells with inhibitors of MEK-1 (PD98059) and PI3K (LY294002) in the Matrigel invasion assay. PD98059 treatment suppressed neural invasion (Figure 4, E), whereas LY294002 had a relatively minor effect on inhibiting cancer cell invasion (data not shown). Effects of PYP1 and PD98059 on neural invasion by Panc1 and HeLa were similar (Figure 4, F). This inhibitory effect was not because of cancer cell death, change in neuronal morphology, or decrease in GDNF expression by nerves (Figure 4, G and H). We further evaluated the effects of these inhibitors on nerve invasion using time-lapse analysis. Both inhibitors suppressed PNMC along the axon because of loss of polarized movement toward the ganglion but not because of any reduction in cell motion or velocity (Figure 5, A and B). These data suggest that the effect of PYP1 and PD98059 was on inhibiting the ability of cancer cells to specifically invade and track along nerves.
Figure 5.

Activation of RET and mitogen-activated protein kinase in neuroinvasive cancer cells. A) Time-lapse image analysis of cells contacting a nerve, without nerve contact, with contact in the presence of PD98059 (25 μM) or with contact in the presence of pyrazolopyrimidine-1 (PYP1) (2 μM). Bars show the mean distance of cells migrated from the point of origin and the mean velocity of cancer cell migration (two-sided analysis of variance with multiple range test adjusted for contrasts with control, P < .001; n = 8–21 in each group). B) Graphs representing migration of cancer cells along nerves with or without the MEK-1 inhibitor PD98059 (25 μM) or the RET inhibitor PYP1 (2 μM). The distance from origin is shown for each cell (n = 8–21), see Figure 2, C for control. C) MiaPaCa2 cells were conditioned with recombinant GDNF (100 ng/mL) for 0–40 minutes at room temperature. Incubation with GDNF induced phosphorylation of extracellular signal–regulated kinase (ERK) as measured by enzyme-linked immunosorbent assay. The relative expression of P-ERK and ERK at various time points after stimulation is shown. Comparisons were between absorption read at time point 0 minutes (control) and 40 minutes (poststimulation). (Relative expression of P-ERK 1.07 vs 1.45, for time point 0 and 40 minutes, respectively, difference = 0.38, 95% confidence interval on the means = 0.91 to 1.23 vs 1.30 to 1.60, respectively, n = 6 for each point, *P < .001.) D) MiaPaCa2 and QLL2 cells were grown in Matrigel alone or with dorsal root ganglion (DRG). Following serum starvation, cancer cells were microscopically separated from the DRG and total cancer cells lysates were immunoblotted with anti P-ERK and ERK antibodies. E) PYP1 (2 μM) treatment on ERK phosphorylation in MiaPaCa2 cells cultured with DRG. F) Top: incubation of MiaPaCa2 cells with GDNF (100 ng/mL) and phosphorylation of RET (P-RET) within 20–40 minutes. Bottom: dissociated nerves were grown in culture with serum-free Dulbecco's modified Eagle medium, and the conditioned media was collected after 48 hours and added to serum-starved MiaPaCa2 cells. Immunoblotting was used to detect P-RET within 10–40 minutes after adding the conditioned media to the cells. P values were calculated by using a two-sided Student t test.
Activation of the Mitogen-Activated Protein Kinase Pathway in Neuroinvasive Cancer Cells
We examined the effects of GDNF on extracellular signal–regulated kinase (ERK) phosphorylation (P-ERK) in MiaPaCa2 cells. Following overnight serum starvation, cells were conditioned with recombinant GDNF (100 ng/mL). The relative expression of P-ERK and ERK at various time points after stimulation with GDNF was measured by ELISA (Figure 5, C). Comparisons were made between absorption read at time point 0 minutes (control) and 40 minutes (after stimulation). We observed a statistically significant increase in relative expression of P-ERK, but not in ERK expression, at 40 minutes (mean relative expression = 1.07, 95% CI = 0.91 to 1.23 vs 1.45, 95% CI = 1.30 to 1.60, difference = 0.38; P < .001; n = 6 for each point).
To evaluate whether nerve invasion by MiaPaCa2 cells induces P-ERK, cells were first cocultured with DRG in Matrigel. Cancer cells and DRGs were then separated with a nonenzymatic cell recovery solution. The phosphorylation level of ERK was then determined by immunoblotting. MiaPaCa2 cells grown with DRG had higher levels of P-ERK than control cells grown in the absence of DRG (Figure 5, D, top panel). To rule out the possibility of neuron contamination in these cancer cell protein extracts causing P-ERK activation, we repeated this experiment with the non–neuroinvasive QLL2 cell line grown under the same conditions. QLL2 cells cocultured with DRGs and control QLL2 cells grown in the absence of DRG showed no increase in P-ERK levels (Figure 5, D, bottom panel). Treatment with PYP1 effectively inhibited ERK phosphorylation in MiaPaCa2 cells grown in contact with DRG (Figure 5, E).
We also assessed if the GDNF could induce RET activation in pancreatic cancer cells. We observed an increase in phosphorylation of RET after incubation of MiaPaCa2 cells with GDNF 100 ng/mL (Figure 5, F, upper panel). To further investigate the ability of DRG neurons to activate RET on pancreatic cancer cells, conditioned media from nerve cells supernatants were collected after 48 hours and added to serum-starved MiaPaCa2 cells. Immunoblot analysis showed an increase in phosphorylation of RET within 10–40 minutes after adding the conditioned media (Figure 5, F, bottom panel).
Inhibition of Neural Invasion In Vivo
Because in vitro data demonstrated that PYP1 may inhibit PNMC, we investigated its ability to inhibit nerve invasion in vivo. Seven days after implantation of MiaPaCa2 cells into a distal site of the sciatic nerve of nude mice, mice were randomized into two groups: intraperitoneal injection of PYP1 (20 mg/kg) or vehicle. Mice were treated twice a week for 3 weeks, and their sciatic nerve function was assessed weekly for 7 weeks (n = 7 per group). Treatment with PYP1 reduced P-ERK levels compared with controls (Figure 6, A and B), without changing the expression of total ERK (data not shown). In the control group, mice began to develop left hind limb paralysis 5 weeks after tumor implantation. Of the seven mice in this group, five were fully paralyzed by week 7, and one had mild paresis (Figure 6, C). In contrast, six of the seven mice that were treated with PYP1 had normal hind limb function at week 7 (Figure 6, D). We used a high-resolution ultrasound weekly to measure the sciatic nerve diameter at a site 5 mm proximal to the cancer cell injection site (30). In the control group, we found that increasing proximal nerve invasion was associated with decreasing sciatic nerve function from weeks 5 to 7 (Figure 6). In contrast, both parameters remained normal in the PYP1 treatment group. As an additional measure of sciatic nerve function, we followed the hind limb paw span (sciatic nerve index) in both groups. In the control group, there was a statistically significant decrease in left hind limb sciatic nerve index (from 9.2 mm, 95% CI = 8.98 to 9.42 mm to 5.2 mm, 95% CI = 3.35 to 7.05 mm at weeks 1 and 7, respectively; difference = 4.0 mm; P = .006; n = 7), whereas in the treatment group, no change in sciatic nerve index was observed (9.3 mm 95% CI = 8.93 to 9.67 mm and 8.9 mm, 95% CI = 8.23 to 9.57 mm for weeks 1 and 7, respectively, n = 7).
Figure 6.
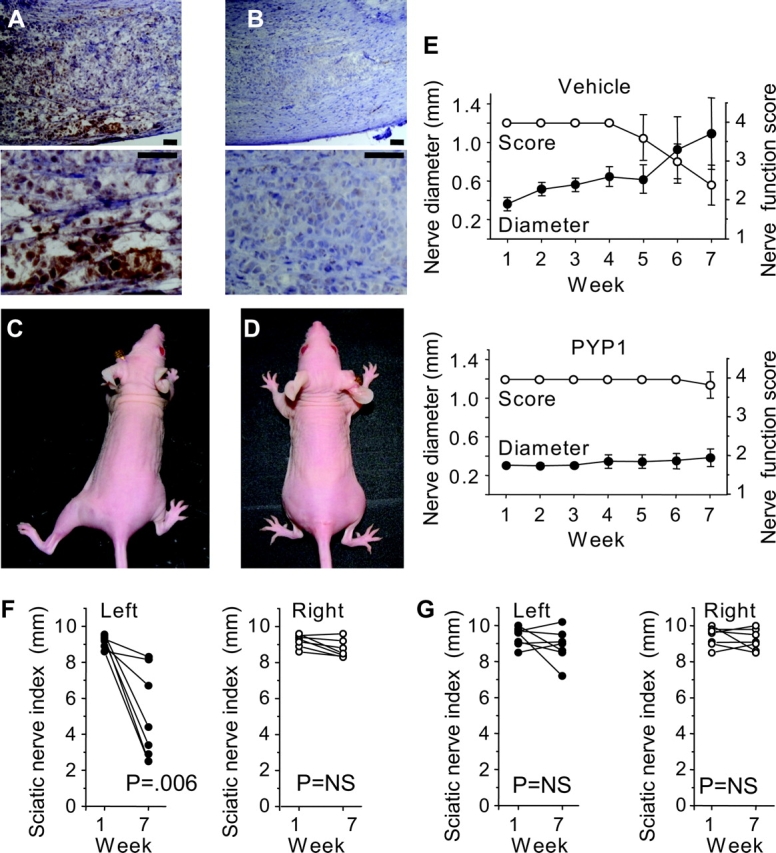
Prevention of cancer-induced sciatic nerve paralysis in vivo. MiaPaCa2 cells were implanted in a distal part of the left sciatic nerve and treated at day 7 with vehicle or pyrazolopyrimidine-1 (PYP1) (20 mg/kg) twice a week for 3 weeks. A) Low- and high-magnification images (top and bottom, respectively) of immunohistochemical staining of tumors for phosphorylated extracellular signal–regulated kinase (ERK) (brown), in control mice, second week during treatment (scale bars = 60 μm). B) Effect of systemic treatment with PYP1 on levels of phosphorylated ERK, second week during treatment (scale bars = 60 μm). C and D) Representative images of mice 7 weeks after tumor implantation showing left hind limb paralysis in the vehicle group (C) compared with normal function in the PYP1 treatment group (D). E) Mean left sciatic nerve function score (open circles, right y axis) and proximal nerve diameter (closed circles, left y axis) of vehicle (upper graph) and of PYP1-treated mice (lower graph). Nerve score of four indicates normal function and one indicates total paralysis. Nerve diameter was measured weekly using a small animal high-resolution ultrasound. F) Sciatic nerve index (paw span in millimeters) of vehicle-treated mice, 1 and 7 weeks after tumor implantation. Left (ipsilateral) sciatic nerve index (injected with MiaPaCa2 cells), closed circles (n = 7); right (contralateral) side (injected with saline), open circles (n = 7). G) Sciatic nerve index in the PYP1-treated group. There was no statistically significant difference between weeks 1 and 7 between the tumor bearing and control sides (n = 7 each group). P values were calculated by using two-sided Student t test. NS- not significant.
All mice were killed at week 7, and their sciatic nerves were excised for histopathologic analysis. The tumor diameter at the point of implantation was similar in both groups. However, proximal nerve diameter in the control group (reflecting neural invasion) was larger compared with that in the treatment group (Figure 7) (1.94 mm, 95% CI = 1.4 to 2.48 mm vs 0.56 mm, 95% CI = 0.47 to 0.65 mm, difference = 1.38 mm; P = .003). Immunostaining for cytokeratin 8/18 confirmed cancer cell invasion along the nerve in the control group but not in the PYP1 group. In situ images of control mice showed extensive neural invasion by tumors, which unidirectionally invaded the sciatic nerve proximally toward the spinal cord. In contrast, PYP1-treated mice had tumors that remained localized to the implantation site. Similar results were observed with small animal magnetic resonance imaging and with high-resolution ultrasound (Figure 7; Supplementary Figure 6, available online).
Figure 7.

Neural invasion in vivo after systemic treatment with pyrazolopyrimidine-1 (PYP1). A) Histological analysis of nerve specimens to measure primary tumor sizes in vehicle- and PYP1-treated mice (P = .09, n = 7). Error bars represent 95% confidence intervals (CIs). B) The proximal diameter of the sciatic nerve (measured 5 mm from implantation site toward the spinal cord) was smaller in the PYP1-treated group compared with the vehicle group (P = .003, n = 7). The dashed line indicates the mean diameter of a normal nerve (0.54 mm). Error bars represent 95% CIs. C) Immunostaining for MiaPaCa2 cells in the vehicle-treated mouse showing extensive tumor infiltration (cytokeratin 8/18 staining, scale bar = 0.25 mm). D) Apart from positive staining of the nerve sheath epithelium, cytokeratin staining of the proximal nerve in a PYP1-treated mouse was negative. E) In situ image of the sciatic nerve in a vehicle-treated mouse showing proximal nerve infiltration. Arrowheads indicate tumor implantation site; arrows indicate the proximal sciatic nerve before entering the spine. F) In situ image of the sciatic nerve in a PYP1-treated mouse showing normal nerve diameter proximal to the injection site. G) Magnetic resonance images (MRI, T1 with gadolinium) of a vehicle-treated mouse showing thickness and enhancement of the left sciatic nerve toward the spine (tumor dimensions 6 × 3 × 4 mm). Red lines delineate the extent of the tumor infiltrating the sciatic nerve. H) A PYP1-treated mouse (MRI, T1 with gadolinium) showing normal nerve diameter proximal to the tumor (tumor dimensions 2 × 3 × 4 mm). I) T2 MRI sequence of a control mouse and (J) of a PYP1-treated mouse. Images taken 7 weeks after tumor implantation (n = 4). P values were calculated by using two-sided Student t test.
Coexpression of RET and GFRα1 in Human Pancreatic Cancer Cells
We next investigated whether tumor specimens excised from patients with neuroinvasive pancreatic adenocarcinoma express RET and GFRα1 receptors. All patients (n = 15) had perineural invasion (Supplementary Table 1, available online). We analyzed the tumor specimens using double immunohistochemical staining and confocal microscopy (Figure 8). RET and GFRα1 expression was evaluated in tumor foci and adjacent normal tissue. Immunofluorescence revealed high expression of RET and GFRα1 in human pancreatic cancers (Figure 8, A–C). High-resolution confocal imaging confirmed that the two receptors are coexpressed by the same population of cancer cells (Figure 8, D–F). Similarly, nerves invaded by cancer also showed high levels of RET and GFRα1 expression by the invading cancer cells (Figure 8, G–H). Relative to the tumor cells, nerves did not expressed high levels of these receptors. All tumors expressed RET and GFRα1, and expression was higher in tumor tissue than in adjacent normal stroma in 10 of the 15 specimens (Figure 8, I).
Figure 8.

RET and GFRα1 receptor coexpression in human neuroinvasive pancreatic adenocarcinomas. A) A low-magnification hematoxylin and eosin (H&E) image of a pancreatic carcinoma tumor specimen (A–C, scale bar = 2 mm). B) Immunofluorescence image of the same specimen using anti-RET antibodies (green, Alexa 485). C) Immunofluorescence with anti-GFRα1 antibodies (red, Alexa 565). D) High-magnification image of RET-green (Alexa 485), (E) GFRα1-red (Alexa 595), and (F) overlay image showing coexpression of both receptors. The nuclei are stained in blue (4′-6-diamidino-2-phenylindole [DAPI]). G) H&E image of nerve invasion by pancreatic adenocarcinoma (arrow indicates tumor and arrowhead shows nerve). H) An overlay immunofluorescence image; GFRα1 (red), RET (green), and DAPI (blue) demonstrating expression of both receptors within the neural-invading cancer cells. I) Relative intensity and area of immunofluorescence signal of RET and GFRα1 in cancerous (gray bars) and adjacent normal (open bars) tissue (n = 15). P values were calculated using two-sided Student t test. Means and 95% confidence intervals from 15 patients are shown.
Discussion
Nerves secrete proteins that participate in dendritic and axonal growth and development (3,7). Using mouse models, we showed that neuroinvasive cancer cells undergo marked morphological changes in response to nerve microenvironment that lead to nerve invasion. Nerve invasion was dependent on GDNF secretion and mitogen-activated protein kinase activity. GDNF coreceptors RET and GFRα1 were highly expressed in human pancreatic carcinomas by the same population of cells.
GDNF is secreted by nerves and creates a soluble gradient with increased concentration along the axon toward the soma (31). The mechanism by which GDNF induces morphological transformation and cell migration is likely mediated through RET phosphorylation and through filopodia and lamellipodia formation (16,32). Activation of the mitogen-activated protein kinase pathway by GDNF-GFRα1-RET signaling was shown to induce cell migration in other systems, including corneal (33) and epithelial (5), and nerve cells (34). The effect of GDNF can be augmented by RET activity (35), G691S RET polymorphism (9) and by an inflammatory response (17). Clinical studies have shown an association between expression of RET and GFRα1 and poorer survival of patients with pancreatic and bile duct carcinomas (20,36). High expression of RET receptors was also found in patients with prostate and breast carcinoma (17,37).
Cancer cell invasion was blocked by treatment with PYP1, a potent RET inhibitor (28,29) and a less potent inhibitor of c-Src (38). Because both RET and c-Src are involved in ERK phosphorylation (39), it is possible that PYP1 can inhibit nerve invasion by targeting two downstream proteins along the activation pathway. It is also possible that PYP1 targets other receptors that are involved in nerve invasion by cancer.
Our study has some limitations. First, it is not known to what extent our principal finding can be generalized to cell lines other than those examined here. Furthermore, in this work, we investigate the migration of pancreatic carcinoma cells along DRG neurites, and further studies are required to examine the clinical relevance of this finding. Finally, our research focuses on one aspect of cancer–nerves interactions, and other factors including adhesion molecules, cytokines, matrix metalloproteinases, and additional growth factors may be involved in this process (40).
Understanding the mechanism of PNMC is the first step in the development of pharmacological means to inhibit the neuroinvasion of pancreatic cancers. Treatment directed against neural invasion could theoretically prevent the local extension of cancer to the central nervous system, preserve nerve function, reduce neuropathic pain, and prolong survival. Such treatment might, in the future, be offered as an adjuvant therapy to enhance conventional therapy for pancreatic cancer.
Funding
US-Israel, Binational Science Foundation 2007312 (to Z.G., Y.F., and R.J.W.); Israeli Science Foundation, Legacy Heritage Fund 1680/08 (to Z.G.); Israel Cancer Association 2009068 (to Z.G.); Intramural Grant form Tel Aviv Sourasky Medical Center (to Z.G.); Flight Attendant Medical Research Institute, Clinical innovator award (to R.J.W), R21DE019015 (to R.J.W.).
Supplementary Material
Footnotes
The sponsors had no role in the study design, the collection of the data, interpretation of the results, the preparation of the manuscript, or the decision to submit the manuscript for publication.
We are grateful to Drs S. Silberberg, J. Bromberg, and R. Blasberg for their helpful discussions and comments; Dr K. Manova, Y. Romin, and E. Such for their advice on microscopic imaging; and M. Greenblatt for editorial assistance. The GDNF knockout mice were a generous gift of Dr M. Saarma. Z.G. is grateful to Dan M. Fliss and Gabi Barbash for making this project possible.
References
- 1.Nakao A, Harada A, Nonami T, Kaneko T, Takagi H. Clinical significance of carcinoma invasion of the extrapancreatic nerve plexus in pancreatic cancer. Pancreas. 1996;12(4):357–361. doi: 10.1097/00006676-199605000-00006. [DOI] [PubMed] [Google Scholar]
- 2.Liebig C, Ayala G, Wilks JA, Berger DH, Albo D. Perineural invasion in cancer: a review of the literature. Cancer. 2009;115(15):3379–3391. doi: 10.1002/cncr.24396. [DOI] [PubMed] [Google Scholar]
- 3.Airaksinen MS, Saarma M. The GDNF family: signalling, biological functions and therapeutic value. Nat Rev Neurosci. 2002;3(5):383–394. doi: 10.1038/nrn812. [DOI] [PubMed] [Google Scholar]
- 4.Durbec P, Marcos-Gutierrez CV, Kilkenny C, et al. GDNF signalling through the Ret receptor tyrosine kinase. Nature. 1996;381(6585):789–793. doi: 10.1038/381789a0. [DOI] [PubMed] [Google Scholar]
- 5.Tang MJ, Worley D, Sanicola M, Dressler GR. The RET-glial cell-derived neurotrophic factor (GDNF) pathway stimulates migration and chemoattraction of epithelial cells. J Cell Biol. 1998;142(5):1337–1345. doi: 10.1083/jcb.142.5.1337. [DOI] [PMC free article] [PubMed] [Google Scholar]
- 6.Pozas E, Ibanez CF. GDNF and GFRalpha1 promote differentiation and tangential migration of cortical GABAergic neurons. Neuron. 2005;45(5):701–713. doi: 10.1016/j.neuron.2005.01.043. [DOI] [PubMed] [Google Scholar]
- 7.Pichel JG, Shen L, Sheng HZ, et al. Defects in enteric innervation and kidney development in mice lacking GDNF. Nature. 1996;382(6586):73–76. doi: 10.1038/382073a0. [DOI] [PubMed] [Google Scholar]
- 8.Manie S, Santoro M, Fusco A, Billaud M. The RET receptor: function in development and dysfunction in congenital malformation. Trends Genet. 2001;17(10):580–589. doi: 10.1016/s0168-9525(01)02420-9. [DOI] [PubMed] [Google Scholar]
- 9.Sawai H, Okada Y, Kazanjian K, et al. The G691S RET polymorphism increases glial cell line-derived neurotrophic factor-induced pancreatic cancer cell invasion by amplifying mitogen-activated protein kinase signaling. Cancer Res. 2005;65(24):11536–11544. doi: 10.1158/0008-5472.CAN-05-2843. [DOI] [PubMed] [Google Scholar]
- 10.Veit C, Genze F, Menke A, et al. Activation of phosphatidylinositol 3-kinase and extracellular signal-regulated kinase is required for glial cell line-derived neurotrophic factor-induced migration and invasion of pancreatic carcinoma cells. Cancer Res. 2004;64(15):5291–5300. doi: 10.1158/0008-5472.CAN-04-1112. [DOI] [PubMed] [Google Scholar]
- 11.Walsh GS, Orike N, Kaplan DR, Miller FD. The invulnerability of adult neurons: a critical role for p73. J Neurosci. 2004;24(43):9638–9647. doi: 10.1523/JNEUROSCI.1299-04.2004. [DOI] [PMC free article] [PubMed] [Google Scholar]
- 12.Ayala GE, Wheeler TM, Shine HD, et al. In vitro dorsal root ganglia and human prostate cell line interaction: redefining perineural invasion in prostate cancer. Prostate. 2001;49(3):213–223. doi: 10.1002/pros.1137. [DOI] [PubMed] [Google Scholar]
- 13.Rubinson DA, Dillon CP, Kwiatkowski AV, et al. A lentivirus-based system to functionally silence genes in primary mammalian cells, stem cells and transgenic mice by RNA interference. Nat Genet. 2003;33(3):401–406. doi: 10.1038/ng1117. [DOI] [PubMed] [Google Scholar]
- 14.Hu D, Hu R, Berde CB. Neurologic evaluation of infant and adult rats before and after sciatic nerve blockade. Anesthesiology. 1997;86(4):957–965. doi: 10.1097/00000542-199704000-00026. [DOI] [PubMed] [Google Scholar]
- 15.Mashour GA, Moulding HD, Chahlavi A, et al. Therapeutic efficacy of G207 in a novel peripheral nerve sheath tumor model. Exp Neurol. 2001;169(1):64–71. doi: 10.1006/exnr.2001.7641. [DOI] [PubMed] [Google Scholar]
- 16.Okada Y, Takeyama H, Sato M, et al. Experimental implication of celiac ganglionotropic invasion of pancreatic-cancer cells bearing c-ret proto-oncogene with reference to glial-cell-line-derived neurotrophic factor (GDNF) Int J Cancer. 1999;81(1):67–73. doi: 10.1002/(sici)1097-0215(19990331)81:1<67::aid-ijc13>3.0.co;2-v. [DOI] [PubMed] [Google Scholar]
- 17.van Weering DH, Bos JL. Glial cell line-derived neurotrophic factor induces Ret-mediated lamellipodia formation. J Biol Chem. 1997;272(1):249–254. doi: 10.1074/jbc.272.1.249. [DOI] [PubMed] [Google Scholar]
- 18.Esseghir S, Todd SK, Hunt T, et al. A role for glial cell derived neurotrophic factor induced expression by inflammatory cytokines and RET/GFR alpha 1 receptor up-regulation in breast cancer. Cancer Res. 2007;67(24):11732–11741. doi: 10.1158/0008-5472.CAN-07-2343. [DOI] [PubMed] [Google Scholar]
- 19.Esseghir S, Reis-Filho JS, Kennedy A, et al. Identification of transmembrane proteins as potential prognostic markers and therapeutic targets in breast cancer by a screen for signal sequence encoding transcripts. J Pathol. 2006;210(4):420–430. doi: 10.1002/path.2071. [DOI] [PubMed] [Google Scholar]
- 20.Garnis C, Davies JJ, Buys TP, et al. Chromosome 5p aberrations are early events in lung cancer: implication of glial cell line-derived neurotrophic factor in disease progression. Oncogene. 2005;24(30):4806–4812. doi: 10.1038/sj.onc.1208643. [DOI] [PubMed] [Google Scholar]
- 21.Iwahashi N, Nagasaka T, Tezel G, et al. Expression of glial cell line-derived neurotrophic factor correlates with perineural invasion of bile duct carcinoma. Cancer. 2002;94(1):167–174. doi: 10.1002/cncr.10169. [DOI] [PubMed] [Google Scholar]
- 22.Lin LF, Doherty DH, Lile JD, Bektesh S, Collins F. GDNF: a glial cell line-derived neurotrophic factor for midbrain dopaminergic neurons. Science. 1993;260(5111):1130–1132. doi: 10.1126/science.8493557. [DOI] [PubMed] [Google Scholar]
- 23.Grimm L, Holinski-Feder E, Teodoridis J, et al. Analysis of the human GDNF gene reveals an inducible promoter, three exons, a triplet repeat within the 3′-UTR and alternative splice products. Hum Mol Genet. 1998;7(12):1873–1886. doi: 10.1093/hmg/7.12.1873. [DOI] [PubMed] [Google Scholar]
- 24.Funahashi H, Takeyama H, Sawai H, et al. Alteration of integrin expression by glial cell line-derived neurotrophic factor (GDNF) in human pancreatic cancer cells. Pancreas. 2003;27(2):190–196. doi: 10.1097/00006676-200308000-00013. [DOI] [PubMed] [Google Scholar]
- 25.Funahashi H, Okada Y, Sawai H, et al. The role of glial cell line-derived neurotrophic factor (GDNF) and integrins for invasion and metastasis in human pancreatic cancer cells. J Surg Oncol. 2005;91(1):77–83. doi: 10.1002/jso.20277. [DOI] [PubMed] [Google Scholar]
- 26.Song H, Moon A. Glial cell-derived neurotrophic factor (GDNF) promotes low-grade Hs683 glioma cell migration through JNK, ERK-1/2 and p38 MAPK signaling pathways. Neurosci Res. 2006;56(1):29–38. doi: 10.1016/j.neures.2006.04.019. [DOI] [PubMed] [Google Scholar]
- 27.Cullen-McEwen LA, Drago J, Bertram JF. Nephron endowment in glial cell line-derived neurotrophic factor (GDNF) heterozygous mice. Kidney Int. 2001;60(1):31–36. doi: 10.1046/j.1523-1755.2001.00767.x. [DOI] [PubMed] [Google Scholar]
- 28.Carlomagno F, Vitagliano D, Guida T, et al. The kinase inhibitor PP1 blocks tumorigenesis induced by RET oncogenes. Cancer Res. 2002;62(4):1077–1082. [PubMed] [Google Scholar]
- 29.Carniti C, Perego C, Mondellini P, Pierotti MA, Bongarzone I. PP1 inhibitor induces degradation of RETMEN2A and RETMEN2B oncoproteins through proteosomal targeting. Cancer Res. 2003;63(9):2234–2243. [PubMed] [Google Scholar]
- 30.Gil Z, Rein A, Brader P, et al. Nerve-sparing therapy with oncolytic herpes virus for cancers with neural invasion. Clin Cancer Res. 2007;13(21):6479–6485. doi: 10.1158/1078-0432.CCR-07-1639. [DOI] [PubMed] [Google Scholar]
- 31.Batchelor PE, Liberatore GT, Wong JY, et al. Activated macrophages and microglia induce dopaminergic sprouting in the injured striatum and express brain-derived neurotrophic factor and glial cell line-derived neurotrophic factor. J Neurosci. 1999;19(5):1708–1716. doi: 10.1523/JNEUROSCI.19-05-01708.1999. [DOI] [PMC free article] [PubMed] [Google Scholar]
- 32.Fukuda T, Kiuchi K, Takahashi M. Novel mechanism of regulation of Rac activity and lamellipodia formation by RET tyrosine kinase. J Biol Chem. 2002;277(21):19114–19121. doi: 10.1074/jbc.M200643200. [DOI] [PubMed] [Google Scholar]
- 33.You L, Ebner S, Kruse FE. Glial cell-derived neurotrophic factor (GDNF)-induced migration and signal transduction in corneal epithelial cells. Invest Ophthalmol Vis Sci. 2001;42(11):2496–2504. [PubMed] [Google Scholar]
- 34.Trupp M, Scott R, Whittemore SR, Ibanez CF. Ret-dependent and -independent mechanisms of glial cell line-derived neurotrophic factor signaling in neuronal cells. J Biol Chem. 1999;274(30):20885–20894. doi: 10.1074/jbc.274.30.20885. [DOI] [PubMed] [Google Scholar]
- 35.Sariola H, Saarma M. Novel functions and signalling pathways for GDNF. J Cell Sci. 2003;116(pt 19):3855–3862. doi: 10.1242/jcs.00786. [DOI] [PubMed] [Google Scholar]
- 36.Ito Y, Okada Y, Sato M, et al. Expression of glial cell line-derived neurotrophic factor family members and their receptors in pancreatic cancers. Surgery. 2005;138(4):788–794. doi: 10.1016/j.surg.2005.07.007. [DOI] [PubMed] [Google Scholar]
- 37.Dawson DM, Lawrence EG, MacLennan GT, et al. Altered expression of RET proto-oncogene product in prostatic intraepithelial neoplasia and prostate cancer. J Natl Cancer Inst. 1998;90(7):519–523. doi: 10.1093/jnci/90.7.519. [DOI] [PubMed] [Google Scholar]
- 38.Hanke JH, Gardner JP, Dow RL, et al. Discovery of a novel, potent, and Src family-selective tyrosine kinase inhibitor. Study of Lck- and FynT-dependent T cell activation. J Biol Chem. 1996;271(2):695–701. doi: 10.1074/jbc.271.2.695. [DOI] [PubMed] [Google Scholar]
- 39.Melillo RM, Barone MV, Lupoli G, et al. Ret-mediated mitogenesis requires Src kinase activity. Cancer Res. 1999;59(5):1120–1126. [PubMed] [Google Scholar]
- 40.Croyle M, Akeno N, Knauf JA, et al. RET/PTC-induced cell growth is mediated in part by epidermal growth factor receptor (EGFR) activation: evidence for molecular and functional interactions between RET and EGFR. Cancer Res. 2008;68(11):4183–4191. doi: 10.1158/0008-5472.CAN-08-0413. [DOI] [PMC free article] [PubMed] [Google Scholar]
Associated Data
This section collects any data citations, data availability statements, or supplementary materials included in this article.